| Study Period | 2017 - 2030 |
| Base Year For Estimation | 2024 |
| Forecast Data Period | 2025 - 2030 |
| Market Size (2025) | USD 3.55 Billion |
| Market Size (2030) | USD 4.2 Billion |
| CAGR (2025 - 2030) | 3.47 % |
| Market Concentration | Medium |
Major Players*Disclaimer: Major Players sorted in no particular order |

Vietnam Fertilizers Market Analysis
The Vietnam Fertilizers Market size is estimated at 3.55 billion USD in 2025, and is expected to reach 4.2 billion USD by 2030, growing at a CAGR of 3.47% during the forecast period (2025-2030).
Vietnam's agricultural sector is undergoing significant transformation, driven by modernization initiatives and technological advancement. The government's commitment to agricultural development is evident through its substantial investment of USD 4.4 billion in hi-tech agriculture announced in 2021, focusing on precision farming and sustainable practices. This investment has catalyzed the adoption of advanced irrigation systems, computerized crop management systems, and automated fertilization procedures across the country. The agricultural sector's contribution of 14.85% to the country's GDP underscores its vital role in the national economy, while also highlighting the potential for further growth through modernization.
The landscape of fertilizer application is evolving with the increasing adoption of precision agriculture techniques and sustainable farming practices. Vietnamese farmers are gradually transitioning from traditional open-field cultivation to protected cultivation, implementing greenhouse technology and automated irrigation systems. This shift is particularly notable in the horticultural sector, where approximately 35,000 hectares are now dedicated to specialized cultivation of ornamental plants and flowers, excluding small-scale household farms. The implementation of new and highly productive seedlings, coupled with advanced fertilization procedures and automatically adjusted environmental controls, is revolutionizing crop cultivation methods.
International trade agreements are reshaping Vietnam's agricultural export landscape and influencing fertilizer usage patterns. The implementation of the free trade agreement between the European Union and Vietnam for horticultural crop exports in 2023 has opened new opportunities for farmers while simultaneously raising quality standards for agricultural products. This development has prompted farmers to adopt more sophisticated fertilization techniques and products to meet international quality standards. The Ministry of Agriculture and Rural Development reports a strong increase in demand for flowers and bonsai trees, indicating diversification in agricultural production beyond traditional crops.
The fertilizer industry is witnessing a shift toward environmentally sustainable practices and improved efficiency in nutrient delivery systems. Farmers are increasingly adopting specialty fertilizers that offer precise nutrient delivery and reduced environmental impact. The country's agricultural sector is actively implementing the Agricultural Restructuring Program (ARP), which emphasizes modern, efficient, and environmentally friendly agricultural practices. This program has led to the development of better flower and vegetable varieties through the application of hybrid technology and post-harvest techniques, creating new demands for specialized fertilizer products. The focus on sustainable agriculture is further reinforced by the government's initiatives to reduce production costs while maintaining crop quality and productivity.
Vietnam Fertilizers Market Trends
The Vietnamese government has been promoting policies to reduce production costs, which is expected to increase the cultivation area under field crops
- Vietnam dedicates substantial acreages to field crops; major cultivations include rice, maize (corn), and various other staples. The country's diverse climate and topography allow the cultivation of a wide range of crops. However, the area under the cultivation of field crops in Vietnam decreased by 6.6% during the study period.
- Rice is a primary field crop in Vietnam, reflecting its importance as a staple food, and it occupies the maximum area under cultivation, accounting for an 81.8% share, followed by corn with a 10.2% share. In 2022, rice production volume in Vietnam amounted to approximately 43.9 million metric tons. Vietnam is one of the leading rice producers and exports to countries worldwide.
- There are three major cropping seasons during a year: winter-spring or early season, summer-autumn or midseason, and autumn-winter or a longer rainy season crop. Major agricultural regions in the country include the Red River Delta, the Mekong River Delta, and the Southern Terrace region. Rice is the principal crop in all three regions. Half of Vietnam's exported rice comes from the Mekong Delta.
- The Vietnamese government has been promoting policies to reduce production costs by reducing fertilizer and pesticide usage and encouraging farm-made or locally-produced fertilizers to increase field crops' productivity, quality, and profit. The increasing incidence of crop failures due to a lack of nutrients and the rise in the requirement of high-efficiency fertilizers to prevent dwarfism in plants are some of the other factors contributing to the growth of the Vietnam fertilizers market.

Understand The Key Trends Shaping This Market
Download PDF
Nitrogen is a vital nutrient required for a range of field crops, and its application is very high
- The average application rate of primary nutrients in field crops was 123.94 kg per hectare in 2022. Among field crops, grains and cereals comprise the largest segment in terms of fertilizer consumption in Vietnam. The top-producing cereals in Vietnam are rice, wheat, and maize. The average primary nutrient application rates of these field crops were 155.49 kg/ha, 228.90 kg/ha, and 148.49 kg/ha, respectively, in the same year.
- Among all the primary nutrients, nitrogen is applied in a higher quantity, which is 221.43 kg/hectare on average for the field crops because nitrogen aids in increased tillering, leaf area development, grain formation, grain filling, and protein synthesis and also enhances grain yield and grain quality in field crops. Wheat has the maximum nitrogen application rate, which is 492.06 kg per hectare, followed by rice with 328.04 kg per hectare.
- In Vinh Phuc province of Vietnam, large areas of the soil are degraded and characterized by low organic matter; total available nitrogen is less than 0.08%, total phosphorus is below 0.04%, and total potassium is below 1.0%. Also, the available P is less than 10 ppm. These nutrient deficiencies led to an increase in the average fertilizer consumption in Vietnam from 49.2 kg/ha in 1969 to 415.3 kilograms per hectare by 2018, increasing at an average annual growth rate of 6.71%. In Vietnam, 43% of the population is involved in agriculture, but the production capacity is still less than one-fifth of the total GDP of the country, grossing only about 12.36%. Hence, to stabilize the production of agricultural products, the demand for fertilizers is further increasing, driving the growth of the Vietnam fertilizers market.

OTHER KEY INDUSTRY TRENDS COVERED IN THE REPORT
- The growing demand for fresh produce from the country in other nations is increasing the cultivation area under horticultural crops
- Manganese is the most applied micronutrient in vegetable crops due to its role in photosynthesis and carbohydrate synthesis
- Calcium has the highest demand with the average application rate of 42.7 kg/ha
- The Mekong Delta and Red River Delta are the regions with the most irrigation systems in the agriculture sector
- Vietnamese soils are low in zinc with15.0 mg/kg. However, recommended zinc content stands at of 200.0 mg/kg of soil.
- Among the various crops, okra ranks as the highest nitrogen consumer, with a substantial application rate of 218.69 kg/ha
- Calcium contributes to the plant tissue development and its role in promoting overall plant growth
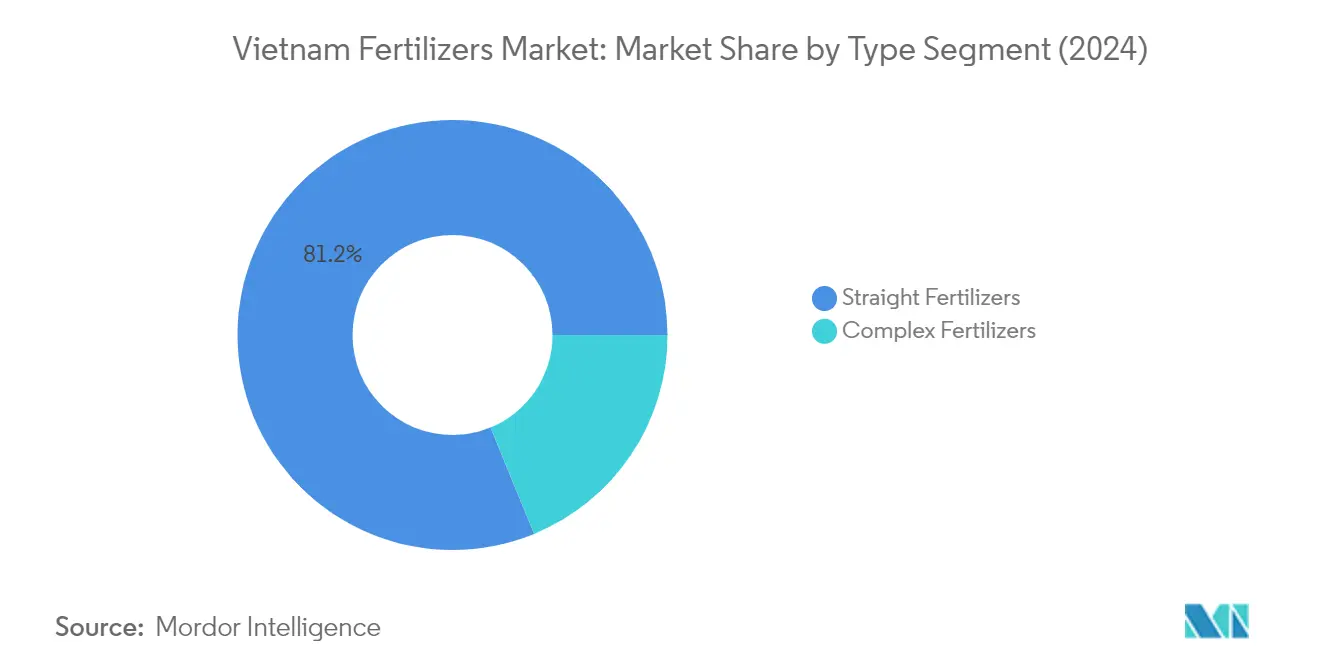
Segment Analysis: Type
Straight Fertilizers Segment in Vietnam Fertilizers Market
Straight fertilizers dominate the Vietnam fertilizer market, commanding approximately 81% market share in 2024. These fertilizers, which supply only one nutrient to crops, are particularly favored due to their flexibility in providing specific plant nutrients based on crop requirements. The segment's prominence is largely attributed to the extensive use of nitrogenous fertilizers, which constitute about 60% of straight fertilizer consumption, followed by phosphorus and potassium at roughly 26% and 13%, respectively. The widespread adoption of straight fertilizers is further supported by their higher availability and adaptability by farmers across Vietnam. The conventional variants account for nearly 65% of straight fertilizers, while specialty fertilizers make up the remaining portion, reflecting the market's preference for traditional fertilization methods.
Complex Fertilizers Segment in Vietnam Fertilizers Market
Complex fertilizers, which provide multiple crop nutrients to crops in a single application, represent a significant segment in Vietnam's fertilizer market. These fertilizers are particularly valued for their higher nutrient content per granule and lower application rates, making them an efficient choice for farmers. The adoption of advanced fertilizers such as Controlled Release Fertilizers (CRF), Slow Release Fertilizers (SRF), water-soluble, and liquid fertilizers continues to drive demand in this segment. Additionally, the increasing use of customized fertilizers tailored to specific crops and soil conditions further strengthens the demand for specialty complex fertilizers, though conventional variants currently maintain a dominant position due to traditional farming practices and cost considerations.
Segment Analysis: Form
Conventional Segment in Vietnam Fertilizers Market
The conventional fertilizers segment continues to dominate the Vietnam fertilizer market, holding approximately 71% market share in 2024. This dominance can be attributed to several factors, including their widespread availability, established distribution networks, and lower costs compared to specialty variants. Field crops account for nearly 81% of conventional fertilizer usage, particularly in rice cultivation, which remains Vietnam's primary agricultural activity. The segment's strong position is further reinforced by government subsidies that help maintain lower prices for conventional fertilizers, making them the preferred choice for most farmers who operate on tight budgets. Additionally, the familiarity of farmers with traditional application methods and the proven effectiveness of conventional fertilizers in Vietnam's diverse agricultural conditions contribute to their continued market leadership.
Controlled Release Fertilizers (CRF) Segment in Vietnam Fertilizers Market
The Controlled Release Fertilizers (CRF) segment is emerging as the most dynamic growth sector in Vietnam's fertilizer market, projected to expand at approximately 4% CAGR from 2024 to 2029. This growth is primarily driven by the increasing adoption of modern farming practices and the rising awareness about the benefits of controlled nutrient release. The segment's expansion is further supported by Vietnam's vision to become a leading global agriculture sector by 2050, emphasizing modern, efficient, and environmentally friendly agricultural practices. CRF's ability to reduce nutrient leaching, minimize environmental impact, and provide sustained nutrition throughout the crop cycle is attracting progressive farmers, particularly in high-value crop cultivation. The government's push towards sustainable agriculture and the implementation of new farming technologies is expected to further accelerate the adoption of CRF in the coming years.
Remaining Segments in Form Segmentation
The other segments in Vietnam's fertilizer market include Slow Release Fertilizers (SRF), Water Soluble Fertilizers, and Liquid Fertilizers, each serving specific agricultural needs and applications. Water-soluble fertilizers are gaining prominence in precision farming and greenhouse cultivation, while liquid fertilizers are preferred for foliar applications and fertigation systems. SRF products, though representing a smaller market share, are finding increased acceptance in specialized applications where controlled nutrient release is crucial but at a slower rate than CRF. These segments collectively contribute to the market's diversification, offering farmers a wide range of options to meet their specific crop nutrition needs and application preferences. The growing adoption of modern irrigation systems and protected cultivation methods is expected to drive the demand for these specialty fertilizer segments.
Segment Analysis: Application Mode
Soil Application Segment in Vietnam Fertilizers Market
Soil application continues to maintain its dominant position in the Vietnam fertilizers market, commanding approximately 96% of the total market share in 2024. This overwhelming preference for soil application can be attributed to several factors, including its widespread adoption in field crops, which constitute over 81% of the agricultural landscape. The segment's strength is further reinforced by the extensive use of conventional fertilizers, which account for nearly 89% of soil application methods. The Agricultural Restructuring Program (ARP) has played a crucial role in maintaining soil application's market leadership by promoting modern farming techniques while ensuring environmental sustainability. Additionally, the Vietnam Agriculture Competitiveness Project has emphasized the optimization of soil application methods to enhance productivity and resource efficiency, particularly in regions facing agricultural challenges such as the Mekong Delta.
Fertigation Segment in Vietnam Fertilizers Market
The fertigation segment is emerging as the most dynamic growth sector in Vietnam's fertilizers market, driven by the increasing adoption of modern irrigation systems and precision farming techniques. The Asian Development Bank's support in modernizing irrigation systems, particularly in drought-affected areas, has created a strong foundation for fertigation growth. The segment's expansion is further supported by its numerous advantages, including precise nutrient delivery, reduced fertilizer wastage, and improved water use efficiency. The Ministry of Agriculture and Rural Development's emphasis on sustainable farming practices has also contributed to fertigation's growing popularity, especially in high-value crop production. The segment particularly benefits from its compatibility with Vietnam's vision of becoming a leading global agriculture sector by 2050, focusing on modern, efficient, and environmentally friendly agricultural practices.
Remaining Segments in Application Mode
The foliar application segment represents a specialized niche in Vietnam's fertilizer market, offering unique advantages in nutrient delivery and absorption efficiency. This method has gained particular importance in the cultivation of high-value crops and during critical growth stages where rapid nutrient uptake is essential. Foliar application has become increasingly relevant in Vietnam's agricultural landscape, especially in regions where soil conditions may limit nutrient uptake through traditional methods. The segment has found particular favor among farmers growing premium crops for export markets, where precise nutrient management is crucial for meeting international quality standards. The method's ability to provide quick correction of nutrient deficiencies and its compatibility with other agricultural inputs has made it an important complementary application mode in Vietnam's diverse agricultural system.
Segment Analysis: Crop Type
Field Crops Segment in Vietnam Fertilizers Market
Field crops dominate the Vietnam fertilizers market, commanding approximately 64% of the total market value in 2024. This significant market share is primarily driven by the extensive cultivation of staple crops like rice, which occupies over 7.3 million hectares of agricultural land. The Ministry of Agriculture and Rural Development has set ambitious production targets, particularly for rice production, aiming to achieve an output of 43-43.9 million tons through intensive farming practices. The segment's dominance is further reinforced by government policies focused on reducing production costs and promoting locally-produced fertilizers to enhance field crop productivity and quality. Despite various environmental and social challenges, the demand for fertilizers in field crop cultivation remains robust, supported by the sector's critical role in ensuring food security and contributing to agricultural exports.
Horticultural Crops Segment in Vietnam Fertilizers Market
The horticultural crops segment is experiencing the fastest growth in Vietnam's fertilizers market, projected to grow at approximately 5% during 2024-2029. This growth is primarily driven by the country's increasing focus on developing hi-tech agriculture, with substantial investments in greenhouse technology, precision irrigation, and computerized crop management systems. The segment's expansion is further supported by free trade agreements with the European Union, opening new export opportunities for Vietnamese horticultural products. The implementation of new and highly-productive seedlings, advanced fertilization procedures, and automatically adjusted light and temperature systems is revolutionizing the sector. Additionally, the transition from traditional open-field cultivation to protected cultivation methods is creating increased demand for specialty fertilizers, particularly in regions focusing on high-value fruit and vegetable production.
Remaining Segments in Crop Type
The turf and ornamental segment, while smaller in market share, plays a vital role in Vietnam's agricultural landscape. This segment primarily serves the growing ornamental plant and flower production industry, which has seen significant development in recent years. The segment benefits from geographical advantages, favorable soil conditions, and climate factors that support ornamental plant cultivation. Traditional villages, particularly around Hanoi, have become important centers for ornamental plant production, contributing to the segment's growth. The segment's development is further supported by the implementation of advanced cultivation techniques, including new seedling varieties and sophisticated nutrient management systems, particularly in major growing regions like Lào Cai, H°ng Yên, and Nam Ënh provinces.
Vietnam Fertilizers Industry Overview
Top Companies in Vietnam Fertilizers Market
The Vietnam fertilizer market is characterized by active product innovation and strategic expansion initiatives from leading players. Companies are focusing on developing new fertilizer formulations, particularly in specialty segments like controlled-release and water-soluble variants, to meet evolving farmer needs and environmental requirements. Operational agility is demonstrated through investments in advanced manufacturing technologies and distribution network optimization, with several players expanding their production facilities to meet growing demand. Strategic moves in the market include partnerships for technology transfer, acquisitions to strengthen market presence, and collaborations with agricultural research institutions. Companies are also expanding their geographical footprint through new manufacturing units and enhanced distribution networks, while simultaneously investing in digital platforms and farmer education programs to drive the adoption of advanced fertilizer solutions.
Local Players Dominate Vietnamese Fertilizer Market
The Vietnamese fertilizer market exhibits a strong presence of domestic players, with state-owned enterprises and local manufacturers holding significant market positions. These local companies leverage their deep understanding of regional agricultural practices and established distribution networks to maintain their competitive edge. The market structure shows moderate consolidation, with the top players accounting for a substantial share while numerous smaller players serve specific regional or product niches. The industry benefits from government support through policies favoring domestic production and distribution.
The competitive dynamics are shaped by a mix of large-scale integrated manufacturers and specialized fertilizer producers. While global players maintain a presence through partnerships and direct operations, local companies continue to dominate the market through their extensive distribution networks and strong relationships with farming communities. The market has witnessed selective merger and acquisition activities, primarily focused on vertical integration and capability enhancement, though the pace of consolidation remains moderate due to regulatory considerations and the strategic importance of the fertilizer sector to national agriculture.
Innovation and Distribution Key to Growth
Success in the Vietnamese fertilizer market increasingly depends on companies' ability to innovate while maintaining cost competitiveness. Incumbent players must focus on developing specialty fertilizer portfolios, investing in sustainable production technologies, and strengthening their distribution networks to maintain market leadership. Digital transformation initiatives, including the adoption of precision agriculture solutions and online distribution platforms, are becoming crucial for market success. Companies also need to build strong relationships with agricultural cooperatives and implement effective farmer education programs to drive the adoption of advanced fertilizer solutions.
For contenders looking to gain market share, the focus should be on identifying and serving underserved market segments, particularly in specialty fertilizers and organic variants. Success factors include developing efficient supply chain networks, establishing strong technical support capabilities, and building partnerships with agricultural extension services. Companies must also navigate the regulatory landscape, particularly regarding environmental compliance and quality standards, while managing the risk of substitution from alternative nutrient sources. The ability to adapt to changing farmer preferences and agricultural practices, while maintaining price competitiveness, will be crucial for long-term success in the fertilizer market.
Vietnam Fertilizers Market Leaders
-
AGRICULTURAL PRODUCTS AND MATERIALS JSC (APROMACO)
-
Baconco
-
Binh Dien Fertilizer JSC (BFC)
-
PetroVietnam Fertilizer and Chemical Corp.
-
Southern Fertilizer JSC
- *Disclaimer: Major Players sorted in no particular order

Need More Details on Market Players and Competitors?
Download PDF
Vietnam Fertilizers Market News
- June 2022: Duc Giang Chemicals Group is expanding production facilities with the total investment for the Duc Giang-Dak Nong Fertilizer Factory Project being USD 13.16 million. It has a 2 lakh ton/year NPK fertilizer-producing capacity.
- April 2022: PetroVietnam Fertilizer and Chemical Corp. launched a new product line of Phu My NPK - microbiology. This is an inorganic fertilizer NPK containing useful microorganisms to improve crop productivity.
- March 2022: The Haifa Group entered a purchase agreement with HORTICOOP BV to acquire Horticoop Andina, the distributor of nutritional products for agriculture. Through this acquisition of the brand, Haifa intends to expand its market presence in the Latin American market and strengthen its position as a global superbrand in advanced plant nutrition.
Free With This Report
Along with the report, We also offer a comprehensive and exhaustive data pack with 25+ graphs on area under cultivation and average application rate per hectare. The data pack includes Globe, North America, Europe, Asia-Pacific, South America, and Africa.


Vietnam Fertilizers Market Report - Table of Contents
1. EXECUTIVE SUMMARY & KEY FINDINGS
2. REPORT OFFERS
3. INTRODUCTION
- 3.1 Study Assumptions & Market Definition
- 3.2 Scope of the Study
- 3.3 Research Methodology
4. KEY INDUSTRY TRENDS
-
4.1 Acreage Of Major Crop Types
- 4.1.1 Field Crops
- 4.1.2 Horticultural Crops
-
4.2 Average Nutrient Application Rates
- 4.2.1 Micronutrients
- 4.2.1.1 Field Crops
- 4.2.1.2 Horticultural Crops
- 4.2.2 Primary Nutrients
- 4.2.2.1 Field Crops
- 4.2.2.2 Horticultural Crops
- 4.2.3 Secondary Macronutrients
- 4.2.3.1 Field Crops
- 4.2.3.2 Horticultural Crops
- 4.3 Agricultural Land Equipped For Irrigation
- 4.4 Regulatory Framework
- 4.5 Value Chain & Distribution Channel Analysis
5. MARKET SEGMENTATION (includes market size in Value in USD and Volume, Forecasts up to 2030 and analysis of growth prospects)
-
5.1 Type
- 5.1.1 Complex
- 5.1.2 Straight
- 5.1.2.1 Micronutrients
- 5.1.2.1.1 Boron
- 5.1.2.1.2 Copper
- 5.1.2.1.3 Iron
- 5.1.2.1.4 Manganese
- 5.1.2.1.5 Molybdenum
- 5.1.2.1.6 Zinc
- 5.1.2.1.7 Others
- 5.1.2.2 Nitrogenous
- 5.1.2.2.1 Urea
- 5.1.2.2.2 Others
- 5.1.2.3 Phosphatic
- 5.1.2.3.1 DAP
- 5.1.2.3.2 MAP
- 5.1.2.3.3 TSP
- 5.1.2.3.4 Others
- 5.1.2.4 Potassic
- 5.1.2.4.1 MoP
- 5.1.2.4.2 SoP
- 5.1.2.4.3 Others
- 5.1.2.5 Secondary Macronutrients
- 5.1.2.5.1 Calcium
- 5.1.2.5.2 Magnesium
- 5.1.2.5.3 Sulfur
-
5.2 Form
- 5.2.1 Conventional
- 5.2.2 Speciality
- 5.2.2.1 CRF
- 5.2.2.2 Liquid Fertilizer
- 5.2.2.3 SRF
- 5.2.2.4 Water Soluble
-
5.3 Application Mode
- 5.3.1 Fertigation
- 5.3.2 Foliar
- 5.3.3 Soil
-
5.4 Crop Type
- 5.4.1 Field Crops
- 5.4.2 Horticultural Crops
- 5.4.3 Turf & Ornamental
6. COMPETITIVE LANDSCAPE
- 6.1 Key Strategic Moves
- 6.2 Market Share Analysis
- 6.3 Company Landscape
-
6.4 Company Profiles
- 6.4.1 AGRICULTURAL PRODUCTS AND MATERIALS JSC (APROMACO)
- 6.4.2 Baconco
- 6.4.3 Binh Dien Fertilizer JSC (BFC)
- 6.4.4 Duc Giang Chemicals Group
- 6.4.5 Grupa Azoty S.A. (Compo Expert)
- 6.4.6 Haifa Group
- 6.4.7 Ninh Binh Phosphate Fertilizer JSC
- 6.4.8 PetroVietnam Fertilizer and Chemical Corp.
- 6.4.9 Southern Fertilizer JSC
- 6.4.10 Yara International ASA
- *List Not Exhaustive
7. KEY STRATEGIC QUESTIONS FOR FERTILIZER CEOS
8. APPENDIX
-
8.1 Global Overview
- 8.1.1 Overview
- 8.1.2 Porter’s Five Forces Framework
- 8.1.3 Global Value Chain Analysis
- 8.1.4 Market Dynamics (DROs)
- 8.2 Sources & References
- 8.3 List of Tables & Figures
- 8.4 Primary Insights
- 8.5 Data Pack
- 8.6 Glossary of Terms
You Can Purchase Parts Of This Report. Check Out Prices For Specific Sections
Get Price Break-up Now
List of Tables & Figures
- Figure 1:
- CULTIVATION OF FIELD CROPS IN HECTARE, VIETNAM, 2017 - 2022
- Figure 2:
- CULTIVATION OF HORTICULTURAL CROPS IN HECTARE, VIETNAM, 2017 - 2022
- Figure 3:
- CONSUMPTION OF MICRONUTRIENTS BY FIELD CROPS IN KG/HECTARE, VIETNAM, 2022
- Figure 4:
- CONSUMPTION OF MICRONUTRIENTS BY HORTICULTURAL CROPS IN KG/HECTARE, VIETNAM, 2022
- Figure 5:
- CONSUMPTION OF PRIMARY NUTRIENTS BY FIELD CROPS IN KG/HECTARE, VIETNAM, 2022
- Figure 6:
- CONSUMPTION OF PRIMARY NUTRIENTS BY HORTICULTURAL CROPS IN KG/HECTARE, VIETNAM, 2022
- Figure 7:
- CONSUMPTION OF SECONDARY MACRONUTRIENTS BY FIELD CROPS IN KG/HECTARE, VIETNAM, 2022
- Figure 8:
- CONSUMPTION OF SECONDARY MACRONUTRIENTS BY HORTICULTURAL CROPS IN KG/HECTARE, VIETNAM, 2022
- Figure 9:
- AGRICULTURAL LAND EQUIPPED FOR IRRIGATION IN HECTARE, VIETNAM, 2022
- Figure 10:
- FERTILIZER FERTILIZER CONSUMPTION IN METRIC TON, VIETNAM, 2017 - 2030
- Figure 11:
- FERTILIZER FERTILIZER CONSUMPTION IN USD, VIETNAM, 2017 - 2030
- Figure 12:
- FERTILIZER CONSUMPTION BY TYPE IN METRIC TON, VIETNAM, 2017 - 2030
- Figure 13:
- FERTILIZER CONSUMPTION BY TYPE IN USD, VIETNAM, 2017 - 2030
- Figure 14:
- FERTILIZER CONSUMPTION VOLUME BY TYPE IN %, VIETNAM, 2017 VS 2023 VS 2030
- Figure 15:
- FERTILIZER CONSUMPTION VALUE BY TYPE IN %, VIETNAM, 2017 VS 2023 VS 2030
- Figure 16:
- FERTILIZER CONSUMPTION IN METRIC TON, VIETNAM, 2017 - 2030
- Figure 17:
- FERTILIZER CONSUMPTION IN USD, VIETNAM, 2017 - 2030
- Figure 18:
- FERTILIZER CONSUMPTION VALUE BY CROP TYPE IN %, VIETNAM, 2023 VS 2030
- Figure 19:
- STRAIGHT FERTILIZER CONSUMPTION BY NUTRIENT IN METRIC TON, VIETNAM, 2017 - 2030
- Figure 20:
- STRAIGHT FERTILIZER CONSUMPTION BY NUTRIENT IN USD, VIETNAM, 2017 - 2030
- Figure 21:
- STRAIGHT FERTILIZER CONSUMPTION VOLUME BY NUTRIENT IN %, VIETNAM, 2017 VS 2023 VS 2030
- Figure 22:
- STRAIGHT FERTILIZER CONSUMPTION VALUE BY NUTRIENT IN %, VIETNAM, 2017 VS 2023 VS 2030
- Figure 23:
- MICRONUTRIENTS FERTILIZER CONSUMPTION BY PRODUCT IN METRIC TON, VIETNAM, 2017 - 2030
- Figure 24:
- MICRONUTRIENTS FERTILIZER CONSUMPTION BY PRODUCT IN USD, VIETNAM, 2017 - 2030
- Figure 25:
- MICRONUTRIENTS FERTILIZER CONSUMPTION VOLUME BY PRODUCT IN %, VIETNAM, 2017 VS 2023 VS 2030
- Figure 26:
- MICRONUTRIENTS FERTILIZER CONSUMPTION VALUE BY PRODUCT IN %, VIETNAM, 2017 VS 2023 VS 2030
- Figure 27:
- BORON FERTILIZER CONSUMPTION IN METRIC TON, VIETNAM, 2017 - 2030
- Figure 28:
- BORON FERTILIZER CONSUMPTION IN USD, VIETNAM, 2017 - 2030
- Figure 29:
- BORON FERTILIZER CONSUMPTION VALUE BY CROP TYPE IN %, VIETNAM, 2023 VS 2030
- Figure 30:
- COPPER FERTILIZER CONSUMPTION IN METRIC TON, VIETNAM, 2017 - 2030
- Figure 31:
- COPPER FERTILIZER CONSUMPTION IN USD, VIETNAM, 2017 - 2030
- Figure 32:
- COPPER FERTILIZER CONSUMPTION VALUE BY CROP TYPE IN %, VIETNAM, 2023 VS 2030
- Figure 33:
- IRON FERTILIZER CONSUMPTION IN METRIC TON, VIETNAM, 2017 - 2030
- Figure 34:
- IRON FERTILIZER CONSUMPTION IN USD, VIETNAM, 2017 - 2030
- Figure 35:
- IRON FERTILIZER CONSUMPTION VALUE BY CROP TYPE IN %, VIETNAM, 2023 VS 2030
- Figure 36:
- MANGANESE FERTILIZER CONSUMPTION IN METRIC TON, VIETNAM, 2017 - 2030
- Figure 37:
- MANGANESE FERTILIZER CONSUMPTION IN USD, VIETNAM, 2017 - 2030
- Figure 38:
- MANGANESE FERTILIZER CONSUMPTION VALUE BY CROP TYPE IN %, VIETNAM, 2023 VS 2030
- Figure 39:
- MOLYBDENUM FERTILIZER CONSUMPTION IN METRIC TON, VIETNAM, 2017 - 2030
- Figure 40:
- MOLYBDENUM FERTILIZER CONSUMPTION IN USD, VIETNAM, 2017 - 2030
- Figure 41:
- MOLYBDENUM FERTILIZER CONSUMPTION VALUE BY CROP TYPE IN %, VIETNAM, 2023 VS 2030
- Figure 42:
- ZINC FERTILIZER CONSUMPTION IN METRIC TON, VIETNAM, 2017 - 2030
- Figure 43:
- ZINC FERTILIZER CONSUMPTION IN USD, VIETNAM, 2017 - 2030
- Figure 44:
- ZINC FERTILIZER CONSUMPTION VALUE BY CROP TYPE IN %, VIETNAM, 2023 VS 2030
- Figure 45:
- OTHERS FERTILIZER CONSUMPTION IN METRIC TON, VIETNAM, 2017 - 2030
- Figure 46:
- OTHERS FERTILIZER CONSUMPTION IN USD, VIETNAM, 2017 - 2030
- Figure 47:
- OTHERS FERTILIZER CONSUMPTION VALUE BY CROP TYPE IN %, VIETNAM, 2023 VS 2030
- Figure 48:
- NITROGENOUS FERTILIZER CONSUMPTION BY PRODUCT IN METRIC TON, VIETNAM, 2017 - 2030
- Figure 49:
- NITROGENOUS FERTILIZER CONSUMPTION BY PRODUCT IN USD, VIETNAM, 2017 - 2030
- Figure 50:
- NITROGENOUS FERTILIZER CONSUMPTION VOLUME BY PRODUCT IN %, VIETNAM, 2017 VS 2023 VS 2030
- Figure 51:
- NITROGENOUS FERTILIZER CONSUMPTION VALUE BY PRODUCT IN %, VIETNAM, 2017 VS 2023 VS 2030
- Figure 52:
- UREA UREA FERTILIZER CONSUMPTION IN METRIC TON, VIETNAM, 2017 - 2030
- Figure 53:
- UREA UREA FERTILIZER CONSUMPTION IN USD, VIETNAM, 2017 - 2030
- Figure 54:
- UREA FERTILIZER CONSUMPTION VALUE BY CROP TYPE IN USD, VIETNAM, 2017 - 2030
- Figure 55:
- OTHERS FERTILIZER CONSUMPTION IN METRIC TON, VIETNAM, 2017 - 2030
- Figure 56:
- OTHERS FERTILIZER CONSUMPTION IN USD, VIETNAM, 2017 - 2030
- Figure 57:
- OTHERS FERTILIZER CONSUMPTION VALUE BY CROP TYPE IN %, VIETNAM, 2023 VS 2030
- Figure 58:
- PHOSPHATIC FERTILIZER CONSUMPTION BY PRODUCT IN METRIC TON, VIETNAM, 2017 - 2030
- Figure 59:
- PHOSPHATIC FERTILIZER CONSUMPTION BY PRODUCT IN USD, VIETNAM, 2017 - 2030
- Figure 60:
- PHOSPHATIC FERTILIZER CONSUMPTION VOLUME BY PRODUCT IN %, VIETNAM, 2017 VS 2023 VS 2030
- Figure 61:
- PHOSPHATIC FERTILIZER CONSUMPTION VALUE BY PRODUCT IN %, VIETNAM, 2017 VS 2023 VS 2030
- Figure 62:
- DAP FERTILIZER CONSUMPTION IN METRIC TON, VIETNAM, 2017 - 2030
- Figure 63:
- DAP FERTILIZER CONSUMPTION IN USD, VIETNAM, 2017 - 2030
- Figure 64:
- DAP FERTILIZER CONSUMPTION VALUE BY CROP TYPE IN %, VIETNAM, 2023 VS 2030
- Figure 65:
- MAP FERTILIZER CONSUMPTION IN METRIC TON, VIETNAM, 2017 - 2030
- Figure 66:
- MAP FERTILIZER CONSUMPTION IN USD, VIETNAM, 2017 - 2030
- Figure 67:
- MAP FERTILIZER CONSUMPTION VALUE BY CROP TYPE IN %, VIETNAM, 2023 VS 2030
- Figure 68:
- TSP FERTILIZER CONSUMPTION IN METRIC TON, VIETNAM, 2017 - 2030
- Figure 69:
- TSP FERTILIZER CONSUMPTION IN USD, VIETNAM, 2017 - 2030
- Figure 70:
- TSP FERTILIZER CONSUMPTION VALUE BY CROP TYPE IN %, VIETNAM, 2023 VS 2030
- Figure 71:
- OTHERS FERTILIZER CONSUMPTION IN METRIC TON, VIETNAM, 2017 - 2030
- Figure 72:
- OTHERS FERTILIZER CONSUMPTION IN USD, VIETNAM, 2017 - 2030
- Figure 73:
- OTHERS FERTILIZER CONSUMPTION VALUE BY CROP TYPE IN %, VIETNAM, 2023 VS 2030
- Figure 74:
- POTASSIC FERTILIZER CONSUMPTION BY PRODUCT IN METRIC TON, VIETNAM, 2017 - 2030
- Figure 75:
- POTASSIC FERTILIZER CONSUMPTION BY PRODUCT IN USD, VIETNAM, 2017 - 2030
- Figure 76:
- POTASSIC FERTILIZER CONSUMPTION VOLUME BY PRODUCT IN %, VIETNAM, 2017 VS 2023 VS 2030
- Figure 77:
- POTASSIC FERTILIZER CONSUMPTION VALUE BY PRODUCT IN %, VIETNAM, 2017 VS 2023 VS 2030
- Figure 78:
- MOP FERTILIZER CONSUMPTION IN METRIC TON, VIETNAM, 2017 - 2030
- Figure 79:
- MOP FERTILIZER CONSUMPTION IN USD, VIETNAM, 2017 - 2030
- Figure 80:
- MOP FERTILIZER CONSUMPTION VALUE BY CROP TYPE IN %, VIETNAM, 2023 VS 2030
- Figure 81:
- SOP FERTILIZER CONSUMPTION IN METRIC TON, VIETNAM, 2017 - 2030
- Figure 82:
- SOP FERTILIZER CONSUMPTION IN USD, VIETNAM, 2017 - 2030
- Figure 83:
- SOP FERTILIZER CONSUMPTION VALUE BY CROP TYPE IN %, VIETNAM, 2023 VS 2030
- Figure 84:
- OTHERS FERTILIZER CONSUMPTION IN METRIC TON, VIETNAM, 2017 - 2030
- Figure 85:
- OTHERS FERTILIZER CONSUMPTION IN USD, VIETNAM, 2017 - 2030
- Figure 86:
- OTHERS FERTILIZER CONSUMPTION VALUE BY CROP TYPE IN %, VIETNAM, 2023 VS 2030
- Figure 87:
- SECONDARY MACRONUTRIENTS FERTILIZER CONSUMPTION BY PRODUCT IN METRIC TON, VIETNAM, 2017 - 2030
- Figure 88:
- SECONDARY MACRONUTRIENTS FERTILIZER CONSUMPTION BY PRODUCT IN USD, VIETNAM, 2017 - 2030
- Figure 89:
- SECONDARY MACRONUTRIENTS FERTILIZER CONSUMPTION VOLUME BY PRODUCT IN %, VIETNAM, 2017 VS 2023 VS 2030
- Figure 90:
- SECONDARY MACRONUTRIENTS FERTILIZER CONSUMPTION VALUE BY PRODUCT IN %, VIETNAM, 2017 VS 2023 VS 2030
- Figure 91:
- CALCIUM FERTILIZER CONSUMPTION IN METRIC TON, VIETNAM, 2017 - 2030
- Figure 92:
- CALCIUM FERTILIZER CONSUMPTION IN USD, VIETNAM, 2017 - 2030
- Figure 93:
- CALCIUM FERTILIZER CONSUMPTION VALUE BY CROP TYPE IN %, VIETNAM, 2023 VS 2030
- Figure 94:
- MAGNESIUM FERTILIZER CONSUMPTION IN METRIC TON, VIETNAM, 2017 - 2030
- Figure 95:
- MAGNESIUM FERTILIZER CONSUMPTION IN USD, VIETNAM, 2017 - 2030
- Figure 96:
- MAGNESIUM FERTILIZER CONSUMPTION VALUE BY CROP TYPE IN %, VIETNAM, 2023 VS 2030
- Figure 97:
- SULFUR FERTILIZER CONSUMPTION IN METRIC TON, VIETNAM, 2017 - 2030
- Figure 98:
- SULFUR FERTILIZER CONSUMPTION IN USD, VIETNAM, 2017 - 2030
- Figure 99:
- SULFUR FERTILIZER CONSUMPTION VALUE BY CROP TYPE IN %, VIETNAM, 2023 VS 2030
- Figure 100:
- FERTILIZER CONSUMPTION BY FORM IN METRIC TON, VIETNAM, 2017 - 2030
- Figure 101:
- FERTILIZER CONSUMPTION BY FORM IN USD, VIETNAM, 2017 - 2030
- Figure 102:
- FERTILIZER CONSUMPTION VOLUME BY FORM IN %, VIETNAM, 2017 VS 2023 VS 2030
- Figure 103:
- FERTILIZER CONSUMPTION VALUE BY FORM IN %, VIETNAM, 2017 VS 2023 VS 2030
- Figure 104:
- FERTILIZER CONSUMPTION IN METRIC TON, VIETNAM, 2017 - 2030
- Figure 105:
- FERTILIZER CONSUMPTION IN USD, VIETNAM, 2017 - 2030
- Figure 106:
- FERTILIZER CONSUMPTION VALUE BY CROP TYPE IN %, VIETNAM, 2023 VS 2030
- Figure 107:
- FERTILIZER CONSUMPTION BY SPECIALITY TYPE IN METRIC TON, VIETNAM, 2017 - 2030
- Figure 108:
- FERTILIZER CONSUMPTION BY SPECIALITY TYPE IN USD, VIETNAM, 2017 - 2030
- Figure 109:
- FERTILIZER CONSUMPTION VOLUME BY SPECIALITY TYPE IN %, VIETNAM, 2017 VS 2023 VS 2030
- Figure 110:
- FERTILIZER CONSUMPTION VALUE BY SPECIALITY TYPE IN %, VIETNAM, 2017 VS 2023 VS 2030
- Figure 111:
- CRF FERTILIZER CONSUMPTION IN METRIC TON, VIETNAM, 2017 - 2030
- Figure 112:
- CRF FERTILIZER CONSUMPTION IN USD, VIETNAM, 2017 - 2030
- Figure 113:
- CRF FERTILIZER CONSUMPTION VALUE BY CROP TYPE IN %, VIETNAM, 2023 VS 2030
- Figure 114:
- LIQUID FERTILIZER CONSUMPTION IN METRIC TON, VIETNAM, 2017 - 2030
- Figure 115:
- LIQUID FERTILIZER CONSUMPTION IN USD, VIETNAM, 2017 - 2030
- Figure 116:
- LIQUID FERTILIZER CONSUMPTION VALUE BY CROP TYPE IN %, VIETNAM, 2023 VS 2030
- Figure 117:
- SRF FERTILIZER CONSUMPTION IN METRIC TON, VIETNAM, 2017 - 2030
- Figure 118:
- SRF FERTILIZER CONSUMPTION IN USD, VIETNAM, 2017 - 2030
- Figure 119:
- SRF FERTILIZER CONSUMPTION VALUE BY CROP TYPE IN %, VIETNAM, 2023 VS 2030
- Figure 120:
- WATER SOLUBLE FERTILIZER CONSUMPTION IN METRIC TON, VIETNAM, 2017 - 2030
- Figure 121:
- WATER SOLUBLE FERTILIZER CONSUMPTION IN USD, VIETNAM, 2017 - 2030
- Figure 122:
- WATER SOLUBLE FERTILIZER CONSUMPTION VALUE BY CROP TYPE IN %, VIETNAM, 2023 VS 2030
- Figure 123:
- FERTILIZER CONSUMPTION BY APPLICATION MODE IN METRIC TON, VIETNAM, 2017 - 2030
- Figure 124:
- FERTILIZER CONSUMPTION BY APPLICATION MODE IN USD, VIETNAM, 2017 - 2030
- Figure 125:
- FERTILIZER CONSUMPTION VOLUME BY APPLICATION MODE IN %, VIETNAM, 2017 VS 2023 VS 2030
- Figure 126:
- FERTILIZER CONSUMPTION VALUE BY APPLICATION MODE IN %, VIETNAM, 2017 VS 2023 VS 2030
- Figure 127:
- FERTIGATION APPLICATION OF FERTILIZER IN METRIC TON, VIETNAM, 2017 - 2030
- Figure 128:
- FERTIGATION APPLICATION OF FERTILIZER IN USD, VIETNAM, 2017 - 2030
- Figure 129:
- FERTIGATION APPLICATION OF FERTILIZER IN VALUE BY CROP TYPE IN %, VIETNAM, 2023 VS 2030
- Figure 130:
- FOLIAR APPLICATION OF FERTILIZER IN METRIC TON, VIETNAM, 2017 - 2030
- Figure 131:
- FOLIAR APPLICATION OF FERTILIZER IN USD, VIETNAM, 2017 - 2030
- Figure 132:
- FOLIAR APPLICATION OF FERTILIZER IN VALUE BY CROP TYPE IN %, VIETNAM, 2023 VS 2030
- Figure 133:
- SOIL APPLICATION OF FERTILIZER IN METRIC TON, VIETNAM, 2017 - 2030
- Figure 134:
- SOIL APPLICATION OF FERTILIZER IN USD, VIETNAM, 2017 - 2030
- Figure 135:
- SOIL APPLICATION OF FERTILIZER IN VALUE BY CROP TYPE IN %, VIETNAM, 2023 VS 2030
- Figure 136:
- FERTILIZER CONSUMPTION BY CROP TYPE IN METRIC TON, VIETNAM, 2017 - 2030
- Figure 137:
- FERTILIZER CONSUMPTION BY CROP TYPE IN USD, VIETNAM, 2017 - 2030
- Figure 138:
- FERTILIZER CONSUMPTION VOLUME BY CROP TYPE IN %, VIETNAM, 2017 VS 2023 VS 2030
- Figure 139:
- FERTILIZER CONSUMPTION VALUE BY CROP TYPE IN %, VIETNAM, 2017 VS 2023 VS 2030
- Figure 140:
- FERTILIZER CONSUMPTION BY FIELD CROPS IN METRIC TON, VIETNAM, 2017 - 2030
- Figure 141:
- FERTILIZER CONSUMPTION BY FIELD CROPS IN USD, VIETNAM, 2017 - 2030
- Figure 142:
- FERTILIZER CONSUMPTION VALUE BY TYPE IN %, VIETNAM, 2023 VS 2030
- Figure 143:
- FERTILIZER CONSUMPTION BY HORTICULTURAL CROPS IN METRIC TON, VIETNAM, 2017 - 2030
- Figure 144:
- FERTILIZER CONSUMPTION BY HORTICULTURAL CROPS IN USD, VIETNAM, 2017 - 2030
- Figure 145:
- FERTILIZER CONSUMPTION VALUE BY TYPE IN %, VIETNAM, 2023 VS 2030
- Figure 146:
- FERTILIZER CONSUMPTION BY TURF & ORNAMENTAL IN METRIC TON, VIETNAM, 2017 - 2030
- Figure 147:
- FERTILIZER CONSUMPTION BY TURF & ORNAMENTAL IN USD, VIETNAM, 2017 - 2030
- Figure 148:
- FERTILIZER CONSUMPTION VALUE BY TYPE IN %, VIETNAM, 2023 VS 2030
- Figure 149:
- MOST ACTIVE COMPANIES BY NUMBER OF STRATEGIC MOVES, VIETNAM, 2017 - 2030
- Figure 150:
- VIETNAM FERTILIZERS MARKET, MOST ADOPTED STRATEGIES, 2018 - 2021
- Figure 151:
- MARKET SHARE OF MAJOR PLAYERS IN %, VIETNAM
Vietnam Fertilizers Industry Segmentation
Complex, Straight are covered as segments by Type. Conventional, Speciality are covered as segments by Form. Fertigation, Foliar, Soil are covered as segments by Application Mode. Field Crops, Horticultural Crops, Turf & Ornamental are covered as segments by Crop Type.| Type | Complex | |||
| Straight | Micronutrients | Boron | ||
| Copper | ||||
| Iron | ||||
| Manganese | ||||
| Molybdenum | ||||
| Zinc | ||||
| Others | ||||
| Nitrogenous | Urea | |||
| Others | ||||
| Phosphatic | DAP | |||
| MAP | ||||
| TSP | ||||
| Others | ||||
| Potassic | MoP | |||
| SoP | ||||
| Others | ||||
| Secondary Macronutrients | Calcium | |||
| Magnesium | ||||
| Sulfur | ||||
| Form | Conventional | |||
| Speciality | CRF | |||
| Liquid Fertilizer | ||||
| SRF | ||||
| Water Soluble | ||||
| Application Mode | Fertigation | |||
| Foliar | ||||
| Soil | ||||
| Crop Type | Field Crops | |||
| Horticultural Crops | ||||
| Turf & Ornamental | ||||
Need A Different Region or Segment?
Customize Now
Market Definition
- MARKET ESTIMATION LEVEL - Market Estimations for various types of fertilizers has been done at the product-level and not at the nutrient-level.
- NUTRIENT TYPES COVERED - Primary Nutrients: N, P and K, Secondary Macronutrients: Ca, Mg and S, Micronutients: Zn, Mn, Cu, Fe, Mo, B, and Others
- AVERAGE NUTRIENT APPLICATION RATE - This refers to the average volume of nutrient consumed per hectare of farmland in each country.
- CROP TYPES COVERED - Field Crops: Cereals, Pulses, Oilseeds, and Fiber Crops Horticulture: Fruits, Vegetables, Plantation Crops and Spices, Turf Grass and Ornamentals
| Keyword | Definition |
|---|---|
| Fertilizer | Chemical substance applied to crops to ensure nutritional requirements, available in various forms such as granules, powders, liquid, water soluble, etc. |
| Specialty Fertilizer | Used for enhanced efficiency and nutrient availability applied through soil, foliar, and fertigation. Includes CRF, SRF, liquid fertilizer, and water soluble fertilizers. |
| Controlled-Release Fertilizers (CRF) | Coated with materials such as polymer, polymer-sulfur, and other materials such as resins to ensure nutrient availability to the crop for its entire life cycle. |
| Slow-Release Fertilizers (SRF) | Coated with materials such as sulfur, neem, etc., to ensure nutrient availability to the crop for a longer period. |
| Foliar Fertilizers | Consist of both liquid and water soluble fertilizers applied through foliar application. |
| Water-Soluble Fertilizers | Available in various forms including liquid, powder, etc., used in foliar and fertigation mode of fertilizer application. |
| Fertigation | Fertilizers applied through different irrigation systems such as drip irrigation, micro irrigation, sprinkler irrigation, etc. |
| Anhydrous Ammonia | Used as fertilizer, directly injected into the soil, available in gaseous liquid form. |
| Single Super Phosphate (SSP) | Phosphorus fertilizer containing only phosphorus which has lesser than or equal to 35%. |
| Triple Super Phosphate (TSP) | Phosphorus fertilizer containing only phosphorus greater than 35%. |
| Enhanced Efficiency Fertilizers | Fertilizers coated or treated with additional layers of various ingredients to make it more efficient compared to other fertilizers. |
| Conventional Fertilizer | Fertilizers applied to crops through traditional methods including broadcasting, row placement, ploughing soil placement, etc. |
| Chelated Micronutrients | Micronutrient fertilizers coated with chelating agents such as EDTA, EDDHA, DTPA, HEDTA, etc. |
| Liquid Fertilizers | Available in liquid form, majorly used for application of fertilizers to crops through foliar and fertigation. |
Need More Details on Market Definition?
Ask a Question
Research Methodology
Mordor Intelligence follows a four-step methodology in all our reports.
- Step-1: IDENTIFY KEY VARIABLES: In order to build a robust forecasting methodology, the variables and factors identified in Step-1 are tested against available historical market numbers. Through an iterative process, the variables required for market forecast are set and the model is built on the basis of these variables.
- Step-2: Build a Market Model: Market-size estimations for the forecast years are in nominal terms. Inflation is not a part of the pricing, and the average selling price (ASP) is kept constant throughout the forecast period for each country.
- Step-3: Validate and Finalize: In this important step, all market numbers, variables and analyst calls are validated through an extensive network of primary research experts from the market studied. The respondents are selected across levels and functions to generate a holistic picture of the market studied.
- Step-4: Research Outputs: Syndicated Reports, Custom Consulting Assignments, Databases & Subscription Platforms

Get More Details On Research Methodology
Download PDF


