
| Study Period | 2017 - 2030 |
| Base Year For Estimation | 2024 |
| Forecast Data Period | 2025 - 2030 |
| Market Size (2025) | USD 424.6 Million |
| Market Size (2030) | USD 543.4 Million |
| CAGR (2025 - 2030) | 5.06 % |
| Market Concentration | Medium |
Major Players*Disclaimer: Major Players sorted in no particular order |


Vietnam Feed Additives Market Analysis
The Vietnam Feed Additives Market size is estimated at 424.6 million USD in 2025, and is expected to reach 543.4 million USD by 2030, growing at a CAGR of 5.06% during the forecast period (2025-2030).
The Vietnamese feed additives industry has evolved significantly, driven by an increasing focus on animal nutrition and feed efficiency. The industry structure is characterized by a strong presence of both international and domestic players, with major companies investing in local manufacturing capabilities to meet growing demand. A notable development in this direction was Alltech's establishment of a new organic trace minerals manufacturing facility in 2022, with an annual production capacity of 7,000 metric tons, demonstrating the industry's commitment to expanding local production capabilities. The market has also witnessed increased adoption of advanced feed ingredients technologies and formulations, particularly in the commercial farming sector.
The industry has experienced a notable shift toward scientific feed formulation and quality enhancement, particularly in the feed amino acids segment. In 2022, the combination of key feed additives amino acids, binders, minerals, and probiotics accounted for 54.7% of the total market share, highlighting their crucial role in animal nutrition and growth performance. This trend is further evidenced by the significant utilization of specific amino acids, with lysine and methionine emerging as the dominant components, collectively representing over half of the amino acids segment. The industry has also seen increased emphasis on feed safety and quality standards, with manufacturers implementing stringent quality control measures.
The market is witnessing a transformation in feeding practices, particularly in the commercial livestock sector. Synthetic binders have gained substantial traction, commanding 64.4% of the binders segment in 2022, primarily due to their role in improving feed quality and digestibility. The industry has also seen increased adoption of advanced feed formulation technologies, with a growing focus on precision nutrition and customized feed solutions. This trend is particularly evident in the swine and poultry sectors, where feed efficiency and performance optimization are crucial.
The Vietnamese feed additives market is experiencing significant technological advancement and innovation in product development. Companies are increasingly investing in research and development to create more effective and sustainable nutritional feed additives solutions. The market has seen a notable shift toward natural and sustainable functional feed additives, with increasing emphasis on reducing environmental impact while maintaining performance benefits. This trend is particularly evident in the growing adoption of probiotics and organic feed minerals, as manufacturers respond to the increasing demand for more natural feed solutions. The industry has also witnessed increased collaboration between feed manufacturers and research institutions to develop innovative feed solutions.
Vietnam Feed Additives Market Trends
Poultry birds were 92.5% of country's animal population and has been increasing due to high demand for consumption and investment by companies to expand their farms
- Vietnam's poultry industry has grown in recent years, with poultry birds accounting for 92.5% of the total animal headcount in 2022. This trend can be attributed to the country's increasing demand for meat and eggs. Between 2017 and 2022, poultry production saw an impressive 67.5% growth due to the rising meat consumption and demand for animal protein.
- The spread of African swine fever in 2019 significantly impacted Vietnam's poultry industry. With consumers switching from pork to other meats such as chicken, poultry production increased by 26% from 2018, reaching 496 million heads in 2020. However, smallholder poultry production during the COVID-19 outbreak was negatively affected due to a shortage of feed caused by the closure of feed mills, leading to a 30% increase in feed prices. Nevertheless, poultry production bounced back in 2022, with a 1.9% increase from the previous year following the ease of COVID-19 restrictions and the reopening of restaurants, leading to a rise in poultry demand.
- Most of the poultry production in the country is attributed to smallholder farms, with flock sizes averaging 2,000-5,000 birds. However, major farms are investing in expanding their farms with a keeping size of 8,000-15,000 birds due to the increased profit margins and the growing demand for poultry meat and eggs. For instance, CP Vietnam invested USD 250 million in a poultry project to produce high-quality chicken products for local consumption and export to Japan, Europe, and the Middle East. Given the rising investments and consumer demand, Vietnam's poultry farming industry is expected to continue thriving during the forecast period.

Understand The Key Trends Shaping This Market
Download PDF
Increasing awareness of nutritionally balanced feed and Vietnamese government plans for developing fishers industry is increasing the demand for aqua feed production
- In 2022, aquaculture compound feed production accounted for 28.5% of the total compound feed production in the country. The growing demand for aquaculture feed is being driven by the increasing awareness of nutritionally balanced feed to enhance the productivity and performance of aquaculture animals. This trend significantly increased aquaculture feed production by 55.2% in 2022 compared to 2017. The Vietnamese government is committed to developing the fisheries industry and meeting the growing consumer demand. The Ministry of Agriculture and Rural Development launched a national action plan in 2017 to develop Vietnam's shrimp industry until 2025 and expand the brackish water shrimp industry until 2030, leading to an increase in the production of compound feed for shrimp by 106.6% from 2017 to 365.4 thousand metric tons in 2022.
- The use of acidifiers is projected to increase in compound feed due to their ability to improve feed conversion, reduce pathogen pressure, and preserve feed. They are also considered a promising alternative to in-feed antibiotics in aquaculture. Therefore, the acidifiers segment of the feed additives market is projected to record a CAGR of 5.8% during the forecast period.
- Therefore, the growing awareness of the benefits of compound feed and the rising demand for aquaculture products are expected to boost the market's growth during the forecast period. The government initiatives to develop the fisheries industry and meet consumer demand may also drive the demand for compound feed, providing significant opportunities for businesses operating in this market.

OTHER KEY INDUSTRY TRENDS COVERED IN THE REPORT
- High number of dairy farms with high profit margins and increasing demand for milk production has been increasing the ruminants production in the country
- Increase in the egg production and higher investments in broiler farming is encouraging the feed producing companies to increase the feed production for poultry
- High demand for swine feed is in Vietnam's northern and southern regions but there is an increase in the demand for healthy pig which is expected to increase the demand for swine feed in the future
- Government initiatives such as paying compensation for culling pigs and piglets is leading to increasing swine production
- Dairy cattle feed is increasing in the country as there is increasing trend of organic milk which is leading to increase in the investments in the dairy sector
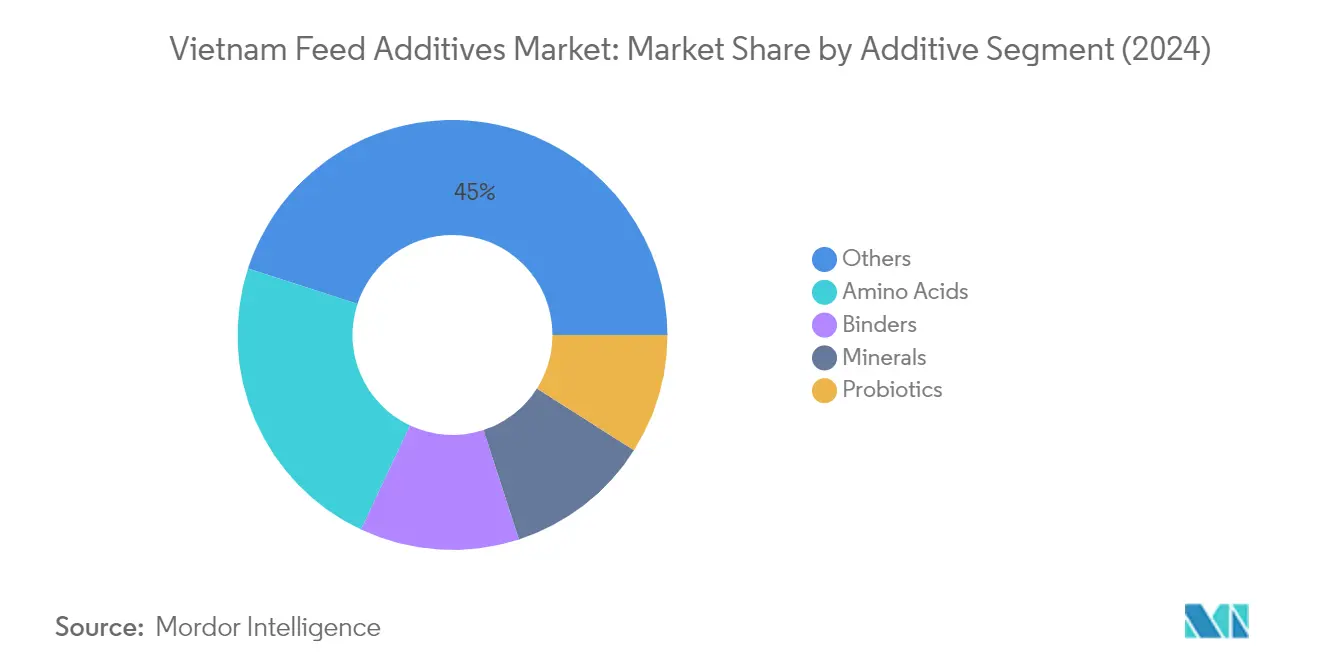
Segment Analysis: By Additive
Amino Acids Segment in Vietnam Feed Additives Market
Amino acids represent the dominant segment in Vietnam's feed additives market, accounting for approximately 24% of the total market share in 2024. This significant market position is primarily driven by their crucial role in promoting the growth and development of muscles and meat in animals. Feed amino acids such as lysine and methionine are the most widely used in Vietnam, together accounting for over 53% of the total amino acids consumption, particularly in aquaculture and poultry applications. The segment's prominence is further reinforced by the increasing awareness among farmers about the benefits of feed amino acids supplementation in improving feed efficiency and animal performance. The demand is particularly strong in the swine sector, which represents the largest consumer of amino acids in Vietnam, driven by the country's substantial pork production industry.
Acidifiers Segment in Vietnam Feed Additives Market
The acidifiers segment is emerging as the most dynamic category in Vietnam's feed additives market, projected to grow at approximately 6% CAGR from 2024 to 2029. This remarkable growth trajectory is primarily attributed to the increasing recognition of feed acidifiers' role in enhancing feed palatability and improving nutrient absorption in animals. Propionic acid and fumaric acid are leading the growth within this segment, as they effectively prevent digestive disorders and enhance feed conversion rates. The segment's expansion is further supported by the rising adoption of feed acidifiers as alternatives to antibiotics, particularly in the aquaculture and swine sectors. The growth is also driven by acidifiers' proven ability to improve intestinal immunity by enhancing gastrointestinal tract health and digestion in animals.
Remaining Segments in Feed Additives Market by Additive
The Vietnam feed additives market encompasses several other significant segments, including binders, minerals, probiotics, vitamins, enzymes, antioxidants, phytogenics, mycotoxin detoxifiers, and yeast derivatives. Binders play a crucial role in improving feed quality and reducing nutrient loss during processing, while feed minerals are essential for various physiological functions in animals. Feed probiotics and prebiotics are gaining importance due to their role in improving gut health and immunity. Feed vitamins are fundamental for maintaining animal health and productivity, while feed enzymes enhance nutrient utilization efficiency. Feed antioxidants help in preserving feed quality, and feed phytogenics are emerging as natural growth promoters. Mycotoxin detoxifiers are becoming increasingly important for feed safety, while yeast derivatives contribute to improved animal performance and health.
Segment Analysis: By Animal
Swine Segment in Vietnam Feed Additives Market
The swine segment dominates the Vietnam feed additives market, commanding approximately 42% market share in 2024. This significant market position is driven by Vietnam's substantial swine feed production, which reached 6.6 million metric tons in recent years. The segment's prominence is further reinforced by the country's high pork consumption patterns, where pork represents about 65-70% of total protein consumption. The strong market position is supported by increasing investments in swine farming infrastructure and the growing adoption of feed additives to improve meat quality and animal health. Amino acids constitute the most important feed additives used in swine rearing, with a notable focus on improving muscle growth, feed efficiency, and overall animal performance. The segment's growth is also supported by Vietnam's expanding export market for pork products and the increasing emphasis on high-quality meat production.
Poultry Segment in Vietnam Feed Additives Market
The poultry segment is emerging as the fastest-growing segment in the Vietnam feed additives market, projected to expand at a CAGR of approximately 6% during 2024-2029. This remarkable growth is driven by several factors, including the increasing demand for eggs and poultry meat for consumption and muscle development. The segment's growth is further supported by significant investments in the poultry sector, with major companies expanding their production facilities and implementing advanced feeding technologies. The rising adoption of feed additives in poultry diets is particularly notable in improving feed efficiency, enhancing immune function, and promoting better growth rates. The segment is witnessing increased usage of various feed additives, with acidifiers showing particularly strong growth potential due to their ability to improve nutrient absorption and reduce pathogenic microbes.
Remaining Segments in Vietnam Feed Additives Market
The remaining segments in the Vietnam feed additives market include aquaculture, ruminants, and other animals, each playing distinct roles in shaping the market landscape. The aquaculture segment has emerged as a significant contributor, particularly in fish and shrimp farming, with an increasing focus on feed quality and sustainability. The ruminants segment, though smaller, maintains steady growth through dairy cattle farming and increasing awareness about feed nutrition. The other animals segment, while representing a smaller portion of the market, serves specialized farming needs across various species. These segments collectively contribute to the market's diversity and demonstrate the expanding scope of feed additive applications across different livestock categories in Vietnam's agricultural sector.
Vietnam Feed Additives Industry Overview
Top Companies in Vietnam Feed Additives Market
The Vietnam feed additives market is characterized by companies focusing on strategic initiatives to strengthen their market positions. Product innovation emerges as a key trend, with companies developing new feed enzymes products, phytogenic solutions, and specialized nutritional formulations to meet evolving customer needs. Operational agility is demonstrated through the establishment of local manufacturing facilities and distribution networks, enabling companies to better serve the Vietnamese market. Strategic partnerships and collaborations, particularly with regional players and research institutions, have become increasingly common to enhance product offerings and expand market reach. Companies are also pursuing geographical expansion through new manufacturing facilities and the acquisition of local players, while simultaneously investing in research and development capabilities to drive technological advancement in feed additives solutions.
Global Leaders Dominate Vietnamese Feed Market
The Vietnamese animal feed additives market exhibits a moderately consolidated structure, with global multinational corporations holding significant market share. These international players leverage their extensive research capabilities, technological expertise, and established brand reputation to maintain their market positions. The market is primarily dominated by diversified chemical and agricultural conglomerates that offer comprehensive product portfolios across multiple animal feed additives categories, while specialized feed additive manufacturers maintain their presence in specific market segments through focused product offerings and technical expertise.
The market has witnessed several strategic acquisitions and partnerships, indicating a trend toward consolidation. Global players are actively pursuing acquisitions of local companies to strengthen their regional presence and expand their product portfolios. These acquisitions are particularly focused on companies with strong distribution networks or specialized product offerings in high-growth segments such as amino acids, enzymes, and probiotics. The presence of both global and local players creates a competitive environment where companies must continuously innovate and adapt to maintain their market positions.
Innovation and Local Presence Drive Success
Success in the Vietnamese feed additives market increasingly depends on companies' ability to develop innovative products that address specific local needs while maintaining cost competitiveness. Incumbents can strengthen their market position by investing in local manufacturing facilities, developing strong distribution networks, and building close relationships with key customers in the livestock and aquaculture sectors. Companies must also focus on providing technical support services and customized solutions to differentiate themselves in an increasingly competitive market. The ability to offer integrated solutions that combine multiple feed ingredients categories while ensuring product quality and consistency will be crucial for maintaining market leadership.
For contenders looking to gain market share, establishing strong local partnerships and developing specialized product offerings for specific animal segments present significant opportunities. Success will depend on understanding local market dynamics, regulatory requirements, and customer preferences while maintaining competitive pricing strategies. Companies must also consider potential regulatory changes, particularly regarding antibiotic alternatives and sustainable production practices, which could create new market opportunities. The increasing focus on animal health and nutrition, combined with the growing demand for meat and aquaculture products, creates a favorable environment for companies that can effectively address these market needs while managing production costs and maintaining product quality.
Vietnam Feed Additives Market Leaders
-
Alltech, Inc.
-
Archer Daniel Midland Co.
-
DSM Nutritional Products AG
-
Kemin Industries
-
SHV (Nutreco NV)
- *Disclaimer: Major Players sorted in no particular order

Need More Details on Market Players and Competiters?
Download PDF
Vietnam Feed Additives Market News
- January 2023: Novus International acquired the Biotech company Agrivida to develop new feed additives.
- November 2022: Kemin Industries introduced Toxfin Care, a solution that protects feed from mycotoxins. It strengthens the immune system, protects organs, and prevents loss of performance and productivity.
- November 2022: Alltech Inc. has established new manufacturing for organic trace minerals in Vietnam with a manufacturing facility with an annual capacity of about 7,000 metric tons.
Free With This Report
We provide a complimentary and exhaustive set of data points on regional and country-level metrics that present the fundamental structure of the industry. Presented in the form of 35+ free charts, the section covers difficult-to-find data of various regions on feed production through various animal categories such as Ruminants, Poultry, Swine, and Aquaculture.


Vietnam Feed Additives Market Report - Table of Contents
1. EXECUTIVE SUMMARY & KEY FINDINGS
2. REPORT OFFERS
3. INTRODUCTION
- 3.1 Study Assumptions & Market Definition
- 3.2 Scope of the Study
- 3.3 Research Methodology
4. KEY INDUSTRY TRENDS
-
4.1 Animal Headcount
- 4.1.1 Poultry
- 4.1.2 Ruminants
- 4.1.3 Swine
-
4.2 Feed Production
- 4.2.1 Aquaculture
- 4.2.2 Poultry
- 4.2.3 Ruminants
- 4.2.4 Swine
-
4.3 Regulatory Framework
- 4.3.1 Vietnam
- 4.4 Value Chain & Distribution Channel Analysis
5. MARKET SEGMENTATION (includes market size in Value in USD and Volume, Forecasts up to 2030 and analysis of growth prospects)
-
5.1 Additive
- 5.1.1 Acidifiers
- 5.1.1.1 By Sub Additive
- 5.1.1.1.1 Fumaric Acid
- 5.1.1.1.2 Lactic Acid
- 5.1.1.1.3 Propionic Acid
- 5.1.1.1.4 Other Acidifiers
- 5.1.2 Amino Acids
- 5.1.2.1 By Sub Additive
- 5.1.2.1.1 Lysine
- 5.1.2.1.2 Methionine
- 5.1.2.1.3 Threonine
- 5.1.2.1.4 Tryptophan
- 5.1.2.1.5 Other Amino Acids
- 5.1.3 Antibiotics
- 5.1.3.1 By Sub Additive
- 5.1.3.1.1 Bacitracin
- 5.1.3.1.2 Penicillins
- 5.1.3.1.3 Tetracyclines
- 5.1.3.1.4 Tylosin
- 5.1.3.1.5 Other Antibiotics
- 5.1.4 Antioxidants
- 5.1.4.1 By Sub Additive
- 5.1.4.1.1 Butylated Hydroxyanisole (BHA)
- 5.1.4.1.2 Butylated Hydroxytoluene (BHT)
- 5.1.4.1.3 Citric Acid
- 5.1.4.1.4 Ethoxyquin
- 5.1.4.1.5 Propyl Gallate
- 5.1.4.1.6 Tocopherols
- 5.1.4.1.7 Other Antioxidants
- 5.1.5 Binders
- 5.1.5.1 By Sub Additive
- 5.1.5.1.1 Natural Binders
- 5.1.5.1.2 Synthetic Binders
- 5.1.6 Enzymes
- 5.1.6.1 By Sub Additive
- 5.1.6.1.1 Carbohydrases
- 5.1.6.1.2 Phytases
- 5.1.6.1.3 Other Enzymes
- 5.1.7 Flavors & Sweeteners
- 5.1.7.1 By Sub Additive
- 5.1.7.1.1 Flavors
- 5.1.7.1.2 Sweeteners
- 5.1.8 Minerals
- 5.1.8.1 By Sub Additive
- 5.1.8.1.1 Macrominerals
- 5.1.8.1.2 Microminerals
- 5.1.9 Mycotoxin Detoxifiers
- 5.1.9.1 By Sub Additive
- 5.1.9.1.1 Binders
- 5.1.9.1.2 Biotransformers
- 5.1.9.1.3 Other Mycotoxin Detoxifiers
- 5.1.10 Phytogenics
- 5.1.10.1 By Sub Additive
- 5.1.10.1.1 Essential Oil
- 5.1.10.1.2 Herbs & Spices
- 5.1.10.1.3 Other Phytogenics
- 5.1.11 Pigments
- 5.1.11.1 By Sub Additive
- 5.1.11.1.1 Carotenoids
- 5.1.11.1.2 Curcumin & Spirulina
- 5.1.12 Prebiotics
- 5.1.12.1 By Sub Additive
- 5.1.12.1.1 Fructo Oligosaccharides
- 5.1.12.1.2 Galacto Oligosaccharides
- 5.1.12.1.3 Inulin
- 5.1.12.1.4 Lactulose
- 5.1.12.1.5 Mannan Oligosaccharides
- 5.1.12.1.6 Xylo Oligosaccharides
- 5.1.12.1.7 Other Prebiotics
- 5.1.13 Probiotics
- 5.1.13.1 By Sub Additive
- 5.1.13.1.1 Bifidobacteria
- 5.1.13.1.2 Enterococcus
- 5.1.13.1.3 Lactobacilli
- 5.1.13.1.4 Pediococcus
- 5.1.13.1.5 Streptococcus
- 5.1.13.1.6 Other Probiotics
- 5.1.14 Vitamins
- 5.1.14.1 By Sub Additive
- 5.1.14.1.1 Vitamin A
- 5.1.14.1.2 Vitamin B
- 5.1.14.1.3 Vitamin C
- 5.1.14.1.4 Vitamin E
- 5.1.14.1.5 Other Vitamins
- 5.1.15 Yeast
- 5.1.15.1 By Sub Additive
- 5.1.15.1.1 Live Yeast
- 5.1.15.1.2 Selenium Yeast
- 5.1.15.1.3 Spent Yeast
- 5.1.15.1.4 Torula Dried Yeast
- 5.1.15.1.5 Whey Yeast
- 5.1.15.1.6 Yeast Derivatives
-
5.2 Animal
- 5.2.1 Aquaculture
- 5.2.1.1 By Sub Animal
- 5.2.1.1.1 Fish
- 5.2.1.1.2 Shrimp
- 5.2.1.1.3 Other Aquaculture Species
- 5.2.2 Poultry
- 5.2.2.1 By Sub Animal
- 5.2.2.1.1 Broiler
- 5.2.2.1.2 Layer
- 5.2.2.1.3 Other Poultry Birds
- 5.2.3 Ruminants
- 5.2.3.1 By Sub Animal
- 5.2.3.1.1 Beef Cattle
- 5.2.3.1.2 Dairy Cattle
- 5.2.3.1.3 Other Ruminants
- 5.2.4 Swine
- 5.2.5 Other Animals
6. COMPETITIVE LANDSCAPE
- 6.1 Key Strategic Moves
- 6.2 Market Share Analysis
- 6.3 Company Landscape
-
6.4 Company Profiles (includes Global Level Overview, Market Level Overview, Core Business Segments, Financials, Headcount, Key Information, Market Rank, Market Share, Products and Services, and Analysis of Recent Developments).
- 6.4.1 Alltech, Inc.
- 6.4.2 Archer Daniel Midland Co.
- 6.4.3 BASF SE
- 6.4.4 Brenntag SE
- 6.4.5 Cargill Inc.
- 6.4.6 DSM Nutritional Products AG
- 6.4.7 Kemin Industries
- 6.4.8 Novus International, Inc.
- 6.4.9 SHV (Nutreco NV)
- 6.4.10 Solvay S.A.
7. KEY STRATEGIC QUESTIONS FOR FEED ADDITIVE CEOS
8. APPENDIX
-
8.1 Global Overview
- 8.1.1 Overview
- 8.1.2 Porter’s Five Forces Framework
- 8.1.3 Global Value Chain Analysis
- 8.1.4 Global Market Size and DROs
- 8.2 Sources & References
- 8.3 List of Tables & Figures
- 8.4 Primary Insights
- 8.5 Data Pack
- 8.6 Glossary of Terms
You Can Purchase Parts Of This Report. Check Out Prices For Specific Sections
Get Price Break-up Now
List of Tables & Figures
- Figure 1:
- POPULATION OF POULTRY, NUMBER, VIETNAM, 2017-2022
- Figure 2:
- POPULATION OF RUMINANTS, NUMBER, VIETNAM, 2017-2022
- Figure 3:
- POPULATION OF SWINE, NUMBER, VIETNAM, 2017-2022
- Figure 4:
- PRODUCTION VOLUME OF AQUACULTURE FEED, METRIC TON, VIETNAM, 2017-2022
- Figure 5:
- PRODUCTION VOLUME OF POULTRY FEED, METRIC TON, VIETNAM, 2017-2022
- Figure 6:
- PRODUCTION VOLUME OF RUMINANTS FEED, METRIC TON, VIETNAM, 2017-2022
- Figure 7:
- PRODUCTION VOLUME OF SWINE FEED, METRIC TON, VIETNAM, 2017-2022
- Figure 8:
- VOLUME OF FEED ADDITIVE, METRIC TON, VIETNAM, 2017 - 2029
- Figure 9:
- VALUE OF FEED ADDITIVE, USD, VIETNAM, 2017 - 2029
- Figure 10:
- VOLUME OF FEED ADDITIVE BY ADDITIVE CATEGORIES, METRIC TON, VIETNAM, 2017 - 2029
- Figure 11:
- VALUE OF FEED ADDITIVE BY ADDITIVE CATEGORIES, USD, VIETNAM, 2017 - 2029
- Figure 12:
- VOLUME SHARE OF FEED ADDITIVE BY ADDITIVE CATEGORIES, %, VIETNAM, 2017,2023 AND 2029
- Figure 13:
- VALUE SHARE OF FEED ADDITIVE BY ADDITIVE CATEGORIES, %, VIETNAM, 2017,2023 AND 2029
- Figure 14:
- VOLUME OF FEED ACIDIFIERS BY SUB ADDITIVE CATEGORIES, METRIC TON, VIETNAM, 2017 - 2029
- Figure 15:
- VALUE OF FEED ACIDIFIERS BY SUB ADDITIVE CATEGORIES, USD, VIETNAM, 2017 - 2029
- Figure 16:
- VOLUME SHARE OF FEED ACIDIFIERS BY SUB ADDITIVE CATEGORIES, %, VIETNAM, 2017,2023 AND 2029
- Figure 17:
- VALUE SHARE OF FEED ACIDIFIERS BY SUB ADDITIVE CATEGORIES, %, VIETNAM, 2017,2023 AND 2029
- Figure 18:
- VOLUME OF FUMARIC ACID FEED ACIDIFIERS, METRIC TON, VIETNAM, 2017 - 2029
- Figure 19:
- VALUE OF FUMARIC ACID FEED ACIDIFIERS, USD, VIETNAM, 2017 - 2029
- Figure 20:
- VOLUME OF LACTIC ACID FEED ACIDIFIERS, METRIC TON, VIETNAM, 2017 - 2029
- Figure 21:
- VALUE OF LACTIC ACID FEED ACIDIFIERS, USD, VIETNAM, 2017 - 2029
- Figure 22:
- VOLUME OF PROPIONIC ACID FEED ACIDIFIERS, METRIC TON, VIETNAM, 2017 - 2029
- Figure 23:
- VALUE OF PROPIONIC ACID FEED ACIDIFIERS, USD, VIETNAM, 2017 - 2029
- Figure 24:
- VOLUME OF OTHER ACIDIFIERS FEED ACIDIFIERS, METRIC TON, VIETNAM, 2017 - 2029
- Figure 25:
- VALUE OF OTHER ACIDIFIERS FEED ACIDIFIERS, USD, VIETNAM, 2017 - 2029
- Figure 26:
- VOLUME OF FEED AMINO ACIDS BY SUB ADDITIVE CATEGORIES, METRIC TON, VIETNAM, 2017 - 2029
- Figure 27:
- VALUE OF FEED AMINO ACIDS BY SUB ADDITIVE CATEGORIES, USD, VIETNAM, 2017 - 2029
- Figure 28:
- VOLUME SHARE OF FEED AMINO ACIDS BY SUB ADDITIVE CATEGORIES, %, VIETNAM, 2017,2023 AND 2029
- Figure 29:
- VALUE SHARE OF FEED AMINO ACIDS BY SUB ADDITIVE CATEGORIES, %, VIETNAM, 2017,2023 AND 2029
- Figure 30:
- VOLUME OF LYSINE FEED AMINO ACIDS, METRIC TON, VIETNAM, 2017 - 2029
- Figure 31:
- VALUE OF LYSINE FEED AMINO ACIDS, USD, VIETNAM, 2017 - 2029
- Figure 32:
- VOLUME OF METHIONINE FEED AMINO ACIDS, METRIC TON, VIETNAM, 2017 - 2029
- Figure 33:
- VALUE OF METHIONINE FEED AMINO ACIDS, USD, VIETNAM, 2017 - 2029
- Figure 34:
- VOLUME OF THREONINE FEED AMINO ACIDS, METRIC TON, VIETNAM, 2017 - 2029
- Figure 35:
- VALUE OF THREONINE FEED AMINO ACIDS, USD, VIETNAM, 2017 - 2029
- Figure 36:
- VOLUME OF TRYPTOPHAN FEED AMINO ACIDS, METRIC TON, VIETNAM, 2017 - 2029
- Figure 37:
- VALUE OF TRYPTOPHAN FEED AMINO ACIDS, USD, VIETNAM, 2017 - 2029
- Figure 38:
- VOLUME OF OTHER AMINO ACIDS FEED AMINO ACIDS, METRIC TON, VIETNAM, 2017 - 2029
- Figure 39:
- VALUE OF OTHER AMINO ACIDS FEED AMINO ACIDS, USD, VIETNAM, 2017 - 2029
- Figure 40:
- VOLUME OF FEED ANTIBIOTICS BY SUB ADDITIVE CATEGORIES, METRIC TON, VIETNAM, 2017 - 2029
- Figure 41:
- VALUE OF FEED ANTIBIOTICS BY SUB ADDITIVE CATEGORIES, USD, VIETNAM, 2017 - 2029
- Figure 42:
- VOLUME SHARE OF FEED ANTIBIOTICS BY SUB ADDITIVE CATEGORIES, %, VIETNAM, 2017,2023 AND 2029
- Figure 43:
- VALUE SHARE OF FEED ANTIBIOTICS BY SUB ADDITIVE CATEGORIES, %, VIETNAM, 2017,2023 AND 2029
- Figure 44:
- VOLUME OF BACITRACIN FEED ANTIBIOTICS, METRIC TON, VIETNAM, 2017 - 2029
- Figure 45:
- VALUE OF BACITRACIN FEED ANTIBIOTICS, USD, VIETNAM, 2017 - 2029
- Figure 46:
- VOLUME OF PENICILLINS FEED ANTIBIOTICS, METRIC TON, VIETNAM, 2017 - 2029
- Figure 47:
- VALUE OF PENICILLINS FEED ANTIBIOTICS, USD, VIETNAM, 2017 - 2029
- Figure 48:
- VOLUME OF TETRACYCLINES FEED ANTIBIOTICS, METRIC TON, VIETNAM, 2017 - 2029
- Figure 49:
- VALUE OF TETRACYCLINES FEED ANTIBIOTICS, USD, VIETNAM, 2017 - 2029
- Figure 50:
- VOLUME OF TYLOSIN FEED ANTIBIOTICS, METRIC TON, VIETNAM, 2017 - 2029
- Figure 51:
- VALUE OF TYLOSIN FEED ANTIBIOTICS, USD, VIETNAM, 2017 - 2029
- Figure 52:
- VOLUME OF OTHER ANTIBIOTICS FEED ANTIBIOTICS, METRIC TON, VIETNAM, 2017 - 2029
- Figure 53:
- VALUE OF OTHER ANTIBIOTICS FEED ANTIBIOTICS, USD, VIETNAM, 2017 - 2029
- Figure 54:
- VOLUME OF FEED ANTIOXIDANTS BY SUB ADDITIVE CATEGORIES, METRIC TON, VIETNAM, 2017 - 2029
- Figure 55:
- VALUE OF FEED ANTIOXIDANTS BY SUB ADDITIVE CATEGORIES, USD, VIETNAM, 2017 - 2029
- Figure 56:
- VOLUME SHARE OF FEED ANTIOXIDANTS BY SUB ADDITIVE CATEGORIES, %, VIETNAM, 2017,2023 AND 2029
- Figure 57:
- VALUE SHARE OF FEED ANTIOXIDANTS BY SUB ADDITIVE CATEGORIES, %, VIETNAM, 2017,2023 AND 2029
- Figure 58:
- VOLUME OF BUTYLATED HYDROXYANISOLE (BHA) FEED ANTIOXIDANTS, METRIC TON, VIETNAM, 2017 - 2029
- Figure 59:
- VALUE OF BUTYLATED HYDROXYANISOLE (BHA) FEED ANTIOXIDANTS, USD, VIETNAM, 2017 - 2029
- Figure 60:
- VOLUME OF BUTYLATED HYDROXYTOLUENE (BHT) FEED ANTIOXIDANTS, METRIC TON, VIETNAM, 2017 - 2029
- Figure 61:
- VALUE OF BUTYLATED HYDROXYTOLUENE (BHT) FEED ANTIOXIDANTS, USD, VIETNAM, 2017 - 2029
- Figure 62:
- VOLUME OF CITRIC ACID FEED ANTIOXIDANTS, METRIC TON, VIETNAM, 2017 - 2029
- Figure 63:
- VALUE OF CITRIC ACID FEED ANTIOXIDANTS, USD, VIETNAM, 2017 - 2029
- Figure 64:
- VOLUME OF ETHOXYQUIN FEED ANTIOXIDANTS, METRIC TON, VIETNAM, 2017 - 2029
- Figure 65:
- VALUE OF ETHOXYQUIN FEED ANTIOXIDANTS, USD, VIETNAM, 2017 - 2029
- Figure 66:
- VOLUME OF PROPYL GALLATE FEED ANTIOXIDANTS, METRIC TON, VIETNAM, 2017 - 2029
- Figure 67:
- VALUE OF PROPYL GALLATE FEED ANTIOXIDANTS, USD, VIETNAM, 2017 - 2029
- Figure 68:
- VOLUME OF TOCOPHEROLS FEED ANTIOXIDANTS, METRIC TON, VIETNAM, 2017 - 2029
- Figure 69:
- VALUE OF TOCOPHEROLS FEED ANTIOXIDANTS, USD, VIETNAM, 2017 - 2029
- Figure 70:
- VOLUME OF OTHER ANTIOXIDANTS FEED ANTIOXIDANTS, METRIC TON, VIETNAM, 2017 - 2029
- Figure 71:
- VALUE OF OTHER ANTIOXIDANTS FEED ANTIOXIDANTS, USD, VIETNAM, 2017 - 2029
- Figure 72:
- VOLUME OF FEED BINDERS BY SUB ADDITIVE CATEGORIES, METRIC TON, VIETNAM, 2017 - 2029
- Figure 73:
- VALUE OF FEED BINDERS BY SUB ADDITIVE CATEGORIES, USD, VIETNAM, 2017 - 2029
- Figure 74:
- VOLUME SHARE OF FEED BINDERS BY SUB ADDITIVE CATEGORIES, %, VIETNAM, 2017,2023 AND 2029
- Figure 75:
- VALUE SHARE OF FEED BINDERS BY SUB ADDITIVE CATEGORIES, %, VIETNAM, 2017,2023 AND 2029
- Figure 76:
- VOLUME OF NATURAL BINDERS FEED BINDERS, METRIC TON, VIETNAM, 2017 - 2029
- Figure 77:
- VALUE OF NATURAL BINDERS FEED BINDERS, USD, VIETNAM, 2017 - 2029
- Figure 78:
- VOLUME OF SYNTHETIC BINDERS FEED BINDERS, METRIC TON, VIETNAM, 2017 - 2029
- Figure 79:
- VALUE OF SYNTHETIC BINDERS FEED BINDERS, USD, VIETNAM, 2017 - 2029
- Figure 80:
- VOLUME OF FEED ENZYMES BY SUB ADDITIVE CATEGORIES, METRIC TON, VIETNAM, 2017 - 2029
- Figure 81:
- VALUE OF FEED ENZYMES BY SUB ADDITIVE CATEGORIES, USD, VIETNAM, 2017 - 2029
- Figure 82:
- VOLUME SHARE OF FEED ENZYMES BY SUB ADDITIVE CATEGORIES, %, VIETNAM, 2017,2023 AND 2029
- Figure 83:
- VALUE SHARE OF FEED ENZYMES BY SUB ADDITIVE CATEGORIES, %, VIETNAM, 2017,2023 AND 2029
- Figure 84:
- VOLUME OF CARBOHYDRASES FEED ENZYMES, METRIC TON, VIETNAM, 2017 - 2029
- Figure 85:
- VALUE OF CARBOHYDRASES FEED ENZYMES, USD, VIETNAM, 2017 - 2029
- Figure 86:
- VOLUME OF PHYTASES FEED ENZYMES, METRIC TON, VIETNAM, 2017 - 2029
- Figure 87:
- VALUE OF PHYTASES FEED ENZYMES, USD, VIETNAM, 2017 - 2029
- Figure 88:
- VOLUME OF OTHER ENZYMES FEED ENZYMES, METRIC TON, VIETNAM, 2017 - 2029
- Figure 89:
- VALUE OF OTHER ENZYMES FEED ENZYMES, USD, VIETNAM, 2017 - 2029
- Figure 90:
- VOLUME OF FEED FLAVORS & SWEETENERS BY SUB ADDITIVE CATEGORIES, METRIC TON, VIETNAM, 2017 - 2029
- Figure 91:
- VALUE OF FEED FLAVORS & SWEETENERS BY SUB ADDITIVE CATEGORIES, USD, VIETNAM, 2017 - 2029
- Figure 92:
- VOLUME SHARE OF FEED FLAVORS & SWEETENERS BY SUB ADDITIVE CATEGORIES, %, VIETNAM, 2017,2023 AND 2029
- Figure 93:
- VALUE SHARE OF FEED FLAVORS & SWEETENERS BY SUB ADDITIVE CATEGORIES, %, VIETNAM, 2017,2023 AND 2029
- Figure 94:
- VOLUME OF FLAVORS FEED FLAVORS & SWEETENERS, METRIC TON, VIETNAM, 2017 - 2029
- Figure 95:
- VALUE OF FLAVORS FEED FLAVORS & SWEETENERS, USD, VIETNAM, 2017 - 2029
- Figure 96:
- VOLUME OF SWEETENERS FEED FLAVORS & SWEETENERS, METRIC TON, VIETNAM, 2017 - 2029
- Figure 97:
- VALUE OF SWEETENERS FEED FLAVORS & SWEETENERS, USD, VIETNAM, 2017 - 2029
- Figure 98:
- VOLUME OF FEED MINERALS BY SUB ADDITIVE CATEGORIES, METRIC TON, VIETNAM, 2017 - 2029
- Figure 99:
- VALUE OF FEED MINERALS BY SUB ADDITIVE CATEGORIES, USD, VIETNAM, 2017 - 2029
- Figure 100:
- VOLUME SHARE OF FEED MINERALS BY SUB ADDITIVE CATEGORIES, %, VIETNAM, 2017,2023 AND 2029
- Figure 101:
- VALUE SHARE OF FEED MINERALS BY SUB ADDITIVE CATEGORIES, %, VIETNAM, 2017,2023 AND 2029
- Figure 102:
- VOLUME OF MACROMINERALS FEED MINERALS, METRIC TON, VIETNAM, 2017 - 2029
- Figure 103:
- VALUE OF MACROMINERALS FEED MINERALS, USD, VIETNAM, 2017 - 2029
- Figure 104:
- VOLUME OF MICROMINERALS FEED MINERALS, METRIC TON, VIETNAM, 2017 - 2029
- Figure 105:
- VALUE OF MICROMINERALS FEED MINERALS, USD, VIETNAM, 2017 - 2029
- Figure 106:
- VOLUME OF FEED MYCOTOXIN DETOXIFIERS BY SUB ADDITIVE CATEGORIES, METRIC TON, VIETNAM, 2017 - 2029
- Figure 107:
- VALUE OF FEED MYCOTOXIN DETOXIFIERS BY SUB ADDITIVE CATEGORIES, USD, VIETNAM, 2017 - 2029
- Figure 108:
- VOLUME SHARE OF FEED MYCOTOXIN DETOXIFIERS BY SUB ADDITIVE CATEGORIES, %, VIETNAM, 2017,2023 AND 2029
- Figure 109:
- VALUE SHARE OF FEED MYCOTOXIN DETOXIFIERS BY SUB ADDITIVE CATEGORIES, %, VIETNAM, 2017,2023 AND 2029
- Figure 110:
- VOLUME OF BINDERS FEED MYCOTOXIN DETOXIFIERS, METRIC TON, VIETNAM, 2017 - 2029
- Figure 111:
- VALUE OF BINDERS FEED MYCOTOXIN DETOXIFIERS, USD, VIETNAM, 2017 - 2029
- Figure 112:
- VOLUME OF BIOTRANSFORMERS FEED MYCOTOXIN DETOXIFIERS, METRIC TON, VIETNAM, 2017 - 2029
- Figure 113:
- VALUE OF BIOTRANSFORMERS FEED MYCOTOXIN DETOXIFIERS, USD, VIETNAM, 2017 - 2029
- Figure 114:
- VOLUME OF FEED PHYTOGENICS BY SUB ADDITIVE CATEGORIES, METRIC TON, VIETNAM, 2017 - 2029
- Figure 115:
- VALUE OF FEED PHYTOGENICS BY SUB ADDITIVE CATEGORIES, USD, VIETNAM, 2017 - 2029
- Figure 116:
- VOLUME SHARE OF FEED PHYTOGENICS BY SUB ADDITIVE CATEGORIES, %, VIETNAM, 2017,2023 AND 2029
- Figure 117:
- VALUE SHARE OF FEED PHYTOGENICS BY SUB ADDITIVE CATEGORIES, %, VIETNAM, 2017,2023 AND 2029
- Figure 118:
- VOLUME OF ESSENTIAL OIL FEED PHYTOGENICS, METRIC TON, VIETNAM, 2017 - 2029
- Figure 119:
- VALUE OF ESSENTIAL OIL FEED PHYTOGENICS, USD, VIETNAM, 2017 - 2029
- Figure 120:
- VOLUME OF HERBS & SPICES FEED PHYTOGENICS, METRIC TON, VIETNAM, 2017 - 2029
- Figure 121:
- VALUE OF HERBS & SPICES FEED PHYTOGENICS, USD, VIETNAM, 2017 - 2029
- Figure 122:
- VOLUME OF HERBS & SPIECES FEED PHYTOGENICS, METRIC TON, VIETNAM, 2017 - 2029
- Figure 123:
- VALUE OF HERBS & SPIECES FEED PHYTOGENICS, USD, VIETNAM, 2017 - 2029
- Figure 124:
- VOLUME OF OTHER PHYTOGENICS FEED PHYTOGENICS, METRIC TON, VIETNAM, 2017 - 2029
- Figure 125:
- VALUE OF OTHER PHYTOGENICS FEED PHYTOGENICS, USD, VIETNAM, 2017 - 2029
- Figure 126:
- VOLUME OF FEED PIGMENTS BY SUB ADDITIVE CATEGORIES, METRIC TON, VIETNAM, 2017 - 2029
- Figure 127:
- VALUE OF FEED PIGMENTS BY SUB ADDITIVE CATEGORIES, USD, VIETNAM, 2017 - 2029
- Figure 128:
- VOLUME SHARE OF FEED PIGMENTS BY SUB ADDITIVE CATEGORIES, %, VIETNAM, 2017,2023 AND 2029
- Figure 129:
- VALUE SHARE OF FEED PIGMENTS BY SUB ADDITIVE CATEGORIES, %, VIETNAM, 2017,2023 AND 2029
- Figure 130:
- VOLUME OF CAROTENOIDS FEED PIGMENTS, METRIC TON, VIETNAM, 2017 - 2029
- Figure 131:
- VALUE OF CAROTENOIDS FEED PIGMENTS, USD, VIETNAM, 2017 - 2029
- Figure 132:
- VOLUME OF CURCUMIN & SPIRULINA FEED PIGMENTS, METRIC TON, VIETNAM, 2017 - 2029
- Figure 133:
- VALUE OF CURCUMIN & SPIRULINA FEED PIGMENTS, USD, VIETNAM, 2017 - 2029
- Figure 134:
- VOLUME OF FEED PREBIOTICS BY SUB ADDITIVE CATEGORIES, METRIC TON, VIETNAM, 2017 - 2029
- Figure 135:
- VALUE OF FEED PREBIOTICS BY SUB ADDITIVE CATEGORIES, USD, VIETNAM, 2017 - 2029
- Figure 136:
- VOLUME SHARE OF FEED PREBIOTICS BY SUB ADDITIVE CATEGORIES, %, VIETNAM, 2017,2023 AND 2029
- Figure 137:
- VALUE SHARE OF FEED PREBIOTICS BY SUB ADDITIVE CATEGORIES, %, VIETNAM, 2017,2023 AND 2029
- Figure 138:
- VOLUME OF FRUCTO OLIGOSACCHARIDES FEED PREBIOTICS, METRIC TON, VIETNAM, 2017 - 2029
- Figure 139:
- VALUE OF FRUCTO OLIGOSACCHARIDES FEED PREBIOTICS, USD, VIETNAM, 2017 - 2029
- Figure 140:
- VOLUME OF GALACTO OLIGOSACCHARIDES FEED PREBIOTICS, METRIC TON, VIETNAM, 2017 - 2029
- Figure 141:
- VALUE OF GALACTO OLIGOSACCHARIDES FEED PREBIOTICS, USD, VIETNAM, 2017 - 2029
- Figure 142:
- VOLUME OF INULIN FEED PREBIOTICS, METRIC TON, VIETNAM, 2017 - 2029
- Figure 143:
- VALUE OF INULIN FEED PREBIOTICS, USD, VIETNAM, 2017 - 2029
- Figure 144:
- VOLUME OF LACTULOSE FEED PREBIOTICS, METRIC TON, VIETNAM, 2017 - 2029
- Figure 145:
- VALUE OF LACTULOSE FEED PREBIOTICS, USD, VIETNAM, 2017 - 2029
- Figure 146:
- VOLUME OF MANNAN OLIGOSACCHARIDES FEED PREBIOTICS, METRIC TON, VIETNAM, 2017 - 2029
- Figure 147:
- VALUE OF MANNAN OLIGOSACCHARIDES FEED PREBIOTICS, USD, VIETNAM, 2017 - 2029
- Figure 148:
- VOLUME OF XYLO OLIGOSACCHARIDES FEED PREBIOTICS, METRIC TON, VIETNAM, 2017 - 2029
- Figure 149:
- VALUE OF XYLO OLIGOSACCHARIDES FEED PREBIOTICS, USD, VIETNAM, 2017 - 2029
- Figure 150:
- VOLUME OF OTHER PREBIOTICS FEED PREBIOTICS, METRIC TON, VIETNAM, 2017 - 2029
- Figure 151:
- VALUE OF OTHER PREBIOTICS FEED PREBIOTICS, USD, VIETNAM, 2017 - 2029
- Figure 152:
- VOLUME OF FEED PROBIOTICS BY SUB ADDITIVE CATEGORIES, METRIC TON, VIETNAM, 2017 - 2029
- Figure 153:
- VALUE OF FEED PROBIOTICS BY SUB ADDITIVE CATEGORIES, USD, VIETNAM, 2017 - 2029
- Figure 154:
- VOLUME SHARE OF FEED PROBIOTICS BY SUB ADDITIVE CATEGORIES, %, VIETNAM, 2017,2023 AND 2029
- Figure 155:
- VALUE SHARE OF FEED PROBIOTICS BY SUB ADDITIVE CATEGORIES, %, VIETNAM, 2017,2023 AND 2029
- Figure 156:
- VOLUME OF BIFIDOBACTERIA FEED PROBIOTICS, METRIC TON, VIETNAM, 2017 - 2029
- Figure 157:
- VALUE OF BIFIDOBACTERIA FEED PROBIOTICS, USD, VIETNAM, 2017 - 2029
- Figure 158:
- VOLUME OF ENTEROCOCCUS FEED PROBIOTICS, METRIC TON, VIETNAM, 2017 - 2029
- Figure 159:
- VALUE OF ENTEROCOCCUS FEED PROBIOTICS, USD, VIETNAM, 2017 - 2029
- Figure 160:
- VOLUME OF LACTOBACILLI FEED PROBIOTICS, METRIC TON, VIETNAM, 2017 - 2029
- Figure 161:
- VALUE OF LACTOBACILLI FEED PROBIOTICS, USD, VIETNAM, 2017 - 2029
- Figure 162:
- VOLUME OF PEDIOCOCCUS FEED PROBIOTICS, METRIC TON, VIETNAM, 2017 - 2029
- Figure 163:
- VALUE OF PEDIOCOCCUS FEED PROBIOTICS, USD, VIETNAM, 2017 - 2029
- Figure 164:
- VOLUME OF STREPTOCOCCUS FEED PROBIOTICS, METRIC TON, VIETNAM, 2017 - 2029
- Figure 165:
- VALUE OF STREPTOCOCCUS FEED PROBIOTICS, USD, VIETNAM, 2017 - 2029
- Figure 166:
- VOLUME OF OTHER PROBIOTICS FEED PROBIOTICS, METRIC TON, VIETNAM, 2017 - 2029
- Figure 167:
- VALUE OF OTHER PROBIOTICS FEED PROBIOTICS, USD, VIETNAM, 2017 - 2029
- Figure 168:
- VOLUME OF FEED VITAMINS BY SUB ADDITIVE CATEGORIES, METRIC TON, VIETNAM, 2017 - 2029
- Figure 169:
- VALUE OF FEED VITAMINS BY SUB ADDITIVE CATEGORIES, USD, VIETNAM, 2017 - 2029
- Figure 170:
- VOLUME SHARE OF FEED VITAMINS BY SUB ADDITIVE CATEGORIES, %, VIETNAM, 2017,2023 AND 2029
- Figure 171:
- VALUE SHARE OF FEED VITAMINS BY SUB ADDITIVE CATEGORIES, %, VIETNAM, 2017,2023 AND 2029
- Figure 172:
- VOLUME OF VITAMIN A FEED VITAMINS, METRIC TON, VIETNAM, 2017 - 2029
- Figure 173:
- VALUE OF VITAMIN A FEED VITAMINS, USD, VIETNAM, 2017 - 2029
- Figure 174:
- VOLUME OF VITAMIN B FEED VITAMINS, METRIC TON, VIETNAM, 2017 - 2029
- Figure 175:
- VALUE OF VITAMIN B FEED VITAMINS, USD, VIETNAM, 2017 - 2029
- Figure 176:
- VOLUME OF VITAMIN C FEED VITAMINS, METRIC TON, VIETNAM, 2017 - 2029
- Figure 177:
- VALUE OF VITAMIN C FEED VITAMINS, USD, VIETNAM, 2017 - 2029
- Figure 178:
- VOLUME OF VITAMIN E FEED VITAMINS, METRIC TON, VIETNAM, 2017 - 2029
- Figure 179:
- VALUE OF VITAMIN E FEED VITAMINS, USD, VIETNAM, 2017 - 2029
- Figure 180:
- VOLUME OF OTHER VITAMINS FEED VITAMINS, METRIC TON, VIETNAM, 2017 - 2029
- Figure 181:
- VALUE OF OTHER VITAMINS FEED VITAMINS, USD, VIETNAM, 2017 - 2029
- Figure 182:
- VOLUME OF FEED YEAST BY SUB ADDITIVE CATEGORIES, METRIC TON, VIETNAM, 2017 - 2029
- Figure 183:
- VALUE OF FEED YEAST BY SUB ADDITIVE CATEGORIES, USD, VIETNAM, 2017 - 2029
- Figure 184:
- VOLUME SHARE OF FEED YEAST BY SUB ADDITIVE CATEGORIES, %, VIETNAM, 2017,2023 AND 2029
- Figure 185:
- VALUE SHARE OF FEED YEAST BY SUB ADDITIVE CATEGORIES, %, VIETNAM, 2017,2023 AND 2029
- Figure 186:
- VOLUME OF LIVE YEAST FEED YEAST, METRIC TON, VIETNAM, 2017 - 2029
- Figure 187:
- VALUE OF LIVE YEAST FEED YEAST, USD, VIETNAM, 2017 - 2029
- Figure 188:
- VOLUME OF SELENIUM YEAST FEED YEAST, METRIC TON, VIETNAM, 2017 - 2029
- Figure 189:
- VALUE OF SELENIUM YEAST FEED YEAST, USD, VIETNAM, 2017 - 2029
- Figure 190:
- VOLUME OF SPENT YEAST FEED YEAST, METRIC TON, VIETNAM, 2017 - 2029
- Figure 191:
- VALUE OF SPENT YEAST FEED YEAST, USD, VIETNAM, 2017 - 2029
- Figure 192:
- VOLUME OF TORULA DRIED YEAST FEED YEAST, METRIC TON, VIETNAM, 2017 - 2029
- Figure 193:
- VALUE OF TORULA DRIED YEAST FEED YEAST, USD, VIETNAM, 2017 - 2029
- Figure 194:
- VOLUME OF WHEY YEAST FEED YEAST, METRIC TON, VIETNAM, 2017 - 2029
- Figure 195:
- VALUE OF WHEY YEAST FEED YEAST, USD, VIETNAM, 2017 - 2029
- Figure 196:
- VOLUME OF YEAST DERIVATIVES FEED YEAST, METRIC TON, VIETNAM, 2017 - 2029
- Figure 197:
- VALUE OF YEAST DERIVATIVES FEED YEAST, USD, VIETNAM, 2017 - 2029
- Figure 198:
- VOLUME OF YEAST DERVATIVES FEED YEAST, METRIC TON, VIETNAM, 2017 - 2029
- Figure 199:
- VALUE OF YEAST DERVATIVES FEED YEAST, USD, VIETNAM, 2017 - 2029
- Figure 200:
- VOLUME OF FEED ADDITIVE BY ANIMAL TYPE, METRIC TON, VIETNAM, 2017 - 2029
- Figure 201:
- VALUE OF FEED ADDITIVE BY ANIMAL TYPE, USD, VIETNAM, 2017 - 2029
- Figure 202:
- VOLUME SHARE OF FEED ADDITIVE BY ANIMAL TYPE, %, VIETNAM, 2017,2023 AND 2029
- Figure 203:
- VALUE SHARE OF FEED ADDITIVE BY ANIMAL TYPE, %, VIETNAM, 2017,2023 AND 2029
- Figure 204:
- VOLUME OF AQUACULTURE FEED ADDITIVE BY SUB ANIMAL TYPE, METRIC TON, VIETNAM, 2017 - 2029
- Figure 205:
- VALUE OF AQUACULTURE FEED ADDITIVE BY SUB ANIMAL TYPE, USD, VIETNAM, 2017 - 2029
- Figure 206:
- VOLUME SHARE OF AQUACULTURE FEED ADDITIVE BY SUB ANIMAL TYPE, %, VIETNAM, 2017,2023 AND 2029
- Figure 207:
- VALUE SHARE OF AQUACULTURE FEED ADDITIVE BY SUB ANIMAL TYPE, %, VIETNAM, 2017,2023 AND 2029
- Figure 208:
- VOLUME OF FISH FEED ADDITIVE, METRIC TON, VIETNAM, 2017 - 2029
- Figure 209:
- VALUE OF FISH FEED ADDITIVE, USD, VIETNAM, 2017 - 2029
- Figure 210:
- VALUE SHARE OF FISH FEED ADDITIVE BY ADDITIVE CATEGORIES, %, VIETNAM, 2022 AND 2029
- Figure 211:
- VOLUME OF SHRIMP FEED ADDITIVE, METRIC TON, VIETNAM, 2017 - 2029
- Figure 212:
- VALUE OF SHRIMP FEED ADDITIVE, USD, VIETNAM, 2017 - 2029
- Figure 213:
- VALUE SHARE OF SHRIMP FEED ADDITIVE BY ADDITIVE CATEGORIES, %, VIETNAM, 2022 AND 2029
- Figure 214:
- VOLUME OF OTHER AQUACULTURE SPECIES FEED ADDITIVE, METRIC TON, VIETNAM, 2017 - 2029
- Figure 215:
- VALUE OF OTHER AQUACULTURE SPECIES FEED ADDITIVE, USD, VIETNAM, 2017 - 2029
- Figure 216:
- VALUE SHARE OF OTHER AQUACULTURE SPECIES FEED ADDITIVE BY ADDITIVE CATEGORIES, %, VIETNAM, 2022 AND 2029
- Figure 217:
- VOLUME OF POULTRY FEED ADDITIVE BY SUB ANIMAL TYPE, METRIC TON, VIETNAM, 2017 - 2029
- Figure 218:
- VALUE OF POULTRY FEED ADDITIVE BY SUB ANIMAL TYPE, USD, VIETNAM, 2017 - 2029
- Figure 219:
- VOLUME SHARE OF POULTRY FEED ADDITIVE BY SUB ANIMAL TYPE, %, VIETNAM, 2017,2023 AND 2029
- Figure 220:
- VALUE SHARE OF POULTRY FEED ADDITIVE BY SUB ANIMAL TYPE, %, VIETNAM, 2017,2023 AND 2029
- Figure 221:
- VOLUME OF BROILER FEED ADDITIVE, METRIC TON, VIETNAM, 2017 - 2029
- Figure 222:
- VALUE OF BROILER FEED ADDITIVE, USD, VIETNAM, 2017 - 2029
- Figure 223:
- VALUE SHARE OF BROILER FEED ADDITIVE BY ADDITIVE CATEGORIES, %, VIETNAM, 2022 AND 2029
- Figure 224:
- VOLUME OF LAYER FEED ADDITIVE, METRIC TON, VIETNAM, 2017 - 2029
- Figure 225:
- VALUE OF LAYER FEED ADDITIVE, USD, VIETNAM, 2017 - 2029
- Figure 226:
- VALUE SHARE OF LAYER FEED ADDITIVE BY ADDITIVE CATEGORIES, %, VIETNAM, 2022 AND 2029
- Figure 227:
- VOLUME OF OTHER POULTRY BIRDS FEED ADDITIVE, METRIC TON, VIETNAM, 2017 - 2029
- Figure 228:
- VALUE OF OTHER POULTRY BIRDS FEED ADDITIVE, USD, VIETNAM, 2017 - 2029
- Figure 229:
- VALUE SHARE OF OTHER POULTRY BIRDS FEED ADDITIVE BY ADDITIVE CATEGORIES, %, VIETNAM, 2022 AND 2029
- Figure 230:
- VOLUME OF RUMINANTS FEED ADDITIVE BY SUB ANIMAL TYPE, METRIC TON, VIETNAM, 2017 - 2029
- Figure 231:
- VALUE OF RUMINANTS FEED ADDITIVE BY SUB ANIMAL TYPE, USD, VIETNAM, 2017 - 2029
- Figure 232:
- VOLUME SHARE OF RUMINANTS FEED ADDITIVE BY SUB ANIMAL TYPE, %, VIETNAM, 2017,2023 AND 2029
- Figure 233:
- VALUE SHARE OF RUMINANTS FEED ADDITIVE BY SUB ANIMAL TYPE, %, VIETNAM, 2017,2023 AND 2029
- Figure 234:
- VOLUME OF BEEF CATTLE FEED ADDITIVE, METRIC TON, VIETNAM, 2017 - 2029
- Figure 235:
- VALUE OF BEEF CATTLE FEED ADDITIVE, USD, VIETNAM, 2017 - 2029
- Figure 236:
- VALUE SHARE OF BEEF CATTLE FEED ADDITIVE BY ADDITIVE CATEGORIES, %, VIETNAM, 2022 AND 2029
- Figure 237:
- VOLUME OF DAIRY CATTLE FEED ADDITIVE, METRIC TON, VIETNAM, 2017 - 2029
- Figure 238:
- VALUE OF DAIRY CATTLE FEED ADDITIVE, USD, VIETNAM, 2017 - 2029
- Figure 239:
- VALUE SHARE OF DAIRY CATTLE FEED ADDITIVE BY ADDITIVE CATEGORIES, %, VIETNAM, 2022 AND 2029
- Figure 240:
- VOLUME OF OTHER RUMINANTS FEED ADDITIVE, METRIC TON, VIETNAM, 2017 - 2029
- Figure 241:
- VALUE OF OTHER RUMINANTS FEED ADDITIVE, USD, VIETNAM, 2017 - 2029
- Figure 242:
- VALUE SHARE OF OTHER RUMINANTS FEED ADDITIVE BY ADDITIVE CATEGORIES, %, VIETNAM, 2022 AND 2029
- Figure 243:
- VOLUME OF SWINE FEED ADDITIVE, METRIC TON, VIETNAM, 2017 - 2029
- Figure 244:
- VALUE OF SWINE FEED ADDITIVE, USD, VIETNAM, 2017 - 2029
- Figure 245:
- VALUE SHARE OF SWINE FEED ADDITIVE BY ADDITIVE CATEGORIES, %, VIETNAM, 2022 AND 2029
- Figure 246:
- VOLUME OF OTHER ANIMALS FEED ADDITIVE, METRIC TON, VIETNAM, 2017 - 2029
- Figure 247:
- VALUE OF OTHER ANIMALS FEED ADDITIVE, USD, VIETNAM, 2017 - 2029
- Figure 248:
- VALUE SHARE OF OTHER ANIMALS FEED ADDITIVE BY ADDITIVE CATEGORIES, %, VIETNAM, 2022 AND 2029
- Figure 249:
- MOST ACTIVE COMPANIES BY NUMBER OF STRATEGIC MOVES, COUNT, VIETNAM, 2017 - 2023
- Figure 250:
- MOST ADOPTED STRATEGIES, COUNT, VIETNAM, 2017 - 2023
- Figure 251:
- VALUE SHARE OF MAJOR PLAYERS, %, VIETNAM
Vietnam Feed Additives Industry Segmentation
Acidifiers, Amino Acids, Antibiotics, Antioxidants, Binders, Enzymes, Flavors & Sweeteners, Minerals, Mycotoxin Detoxifiers, Phytogenics, Pigments, Prebiotics, Probiotics, Vitamins, Yeast are covered as segments by Additive. Aquaculture, Poultry, Ruminants, Swine are covered as segments by Animal.| Additive | Acidifiers | By Sub Additive | Fumaric Acid | |
| Lactic Acid | ||||
| Propionic Acid | ||||
| Other Acidifiers | ||||
| Amino Acids | By Sub Additive | Lysine | ||
| Methionine | ||||
| Threonine | ||||
| Tryptophan | ||||
| Other Amino Acids | ||||
| Antibiotics | By Sub Additive | Bacitracin | ||
| Penicillins | ||||
| Tetracyclines | ||||
| Tylosin | ||||
| Other Antibiotics | ||||
| Antioxidants | By Sub Additive | Butylated Hydroxyanisole (BHA) | ||
| Butylated Hydroxytoluene (BHT) | ||||
| Citric Acid | ||||
| Ethoxyquin | ||||
| Propyl Gallate | ||||
| Tocopherols | ||||
| Other Antioxidants | ||||
| Binders | By Sub Additive | Natural Binders | ||
| Synthetic Binders | ||||
| Enzymes | By Sub Additive | Carbohydrases | ||
| Phytases | ||||
| Other Enzymes | ||||
| Flavors & Sweeteners | By Sub Additive | Flavors | ||
| Sweeteners | ||||
| Minerals | By Sub Additive | Macrominerals | ||
| Microminerals | ||||
| Mycotoxin Detoxifiers | By Sub Additive | Binders | ||
| Biotransformers | ||||
| Other Mycotoxin Detoxifiers | ||||
| Phytogenics | By Sub Additive | Essential Oil | ||
| Herbs & Spices | ||||
| Other Phytogenics | ||||
| Pigments | By Sub Additive | Carotenoids | ||
| Curcumin & Spirulina | ||||
| Prebiotics | By Sub Additive | Fructo Oligosaccharides | ||
| Galacto Oligosaccharides | ||||
| Inulin | ||||
| Lactulose | ||||
| Mannan Oligosaccharides | ||||
| Xylo Oligosaccharides | ||||
| Other Prebiotics | ||||
| Probiotics | By Sub Additive | Bifidobacteria | ||
| Enterococcus | ||||
| Lactobacilli | ||||
| Pediococcus | ||||
| Streptococcus | ||||
| Other Probiotics | ||||
| Vitamins | By Sub Additive | Vitamin A | ||
| Vitamin B | ||||
| Vitamin C | ||||
| Vitamin E | ||||
| Other Vitamins | ||||
| Yeast | By Sub Additive | Live Yeast | ||
| Selenium Yeast | ||||
| Spent Yeast | ||||
| Torula Dried Yeast | ||||
| Whey Yeast | ||||
| Yeast Derivatives | ||||
| Animal | Aquaculture | By Sub Animal | Fish | |
| Shrimp | ||||
| Other Aquaculture Species | ||||
| Poultry | By Sub Animal | Broiler | ||
| Layer | ||||
| Other Poultry Birds | ||||
| Ruminants | By Sub Animal | Beef Cattle | ||
| Dairy Cattle | ||||
| Other Ruminants | ||||
| Swine | ||||
| Other Animals | ||||
Need A Different Region or Segment?
Customize Now
Market Definition
- FUNCTIONS - For the study, feed additives are considered to be commercially manufactured products that are used to enhance characteristics such as weight gain, feed conversion ratio, and feed intake when fed in appropriate proportions.
- RESELLERS - Companies engaged in reselling feed additives without value addition have been excluded from the market scope, to avoid double counting.
- END CONSUMERS - Compound feed manufacturers are considered to be end-consumers in the market studied. The scope excludes farmers buying feed additives to be used directly as supplements or premixes.
- INTERNAL COMPANY CONSUMPTION - Companies engaged in the production of compound feed as well as the manufacturing of feed additives are part of the study. However, while estimating the market sizes, the internal consumption of feed additives by such companies has been excluded.
| Keyword | Definition |
|---|---|
| Feed additives | Feed additives are products used in animal nutrition for purposes of improving the quality of feed and the quality of food from animal origin, or to improve the animals’ performance and health. |
| Probiotics | Probiotics are microorganisms introduced into the body for their beneficial qualities. (It maintains or restores beneficial bacteria to the gut). |
| Antibiotics | Antibiotic is a drug that is specifically used to inhibit the growth of bacteria. |
| Prebiotics | A non-digestible food ingredient that promotes the growth of beneficial microorganisms in the intestines. |
| Antioxidants | Antioxidants are compounds that inhibit oxidation, a chemical reaction that produces free radicals. |
| Phytogenics | Phytogenics are a group of natural and non-antibiotic growth promoters derived from herbs, spices, essential oils, and oleoresins. |
| Vitamins | Vitamins are organic compounds, which are required for normal growth and maintenance of the body. |
| Metabolism | A chemical process that occurs within a living organism in order to maintain life. |
| Amino acids | Amino acids are the building blocks of proteins and play an important role in metabolic pathways. |
| Enzymes | Enzyme is a substance that acts as a catalyst to bring about a specific biochemical reaction. |
| Anti-microbial resistance | The ability of a microorganism to resist the effects of an antimicrobial agent. |
| Anti-microbial | Destroying or inhibiting the growth of microorganisms. |
| Osmotic balance | It is a process of maintaining salt and water balance across membranes within the body's fluids. |
| Bacteriocin | Bacteriocins are the toxins produced by bacteria to inhibit the growth of similar or closely related bacterial strains. |
| Biohydrogenation | It is a process that occurs in the rumen of an animal in which bacteria convert unsaturated fatty acids (USFA) to saturated fatty acids (SFA). |
| Oxidative rancidity | It is a reaction of fatty acids with oxygen, which generally causes unpleasant odors in animals. To prevent these, antioxidants were added. |
| Mycotoxicosis | Any condition or disease caused by fungal toxins, mainly due to contamination of animal feed with mycotoxins. |
| Mycotoxins | Mycotoxins are toxin compounds that are naturally produced by certain types of molds (fungi). |
| Feed Probiotics | Microbial feed supplements positively affect gastrointestinal microbial balance. |
| Probiotic yeast | Feed yeast (single-cell fungi) and other fungi used as probiotics. |
| Feed enzymes | They are used to supplement digestive enzymes in an animal’s stomach to break down food. Enzymes also ensure that meat and egg production is improved. |
| Mycotoxin detoxifiers | They are used to prevent fungal growth and to stop any harmful mold from being absorbed in the gut and blood. |
| Feed antibiotics | They are used both for the prevention and treatment of diseases but also for rapid growth and development. |
| Feed antioxidants | They are used to protect the deterioration of other feed nutrients in the feed such as fats, vitamins, pigments, and flavoring agents, thus providing nutrient security to the animals. |
| Feed phytogenics | Phytogenics are natural substances, added to livestock feed to promote growth, aid in digestion, and act as anti-microbial agents. |
| Feed vitamins | They are used to maintain the normal physiological function and normal growth and development of animals. |
| Feed flavors and sweetners | These flavors and sweeteners help to mask tastes and odors during changes in additives or medications and make them ideal for animal diets undergoing transition. |
| Feed acidifiers | Animal feed acidifiers are organic acids incorporated into the feed for nutritional or preservative purposes. Acidifiers enhance congestion and microbiological balance in the alimentary and digestive tracts of livestock. |
| Feed minerals | Feed minerals play an important role in the regular dietary requirements of animal feed. |
| Feed binders | Feed binders are the binding agents used in the manufacture of safe animal feed products. It enhances the taste of food and prolongs the storage period of the feed. |
| Key Terms | Abbreviation |
| LSDV | Lumpy Skin Disease Virus |
| ASF | African Swine Fever |
| GPA | Growth Promoter Antibiotics |
| NSP | Non-Starch Polysaccharides |
| PUFA | Polyunsaturated Fatty Acid |
| Afs | Aflatoxins |
| AGP | Antibiotic Growth Promoters |
| FAO | The Food And Agriculture Organization of the United Nations |
| USDA | The United States Department of Agriculture |
Need More Details on Market Definition?
Ask a Question
Research Methodology
Mordor Intelligence follows a four-step methodology in all our reports.
- Step-1: IDENTIFY KEY VARIABLES: In order to build a robust forecasting methodology, the variables and factors identified in Step-1 are tested against available historical market numbers. Through an iterative process, the variables required for market forecast are set and the model is built on the basis of these variables.
- Step-2: Build a Market Model: Market-size estimations for the forecast years are in nominal terms. Inflation is not a part of the pricing, and the average selling price (ASP) is kept constant throughout the forecast period.
- Step-3: Validate and Finalize: In this important step, all market numbers, variables and analyst calls are validated through an extensive network of primary research experts from the market studied. The respondents are selected across levels and functions to generate a holistic picture of the market studied.
- Step-4: Research Outputs: Syndicated Reports, Custom Consulting Assignments, Databases & Subscription Platforms

Get More Details On Research Methodology
Download PDF


