| Study Period | 2018 - 2030 |
| Base Year For Estimation | 2024 |
| Forecast Data Period | 2025 - 2030 |
| Market Volume (2025) | 524.7 MW |
| Market Volume (2030) | 950.4 MW |
| CAGR | 12.61 % |
| Market Concentration | Low |
Major Players*Disclaimer: Major Players sorted in no particular order |

Vietnam Data Center Market Analysis
The Vietnam Data Center Market size is estimated at 524.7 MW in 2025, and is expected to reach 950.4 MW by 2030, growing at a CAGR of 12.61%. Further, the market is expected to generate colocation revenue of USD 588.9 Million in 2025 and is projected to reach USD 1,403.4 Million by 2030, growing at a CAGR of 18.97% during the forecast period (2025-2030).
Vietnam's data center market is experiencing rapid transformation driven by increasing digital adoption and infrastructure development. The country witnessed significant growth in internet penetration, with 77.93 million internet users recorded in January 2023, representing a 7.3% increase from the previous year. This digital surge has led to an enhanced focus on data center facilities, particularly Tier 3 installations that offer improved reliability and uptime. The government's National Digital Transformation Programme, targeting 80% of public services to be available online by 2025, has further accelerated the need for robust data center infrastructure. Major operators are responding by expanding their facilities and upgrading existing infrastructure to meet the growing demand for reliable data storage and processing capabilities.
The market is witnessing substantial investments in connectivity infrastructure to improve data center operations and reliability. In May 2023, FPT Telecom invested $87 million in constructing the Asia Link Cable, a new submarine fiber optic cable spanning approximately 6,000 kilometers and connecting multiple Asian locations, including Hong Kong, the Philippines, Brunei, and Singapore. Additionally, VNPT opened Vietnam's largest industrial and technical center, its eighth internet data center, in Hòa L¡c Hi-Tech Park in Hanoi in 2023. These developments demonstrate the market's commitment to establishing robust digital infrastructure and improving regional connectivity.
The evolution of consumer behavior and digital content consumption is reshaping data center requirements. According to recent statistics, 22% of the population uses the internet for more than 9 hours daily for various activities, including studying, entertainment, and shopping. Streaming services have gained significant traction, with YouTube emerging as the leading platform with 73% penetration in 2023. This shift in consumer behavior has prompted data center operators to enhance their capabilities in content delivery and edge computing, ensuring seamless delivery of digital services while maintaining low latency.
The market is experiencing a notable transition in facility specifications and standards. Tier 3 facilities dominate the landscape, offering enhanced reliability and redundancy compared to lower-tier installations. These facilities are increasingly adopting advanced cooling technologies and power management systems to improve efficiency and reduce operational costs. The industry is also witnessing a gradual shift toward green data centers, with operators incorporating renewable energy sources and implementing energy-efficient designs. This evolution is supported by partnerships between local and international players, fostering knowledge transfer and technological advancement in the Vietnamese data center ecosystem.
Vietnam Data Center Market Trends
Prioritizing digital initiatives, such as 5G, growing consumer spending to drives the market growth
- The total number of smartphone users in the country was 77.9 million in 2023, which is expected to register a CAGR of 3.09% during the forecast period to reach a value of 93.5 million by 2029.
- The usage of digital technology is rapidly expanding in Vietnam. The quick adoption of Internet and smartphone technology in various businesses has significantly impacted consumer behaviour. In 2022, consumer spending in Vietnam increased to USD 214.68 Billion from USD 193.08 Billion in 2021. As a result, more people can now purchase smartphones, leading to an increase in smartphone usage. Additionally, Vietnam has more than 73% of adults using smartphones. The government aims to increase this proportion to more than 80% by 2025 through the National Digital Infrastructure Strategy by 2025.
- Over the next several years, it is anticipated that 5G technology will be deployed, and the 4G network will extend across the country. The government has four operators: MobiFone, Vietnamobile, Viettal Mobile, and Vinaphone, with 4G customers. In 2022, Vietnam will issue licenses for 5G services, starting to expand 5G from Ho Chi Minh City and Hanoi and extending to other urban and industrial zones. Vietnam's three mobile operators, MobiFone, Viettel Mobile, and Vinaphone, have piloted 5G in 16 cities and provinces. MobiFone proposed sharing a 5G network among carriers in remote areas with low demand to uptake cost-saving. The operators are looking to commercialize 5G over the coming years, while 4G and 3G are highly significant because consumers spend most time connected to these mature technologies. The increased network connectivity of 3G and 4G networks and the deployment of 5G in smartphones will cater to an increase in smartphone users in the country.

Understand The Key Trends Shaping This Market
Download PDF
The increasing investments for the expansion of 5G network by Operators and region vision to grow digital with the government support drives the growth of the market
- In 2022, the launch of the 5G network and Viettel revolutionized the digital market of the country. MIC has been assigned primary responsibility for accelerating the development of the digital economy, as reported by OpenGov Asia. The Ministry is tasked with directing and assisting other ministries, agencies, and local governments in implementing the strategy. In addition, it provides the Prime Minister with reports on its achievements. Further, owing to an increase in the country's GDP, it is expected that from 2023 to 2030, wireless and broadband subscription rates will continue to rise across Vietnam, resulting in increased revenues for operators.
- The market share of Vientel, Vinaphone, and Mobifone ranges from about 90% to more than 90%. At the same time, mergers involving less prominent players such as Gmobile, Saigon Ho Chi Minh Telecommunications, Post Saigon Tel, or SCTV could be announced in the future. Also, to attract private investment and improve market transparency, the government could sell down its stakes in VNPT and Mobifone by up to 50%. Moreover, according to a resolution passed by the Politburo on Guidelines for Participation in the Fourth Industrial Revolution, Vietnam has plans to increase its share of the digital economy's gross domestic product (GDP) to 20% by 2025. Vietnam enjoys 99.8% 4G coverage nationwide, with three major carriers, Viettel, VNPT, and MobiFone, successfully piloting 5G technology in 16 cities and provinces. Due to the increasing launch of 4G and 5G, the country is expected to shut down its 2G and 3G services.

OTHER KEY INDUSTRY TRENDS COVERED IN THE REPORT
- Rising mobile data bandwidth speeds, increased inclination toward mobile gaming, and an increasing averaging sprnding time on social networking sites drives the growth of the market
- Growing demand for the bandwidth, FTTH penetration, and Government initivatives to develop Telecom infrastructre drives the growth of the market
- Government initiatives to improve its digital infrastructure, and rising broadband speed drives the market growth
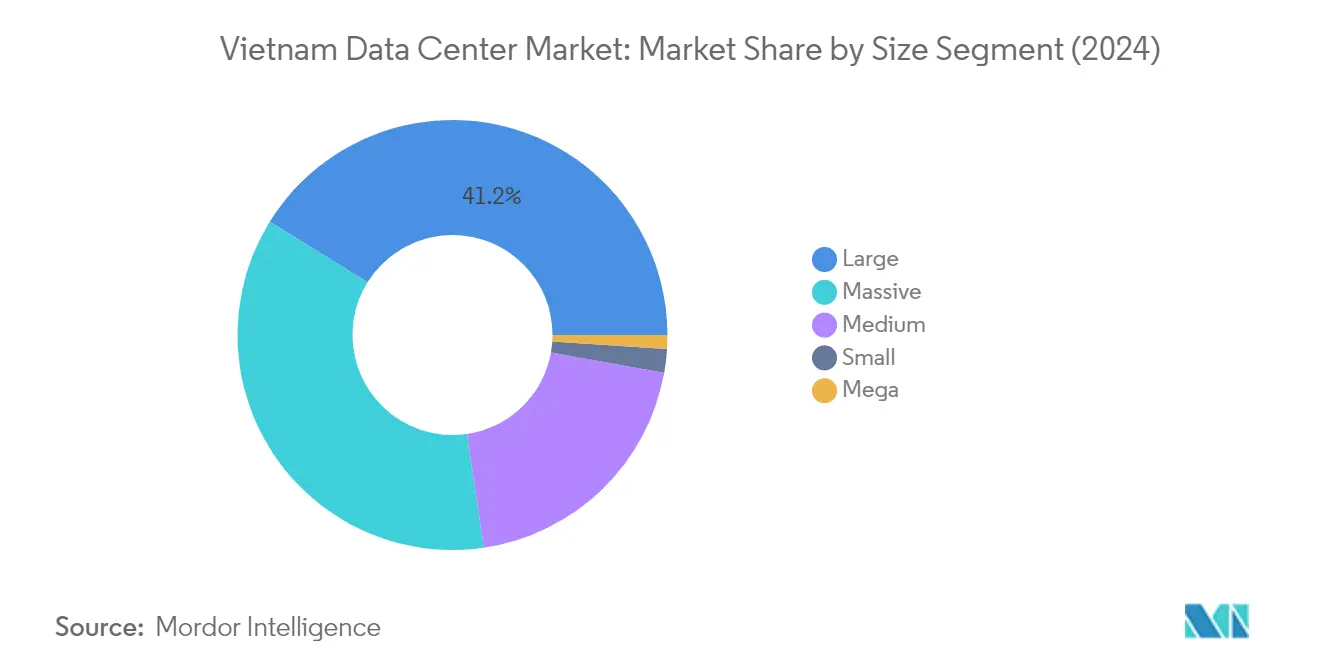
Segment Analysis: Data Center Size
Large Segment in Vietnam Data Center Market
The large segment dominates the Vietnam data center market, commanding approximately 41% market share in 2024. This segment consists of 11 data center facilities with a significant presence in key regions, with the Hanoi region accounting for about 55% of large facilities, followed by the Ho Chi Minh region with roughly 37% market share. Major operators in this category include industry leaders like Viettel IDC, FPT Telecom International, Telehouse, and VNPT, who have established robust infrastructure and comprehensive service offerings. The segment's prominence is driven by increasing demand from enterprises requiring substantial computing power and storage capabilities while maintaining operational efficiency and reliability.
Mega Segment in Vietnam Data Center Market
The mega segment is emerging as the fastest-growing category in the Vietnam data center market, projected to grow at approximately 49% during 2024-2029. This remarkable growth trajectory is primarily driven by Gaw Capital's ambitious plans to establish the country's first mega data center, with a planned capacity of 20 MW and a total floor area of 195,500 sq. ft. The construction of this facility, set to commence in 2023 and continue through 2030, represents a significant milestone in Vietnam's data center infrastructure development. This expansion reflects the increasing demand for hyperscale facilities and demonstrates Vietnam's growing importance as a regional data center hub.
Remaining Segments in Data Center Size
The massive, medium, and small segments complete the Vietnamese data center market landscape, each serving distinct market needs. The massive segment caters to large-scale operations requiring substantial computing power, while medium-sized facilities serve as the backbone for regional and mid-sized enterprise operations. The small segment focuses on specialized and localized data center requirements, primarily serving specific industry verticals or geographical locations. These segments collectively contribute to a diverse and comprehensive data center ecosystem, offering various capacity options to meet different business requirements and technological needs across Vietnam.
Segment Analysis: Tier Type
Tier 3 Segment in Vietnam Data Center Market
The Tier 3 segment dominates the Vietnam data center market, commanding approximately 88% market share in 2024. This significant market position is driven by the increasing demand for uninterrupted business services and growing adoption by global companies seeking business continuity services. Currently, there are 25 Tier 3 certified data centers operating across Vietnam, with major concentrations in Ho Chi Minh City and Hanoi regions. Leading operators like Viettel IDC, FPT Telecom, VNPT, and QTSC Telecom are actively expanding their Tier 3 facilities to meet the rising demand from various sectors, including online entertainment, video streaming, and gaming platforms that require minimum downtime and 24/7 support capabilities.
Tier 4 Segment in Vietnam Data Center Market
The Tier 4 segment is emerging as the fastest-growing category in the Vietnam data center market, projected to grow at approximately 46% during 2024-2029. This remarkable growth trajectory is supported by major development initiatives from key industry players. Three significant data center facilities are currently under construction with Tier 4 standards by VNPT, Gaw Capital, and FPT Telecom. VNPT's facility in Hanoi is being developed in five phases, with the first phase designed to support up to 500 racks. Additionally, Gaw Capital Partners is developing a facility with an IT capacity of 20 MW, while FPT Telecom is establishing a new data center facility in HCMC Hi-Tech Park with an IT capacity of approximately 18 MW covering an area of 10,000 square meters.
Remaining Segments in Tier Type
The Tier 1 & 2 segment represents a smaller portion of the Vietnam data center market, primarily consisting of basic facilities with limited redundancy capabilities. These lower-tier facilities are operated by providers like Telehouse and Universal Smart Data Center Technology (USDC) in the Hanoi and Ho Chi Minh City regions. However, the market is witnessing a clear shift away from these basic tier facilities as businesses increasingly prioritize higher reliability and uptime guarantees. This trend is evident in the lack of new construction projects for Tier 1 & 2 facilities, with only existing facilities maintaining their operations to serve specific market niches.
Segment Analysis: Absorption
Utilized Segment in Vietnam Data Center Market
The utilized segment dominates the Vietnam data center market, commanding approximately 79% market share in 2024, driven by the increasing migration of enterprise data to cloud platforms and the growing adoption of data storage solutions. This segment is also experiencing the strongest growth trajectory, projected to expand at around 6% CAGR from 2024 to 2029, fueled by Vietnam's emerging e-commerce sector and its booming market value. The share of enterprises selling products via e-commerce channels has grown tremendously, with more businesses adopting digital transformation initiatives. Major cloud service providers and hyperscalers are actively expanding their presence in Vietnam, contributing to higher utilization rates. The growing Vietnamese data center market has prompted data center providers to expand their operations in the country and improve the absorption rate among facilities. The move towards a digital economy has created a significant level of demand for internet-based infrastructure, directly impacting the utilization rates in Vietnam's data center facilities.
Non-Utilized Segment in Vietnam Data Center Market
The non-utilized segment represents the available capacity in Vietnam's data center market that remains unused or reserved for future expansion. This segment plays a crucial role in the market as it provides the necessary headroom for rapid scaling and future growth opportunities. Data center operators maintain this buffer capacity to accommodate sudden surges in demand, new client acquisitions, and expansion requirements of existing clients. The strategic importance of maintaining non-utilized capacity is particularly evident in emerging markets like Vietnam, where demand patterns can be unpredictable and rapid growth scenarios need to be accommodated. This segment also serves as a risk mitigation strategy, allowing data center operators to respond quickly to market opportunities without the delays associated with new construction or expansion projects. The presence of non-utilized capacity also enables data center operators to offer flexible scaling options to their clients, enhancing their competitive position in the market.
Vietnam Data Center Industry Overview
Top Companies in Vietnam Data Center Market
The Vietnamese data center market features a mix of domestic telecom operators and international players competing for market share in data centers. Companies are focusing on expanding their facilities across key cities like Ho Chi Minh City and Hanoi while upgrading existing infrastructure to meet growing demand. Operational strategies emphasize providing comprehensive Vietnam colocation services alongside value-added offerings like cloud connectivity and managed services. Market leaders are investing in next-generation technologies, including advanced cooling systems, enhanced power infrastructure, and automated monitoring capabilities. Strategic partnerships with global cloud providers and technology vendors are becoming increasingly common as operators aim to strengthen their service portfolios. Facility certifications and compliance with international standards remain key focus areas for maintaining competitive advantage.
Domestic Players Dominate Vietnamese Data Center Landscape
The Vietnamese data center market is characterized by strong domestic leadership, with local telecom giants leveraging their existing infrastructure and customer relationships to maintain dominant positions. State-owned enterprises and established telecommunications providers control significant market share in data centers through their extensive network presence and deep understanding of local business requirements. While international players are gradually entering the market through joint ventures and partnerships, domestic operators continue to hold competitive advantages in terms of land access, regulatory compliance, and established customer relationships.
The market shows moderate consolidation with a handful of major players controlling the majority of capacity, though new entrants are emerging as demand grows. Joint ventures between local and international players are becoming more common as a way to combine global expertise with local market knowledge. The competitive landscape is evolving with increased investment in hyperscale facilities and edge data centers to serve growing digital transformation needs. Market participants are expanding their geographical presence while simultaneously upgrading existing facilities to maintain competitive positioning.
Innovation and Scale Drive Future Success
Success in the Vietnamese data center market increasingly depends on operators' ability to scale operations while maintaining service quality and reliability. Incumbents must focus on modernizing infrastructure, expanding capacity in key growth areas, and developing comprehensive service offerings that address evolving customer needs. Building strong relationships with cloud providers and technology partners while maintaining high operational standards will be crucial for maintaining market leadership. Companies need to balance investment in new facilities with upgrading existing infrastructure while maintaining competitive pricing structures.
New entrants and challenger operators can gain market share by focusing on underserved segments and locations while offering specialized services that address specific industry needs. Success factors include developing strong local partnerships, ensuring regulatory compliance, and building scalable infrastructure that can grow with market demand. Operators must carefully consider facility locations to optimize connectivity while managing costs and regulatory requirements. The ability to provide comprehensive solutions, including connectivity, cloud access, and managed services, will become increasingly important as the market matures and customer requirements evolve.
Vietnam Data Center Market Leaders
-
CMC Telecom
-
DTS Communication
-
Telehouse (KDDI Corporation)
-
VNG Cloud
-
VNPT Online
- *Disclaimer: Major Players sorted in no particular order

Need More Details on Market Players and Competiters?
Download PDF
Vietnam Data Center Market News
- September 2021: Viettel jointly conducted trials with Samsung in Da Nang. The company partnered with Ericsson and Qualcomm to test and achieve 5G data transmission speeds of over 4.7 Gbps.
- September 2021: VNPT announced that it had signed an agreement with Nokia to upgrade its backbone and core networks, develop 4G, 5G, and M2M/IoT platforms, conduct commercial tests of 5G services, and develop and apply new networking technologies.
- September 2019: HTC-ITC signed a contract with Delta Thailand to deploy a data center that complies with Uptime Institute’s Tier 3 standards of Tier Certification of Data Center (TCDD) and Tier Certification of Constructed Data Center Facility (TCCF).
Free With This Report
We provide a complimentary and exhaustive set of data points on the country and regional level metrics that present the fundamental structure of the industry. Presented in the form of 50+ free charts, the sections cover difficult to find data on various countries on smartphone users, data traffic per smartphone, mobile and broadband data speed, fiber connectivity network, and submarine cables.


Vietnam Data Center Market Report - Table of Contents
1. EXECUTIVE SUMMARY & KEY FINDINGS
2. REPORT OFFERS
3. INTRODUCTION
- 3.1 Study Assumptions & Market Definition
- 3.2 Scope of the Study
- 3.3 Research Methodology
4. MARKET OUTLOOK
- 4.1 It Load Capacity
- 4.2 Raised Floor Space
- 4.3 Colocation Revenue
- 4.4 Installed Racks
- 4.5 Rack Space Utilization
- 4.6 Submarine Cable
5. Key Industry Trends
- 5.1 Smartphone Users
- 5.2 Data Traffic Per Smartphone
- 5.3 Mobile Data Speed
- 5.4 Broadband Data Speed
- 5.5 Fiber Connectivity Network
-
5.6 Regulatory Framework
- 5.6.1 Vietnam
- 5.7 Value Chain & Distribution Channel Analysis
6. MARKET SEGMENTATION (INCLUDES MARKET SIZE IN VOLUME, FORECASTS UP TO 2030 AND ANALYSIS OF GROWTH PROSPECTS)
-
6.1 Hotspot
- 6.1.1 Hanoi
- 6.1.2 Ho Chi Minh City
- 6.1.3 Others
- 6.1.4 Rest of Vietnam
-
6.2 Data Center Size
- 6.2.1 Large
- 6.2.2 Massive
- 6.2.3 Medium
- 6.2.4 Mega
- 6.2.5 Small
-
6.3 Tier Type
- 6.3.1 Tier 1 and 2
- 6.3.2 Tier 3
- 6.3.3 Tier 4
-
6.4 Absorption
- 6.4.1 Non-Utilized
- 6.4.2 Utilized
- 6.4.2.1 By Colocation Type
- 6.4.2.1.1 Hyperscale
- 6.4.2.1.2 Retail
- 6.4.2.1.3 Wholesale
- 6.4.2.2 By End User
- 6.4.2.2.1 BFSI
- 6.4.2.2.2 Cloud
- 6.4.2.2.3 E-Commerce
- 6.4.2.2.4 Government
- 6.4.2.2.5 Manufacturing
- 6.4.2.2.6 Media & Entertainment
- 6.4.2.2.7 Telecom
- 6.4.2.2.8 Other End User
- 6.4.2.2.9 Others
7. COMPETITIVE LANDSCAPE
- 7.1 Market Share Analysis
- 7.2 Company Landscape
-
7.3 Company Profiles (includes Global Level Overview, Market Level Overview, Core Business Segments, Financials, Headcount, Key Information, Market Rank, Market Share, Products and Services, and Analysis of Recent Developments).
- 7.3.1 CMC Telecom
- 7.3.2 DTS Communication
- 7.3.3 FPT Telecom Joint Stock Company
- 7.3.4 GDS (JV of NTT and VNPT)
- 7.3.5 HTC-ITC (Hanoi Telecommunications Corporation)
- 7.3.6 QTSC Telecom Center
- 7.3.7 Telehouse (KDDI Corporation)
- 7.3.8 USDC Technology
- 7.3.9 Viettel - CHT Company Limited (Viettel IDC)
- 7.3.10 Viettel IDC
- 7.3.11 VNG Cloud
- 7.3.12 VNPT Online
- 7.3.13 VNTT
- 7.4 LIST OF COMPANIES STUDIED
8. KEY STRATEGIC QUESTIONS FOR DATA CENTER CEOS
9. APPENDIX
-
9.1 Global Overview
- 9.1.1 Overview
- 9.1.2 Porter’s Five Forces Framework
- 9.1.3 Global Value Chain Analysis
- 9.1.4 Global Market Size and DROs
- 9.2 Sources & References
- 9.3 List of Tables & Figures
- 9.4 Primary Insights
- 9.5 Data Pack
- 9.6 Glossary of Terms
You Can Purchase Parts Of This Report. Check Out Prices For Specific Sections
Get Price Break-up Now
List of Tables & Figures
- Figure 1:
- VOLUME OF IT LOAD CAPACITY, MW, VIETNAM, 2018 - 2030
- Figure 2:
- VOLUME OF RAISED FLOOR AREA, SQ.FT. ('000), VIETNAM, 2018 - 2030
- Figure 3:
- VALUE OF COLOCATION REVENUE, USD MILLION, VIETNAM, 2018 - 2030
- Figure 4:
- VOLUME OF INSTALLED RACKS, NUMBER, VIETNAM, 2018 - 2030
- Figure 5:
- RACK SPACE UTILIZATION, %, VIETNAM, 2018 - 2030
- Figure 6:
- COUNT OF SMARTPHONE USERS, IN MILLION, VIETNAM, 2018 - 2030
- Figure 7:
- DATA TRAFFIC PER SMARTPHONE, GB, VIETNAM, 2018 - 2030
- Figure 8:
- AVERAGE MOBILE DATA SPEED, MBPS, VIETNAM, 2018 - 2030
- Figure 9:
- AVERAGE BROADBAND SPEED, MBPS, VIETNAM, 2018 - 2030
- Figure 10:
- LENGTH OF FIBER CONNECTIVITY NETWORK, KILOMETER, VIETNAM, 2018 - 2030
- Figure 11:
- VOLUME OF IT LOAD CAPACITY, MW, VIETNAM, 2018 - 2030
- Figure 12:
- VOLUME OF HOTSPOT, MW, VIETNAM, 2018 - 2030
- Figure 13:
- VOLUME SHARE OF HOTSPOT, %, VIETNAM, 2018 - 2030
- Figure 14:
- VOLUME SIZE OF HANOI, MW, VIETNAM, 2018 - 2030
- Figure 15:
- VOLUME SHARE OF HANOI, MW, HOTSPOT, %, VIETNAM, 2018 - 2030
- Figure 16:
- VOLUME SIZE OF HO CHI MINH CITY, MW, VIETNAM, 2018 - 2030
- Figure 17:
- VOLUME SHARE OF HO CHI MINH CITY, MW, HOTSPOT, %, VIETNAM, 2018 - 2030
- Figure 18:
- VOLUME SIZE OF OTHERS, MW, VIETNAM, 2018 - 2030
- Figure 19:
- VOLUME SHARE OF OTHERS, MW, HOTSPOT, %, VIETNAM, 2018 - 2030
- Figure 20:
- VOLUME SIZE OF REST OF VIETNAM, MW, VIETNAM, 2018 - 2030
- Figure 21:
- VOLUME SHARE OF REST OF VIETNAM, MW, HOTSPOT, %, VIETNAM, 2018 - 2030
- Figure 22:
- VOLUME OF DATA CENTER SIZE, MW, VIETNAM, 2018 - 2030
- Figure 23:
- VOLUME SHARE OF DATA CENTER SIZE, %, VIETNAM, 2018 - 2030
- Figure 24:
- VOLUME SIZE OF LARGE, MW, VIETNAM, 2018 - 2030
- Figure 25:
- VOLUME SIZE OF MASSIVE, MW, VIETNAM, 2018 - 2030
- Figure 26:
- VOLUME SIZE OF MEDIUM, MW, VIETNAM, 2018 - 2030
- Figure 27:
- VOLUME SIZE OF MEGA, MW, VIETNAM, 2018 - 2030
- Figure 28:
- VOLUME SIZE OF SMALL, MW, VIETNAM, 2018 - 2030
- Figure 29:
- VOLUME OF TIER TYPE, MW, VIETNAM, 2018 - 2030
- Figure 30:
- VOLUME SHARE OF TIER TYPE, %, VIETNAM, 2018 - 2030
- Figure 31:
- VOLUME SIZE OF TIER 1 AND 2, MW, VIETNAM, 2018 - 2030
- Figure 32:
- VOLUME SIZE OF TIER 3, MW, VIETNAM, 2018 - 2030
- Figure 33:
- VOLUME SIZE OF TIER 4, MW, VIETNAM, 2018 - 2030
- Figure 34:
- VOLUME OF ABSORPTION, MW, VIETNAM, 2018 - 2030
- Figure 35:
- VOLUME SHARE OF ABSORPTION, %, VIETNAM, 2018 - 2030
- Figure 36:
- VOLUME SIZE OF NON-UTILIZED, MW, VIETNAM, 2018 - 2030
- Figure 37:
- VOLUME OF COLOCATION TYPE, MW, VIETNAM, 2018 - 2030
- Figure 38:
- VOLUME SHARE OF COLOCATION TYPE, %, VIETNAM, 2018 - 2030
- Figure 39:
- VOLUME SIZE OF HYPERSCALE, MW, VIETNAM, 2018 - 2030
- Figure 40:
- VOLUME SIZE OF RETAIL, MW, VIETNAM, 2018 - 2030
- Figure 41:
- VOLUME SIZE OF WHOLESALE, MW, VIETNAM, 2018 - 2030
- Figure 42:
- VOLUME OF END USER, MW, VIETNAM, 2018 - 2030
- Figure 43:
- VOLUME SHARE OF END USER, %, VIETNAM, 2018 - 2030
- Figure 44:
- VOLUME SIZE OF BFSI, MW, VIETNAM, 2018 - 2030
- Figure 45:
- VOLUME SIZE OF CLOUD, MW, VIETNAM, 2018 - 2030
- Figure 46:
- VOLUME SIZE OF E-COMMERCE, MW, VIETNAM, 2018 - 2030
- Figure 47:
- VOLUME SIZE OF GOVERNMENT, MW, VIETNAM, 2018 - 2030
- Figure 48:
- VOLUME SIZE OF MANUFACTURING, MW, VIETNAM, 2018 - 2030
- Figure 49:
- VOLUME SIZE OF MEDIA & ENTERTAINMENT, MW, VIETNAM, 2018 - 2030
- Figure 50:
- VOLUME SIZE OF TELECOM, MW, VIETNAM, 2018 - 2030
- Figure 51:
- VOLUME SIZE OF OTHER END USER, MW, VIETNAM, 2018 - 2030
- Figure 52:
- VOLUME SIZE OF OTHERS, MW, VIETNAM, 2018 - 2030
- Figure 53:
- VOLUME SHARE OF MAJOR PLAYERS, %, VIETNAM
Vietnam Data Center Industry Segmentation
Hanoi, Ho Chi Minh City, Others are covered as segments by Hotspot. Large, Massive, Medium, Mega, Small are covered as segments by Data Center Size. Tier 1 and 2, Tier 3, Tier 4 are covered as segments by Tier Type. Non-Utilized, Utilized are covered as segments by Absorption.| Hotspot | Hanoi | |||
| Ho Chi Minh City | ||||
| Others | ||||
| Rest of Vietnam | ||||
| Data Center Size | Large | |||
| Massive | ||||
| Medium | ||||
| Mega | ||||
| Small | ||||
| Tier Type | Tier 1 and 2 | |||
| Tier 3 | ||||
| Tier 4 | ||||
| Absorption | Non-Utilized | |||
| Utilized | By Colocation Type | Hyperscale | ||
| Retail | ||||
| Wholesale | ||||
| By End User | BFSI | |||
| Cloud | ||||
| E-Commerce | ||||
| Government | ||||
| Manufacturing | ||||
| Media & Entertainment | ||||
| Telecom | ||||
| Other End User | ||||
| Others | ||||
Need A Different Region or Segment?
Customize Now
Market Definition
- IT LOAD CAPACITY - The IT load capacity or installed capacity, refers to the amount of energy consumed by servers and network equipments placed in a rack installed. It is measured in megawatt (MW).
- ABSORPTION RATE - It denotes the extend to which the data center capacity has been leased out. For instance, a 100 MW DC has leased out 75 MW, then absorption rate would be 75%. It is also referred as utilization rate and leased-out capacity.
- RAISED FLOOR SPACE - It is an elevated space build over the floor. This gap between the original floor and the elevated floor is used to accommodate wiring, cooling, and other data center equipment. This arrangement assist in having proper wiring and cooling infrastructure. It is measured in square feet (ft^2).
- DATA CENTER SIZE - Data Center Size is segmented based on the raised floor space allocated to the data center facilities. Mega DC - # of Racks must be more than 9000 or RFS (raised floor space) must be more than 225001 Sq. ft; Massive DC - # of Racks must be in between 9000 and 3001 or RFS must be in between 225000 Sq. ft and 75001 Sq. ft; Large DC - # of Racks must be in between 3000 and 801 or RFS must be in between 75000 Sq. ft and 20001 Sq. ft; Medium DC # of Racks must be in between 800 and 201 or RFS must be in between 20000 Sq. ft and 5001 Sq. ft; Small DC - # of Racks must be less than 200 or RFS must be less than 5000 Sq. ft.
- TIER TYPE - According to Uptime Institute the data centers are classified into four tiers based on the proficiencies of redundant equipment of the data center infrastructure. In this segment the data center are segmented as Tier 1,Tier 2, Tier 3 and Tier 4.
- COLOCATION TYPE - The segment is segregated into 3 categories namely Retail, Wholesale and Hyperscale Colocation service. The categorization is done based on the amount of IT load leased out to potential customers. Retail colocation service has leased capacity less than 250 kW; Wholesale colocation services has leased capacity between 251 kW and 4 MW and Hyperscale colocation services has leased capacity more than 4 MW.
- END CONSUMERS - The Data Center Market operates on a B2B basis. BFSI, Government, Cloud Operators, Media and Entertainment, E-Commerce, Telecom and Manufacturing are the major end-consumers in the market studied. The scope only includes colocation service operators catering to the increasing digitalization of the end-user industries.
| Keyword | Definition |
|---|---|
| Rack Unit | Generally referred as U or RU, it is the unit of measurement for the server unit housed in the racks in the data center. 1U is equal to 1.75 inches. |
| Rack Density | It defines the amount of power consumed by the equipment and server housed in a rack. It is measured in kilowatt (kW). This factor plays a critical role in data center design and, cooling and power planning. |
| IT Load Capacity | The IT load capacity or installed capacity, refers to the amount of energy consumed by servers and network equipment placed in a rack installed. It is measured in megawatt (MW). |
| Absorption Rate | It denotes how much of the data center capacity has been leased out. For instance, if a 100 MW DC has leased out 75 MW, then the absorption rate would be 75%. It is also referred to as utilization rate and leased-out capacity. |
| Raised Floor Space | It is an elevated space built over the floor. This gap between the original floor and the elevated floor is used to accommodate wiring, cooling, and other data center equipment. This arrangement assists in having proper wiring and cooling infrastructure. It is measured in square feet/meter. |
| Computer Room Air Conditioner (CRAC) | It is a device used to monitor and maintain the temperature, air circulation, and humidity inside the server room in the data center. |
| Aisle | It is the open space between the rows of racks. This open space is critical for maintaining the optimal temperature (20-25 °C) in the server room. There are primarily two aisles inside the server room, a hot aisle and a cold aisle. |
| Cold Aisle | It is the aisle wherein the front of the rack faces the aisle. Here, chilled air is directed into the aisle so that it can enter the front of the racks and maintain the temperature. |
| Hot Aisle | It is the aisle where the back of the racks faces the aisle. Here, the heat dissipated from the equipment’s in the rack is directed to the outlet vent of the CRAC. |
| Critical Load | It includes the servers and other computer equipment whose uptime is critical for data center operation. |
| Power Usage Effectiveness (PUE) | It is a metric which defines the efficiency of a data center. It is calculated by: (𝑇𝑜𝑡𝑎𝑙 𝐷𝑎𝑡𝑎 𝐶𝑒𝑛𝑡𝑒𝑟 𝐸𝑛𝑒𝑟𝑔𝑦 𝐶𝑜𝑛𝑠𝑢𝑚𝑝𝑡𝑖𝑜𝑛)/(𝑇𝑜𝑡𝑎𝑙 𝐼𝑇 𝐸𝑞𝑢𝑖𝑝𝑚𝑒𝑛𝑡 𝐸𝑛𝑒𝑟𝑔𝑦 𝐶𝑜𝑛𝑠𝑢𝑚𝑝𝑡𝑖𝑜𝑛). Further, a data center with a PUE of 1.2-1.5 is considered highly efficient, whereas, a data center with a PUE >2 is considered highly inefficient. |
| Redundancy | It is defined as a system design wherein additional component (UPS, generators, CRAC) is added so that in case of power outage, equipment failure, the IT equipment should not be affected. |
| Uninterruptible Power Supply (UPS) | It is a device that is connected in series with the utility power supply, storing energy in batteries such that the supply from UPS is continuous to IT equipment even during utility power is snapped. The UPS primarily supports the IT equipment only. |
| Generators | Just like UPS, generators are placed in the data center to ensure an uninterrupted power supply, avoiding downtime. Data center facilities have diesel generators and commonly, 48-hour diesel is stored in the facility to prevent disruption. |
| N | It denotes the tools and equipment required for a data center to function at full load. Only "N" indicates that there is no backup to the equipment in the event of any failure. |
| N+1 | Referred to as 'Need plus one', it denotes the additional equipment setup available to avoid downtime in case of failure. A data center is considered N+1 when there is one additional unit for every 4 components. For instance, if a data center has 4 UPS systems, then for to achieve N+1, an additional UPS system would be required. |
| 2N | It refers to fully redundant design wherein two independent power distribution system is deployed. Therefore, in the event of a complete failure of one distribution system, the other system will still supply power to the data center. |
| In-Row Cooling | It is the cooling design system installed between racks in a row where it draws warm air from the hot aisle and supplies cool air to the cold aisle, thereby maintaining the temperature. |
| Tier 1 | Tier classification determines the preparedness of a data center facility to sustain data center operation. A data center is classified as Tier 1 data center when it has a non-redundant (N) power component (UPS, generators), cooling components, and power distribution system (from utility power grids). The Tier 1 data center has an uptime of 99.67% and an annual downtime of <28.8 hours. |
| Tier 2 | A data center is classified as Tier 2 data center when it has a redundant power and cooling components (N+1) and a single non-redundant distribution system. Redundant components include extra generators, UPS, chillers, heat rejection equipment, and fuel tanks. The Tier 2 data center has an uptime of 99.74% and an annual downtime of <22 hours. |
| Tier 3 | A data center having redundant power and cooling components and multiple power distribution systems is referred to as a Tier 3 data center. The facility is resistant to planned (facility maintenance) and unplanned (power outage, cooling failure) disruption. The Tier 3 data center has an uptime of 99.98% and an annual downtime of <1.6 hours. |
| Tier 4 | It is the most tolerant type of data center. A Tier 4 data center has multiple, independent redundant power and cooling components and multiple power distribution paths. All IT equipment are dual powered, making them fault tolerant in case of any disruption, thereby ensuring interrupted operation. The Tier 4 data center has an uptime of 99.74% and an annual downtime of <26.3 minutes. |
| Small Data Center | Data center that has floor space area of ≤ 5,000 Sq. ft or the number of racks that can be installed is ≤ 200 is classified as a small data center. |
| Medium Data Center | Data center which has floor space area between 5,001-20,000 Sq. ft, or the number of racks that can be installed is between 201-800, is classified as a medium data center. |
| Large Data Center | Data center which has floor space area between 20,001-75,000 Sq. ft, or the number of racks that can be installed is between 801-3,000, is classified as a large data center. |
| Massive Data Center | Data center which has floor space area between 75,001-225,000 Sq. ft, or the number of racks that can be installed is between 3001-9,000, is classified as a massive data center. |
| Mega Data Center | Data center that has a floor space area of ≥ 225,001 Sq. ft or the number of racks that can be installed is ≥ 9001 is classified as a mega data center. |
| Retail Colocation | It refers to those customers who have a capacity requirement of 250 kW or less. These services are majorly opted by small and medium enterprises (SMEs). |
| Wholesale Colocation | It refers to those customers who have a capacity requirement between 250 kW to 4 MW. These services are majorly opted by medium to large enterprises. |
| Hyperscale Colocation | It refers to those customers who have a capacity requirement greater than 4 MW. The hyperscale demand primarily originates from large-scale cloud players, IT companies, BFSI, and OTT players (like Netflix, Hulu, and HBO+). |
| Mobile Data Speed | It is the mobile internet speed a user experiences via their smartphones. This speed is primarily dependent on the carrier technology being used in the smartphone. The carrier technologies available in the market are 2G, 3G, 4G, and 5G, where 2G provides the slowest speed while 5G is the fastest. |
| Fiber Connectivity Network | It is a network of optical fiber cables deployed across the country, connecting rural and urban regions with high-speed internet connection. It is measured in kilometer (km). |
| Data Traffic per Smartphone | It is a measure of average data consumption by a smartphone user in a month. It is measured in gigabyte (GB). |
| Broadband Data Speed | It is the internet speed that is supplied over the fixed cable connection. Commonly, copper cable and optic fiber cable are used in both residential and commercial use. Here, optic cable fiber provides faster internet speed than copper cable. |
| Submarine Cable | A submarine cable is a fiber optic cable laid down at two or more landing points. Through this cable, communication and internet connectivity between countries across the globe is established. These cables can transmit 100-200 terabits per second (Tbps) from one point to another. |
| Carbon Footprint | It is the measure of carbon dioxide generated during the regular operation of a data center. Since, coal, and oil & gas are the primary source of power generation, consumption of this power contributes to carbon emissions. Data center operators are incorporating renewable energy sources to curb the carbon footprint emerging in their facilities. |
Need More Details on Market Definition?
Ask a Question
Research Methodology
Mordor Intelligence follows a four-step methodology in all our reports.
- Step-1: Identify Key Variables: In order to build a robust forecasting methodology, the variables and factors identified in Step-1 are tested against available historical market numbers. Through an iterative process, the variables required for market forecast are set and the model is built on the basis of these variables.
- Step-2: Build a Market Model: Market-size estimations for the forecast years are in nominal terms. Inflation is not a part of the pricing, and the average selling price (ASP) is kept constant throughout the forecast period for each country.
- Step-3: Validate and Finalize: In this important step, all market numbers, variables and analyst calls are validated through an extensive network of primary research experts from the market studied. The respondents are selected across levels and functions to generate a holistic picture of the market studied.
- Step-4: Research Outputs: Syndicated Reports, Custom Consulting Assignments, Databases & Subscription Platforms

Get More Details On Research Methodology
Download PDF


