| Study Period | 2017 - 2030 |
| Base Year For Estimation | 2024 |
| Forecast Data Period | 2025 - 2030 |
| Market Size (2025) | USD 1.75 Billion |
| Market Size (2030) | USD 2.53 Billion |
| CAGR (2025 - 2030) | 7.66 % |
| Market Concentration | Medium |
Major Players*Disclaimer: Major Players sorted in no particular order |
 Market Size")
Vietnam Courier, Express, and Parcel (CEP) Market Analysis
The Vietnam Courier, Express, and Parcel (CEP) Market size is estimated at 1.75 billion USD in 2025, and is expected to reach 2.53 billion USD by 2030, growing at a CAGR of 7.66% during the forecast period (2025-2030).
Vietnam's logistics landscape is undergoing significant transformation, driven by increasing foreign direct investment (FDI) and infrastructure development. In 2023, the country attracted USD 36.61 billion in FDI, representing a substantial 32.1% year-over-year increase despite global economic headwinds. The government has prioritized investment in modern transport infrastructure, including roads, railways, marine and inland waterways, and airports. Construction of 12 North-South expressway projects commenced in early 2023, with approximately 475 km of expressways added during the year. Several key transport projects were initiated, including three east-west expressways, the Long Thành International Airport, Phú Bài Airport, and iÇn Biên Airport, demonstrating the country's commitment to enhancing its logistics capabilities.
The Vietnamese Courier, Express, and Parcel (CEP) market faces both opportunities and challenges in its operational landscape. Logistics costs remain a significant concern, accounting for 20-22% of the country's GDP in 2022, primarily attributed to high road transport costs, seaport surcharges, and limitations in seaport infrastructure. Nearly 80% of logistics movement in the country is conducted through road transportation, while railway, waterway, and airway account for the remainder. The market is particularly concentrated in urban centers, with approximately 75% of daily e-commerce orders being transacted in Hanoi and Ho Chi Minh City, leading to increased operational costs due to heavy traffic congestion.
The market is witnessing substantial investments in infrastructure and capacity expansion. In March 2023, Lazada Logistics Vietnam inaugurated the Lazada Logistics Park, a state-of-the-art commodity sorting center in the Sóng Th§n 1 Industrial Zone of Bình D°¡ng province. This 20,000-square-meter facility, the largest and most advanced logistics center in the province, can handle up to 1 million parcels daily and is equipped with cutting-edge technologies, including artificial intelligence and machine learning, with 99% of sorting lines being automated. The company has invested significantly in developing modern and sustainable logistics services infrastructure, operating a comprehensive system of sorting centers, warehouses, and post offices encompassing 150,000 square meters.
International connectivity and cross-border trade are becoming increasingly important for the Vietnamese CEP market. In October 2023, FedEx launched intercontinental services between Vietnam and Singapore, as well as other key markets in Asia, the Middle East, Africa, and Europe. The company introduced a dedicated B767 freighter flight operating four evenings weekly from Ho Chi Minh City, connecting Asia and Europe through the FedEx Asia Pacific Hub in Guangzhou, China. This expansion is particularly significant given that bilateral trade between Vietnam and Singapore reached USD 31.3 billion in 2022, with Singapore emerging as Vietnam's second-largest cumulative foreign investor with investments totaling USD 70.8 billion.
Vietnam Courier, Express, and Parcel (CEP) Market Trends
The government aims to increase the total length of expressways to 3,000 km by end of 2025
- In 2023, the Government prioritized investment in modern transport infrastructure, including roads, railways, marine and inland waterways, and airports. In 2023, construction began on 12 North-South expressway projects, with nine new traffic projects inaugurated and four completed. Around 475 km of expressways were added that year. Other key transport projects initiated in 2023 included three east-west expressways, the Long Thành International Airport, Phú Bài Airport, Điện Biên Airport, Mỹ Thuận 2 Bridge, and Vĩnh Tuy 2 Bridge. As major transport infrastructure is completed in 2023, the GDP growth of the transport sector is estimated to increase in 2024 and 2025.
- Vietnam's Ministry of Transport plans to break ground on 14 infrastructure projects and complete 50 more by 2025, including key parts of the North-South Expressway. This is part of the goal to expand the country’s expressways to 3,000 km by 2025, up from the current 2,021 km. Additionally, the Long Thanh International Airport, a USD 14.12 billion project in Dong Nai province, is on track to finish in 2025. Once completed, it will be the country's largest airport, easing congestion at Tan Son Nhat in Ho Chi Minh City.
,-Share---Of-GDP,-Vietnam,-2017---2022.svg)
Understand The Key Trends Shaping This Market
Download PDF
Vietnam aims to expand its national fuel storage capacity by 2030, with an investment of up to USD 11.4 billion
- In December 2023, Vietnam reduced retail prices of gasoline and other oil products for the fourth consecutive time. The price of E5 RON 92 per liter was decreased by VND 509 (USD 0.021) to VND 21,290 (USD 0.9), and RON95-III petrol price was lowered to VND 22,322 (USD 0.944) per liter. The ministries of finance, industry, and trade responsible for these adjustments opted not to utilize the petrol and oil price stabilization fund. Since the start of the year, Vietnam has adjusted petrol prices 35 times.
- In 2022, the retail price of RON 95 gasoline in Vietnam reached its highest point in eight years, reaching VND 26,287 (USD 1.14) per liter. The increase in fuel prices in Vietnam was exacerbated by domestic gasoline shortages caused by the Nghi Son Oil Refinery, the country's largest refinery, reducing production by 20% from January 2022 due to financial challenges. Although the refinery has obtained temporary investment, it might be forced to cease operations if it fails to secure sufficient liquidity or loans to procure Kuwaiti crude oil. Moreover, Vietnam has approved a plan to expand its national fuel storage capacity by 2030, with an investment of up to USD 11.4 billion. The investment would raise the country's crude oil and refined fuel storage capacity to 75 to 80 days of net imports, from 65 days currently.

OTHER KEY INDUSTRY TRENDS COVERED IN THE REPORT
- Vietnam leads ASEAN in consumer spending and online growth, predicts USD 57 billion digital economy by 2025
- Construction and manufacturing sectors capturing major GDP growth supported by rising FDI inflows
- E-commerce is expected to register a CAGR of 12.38% during 2023-27, supported by the national e-commerce development plan
- Vietnam anticipates manufacturing and processing sectors to drive 90% of exports by 2030
- Vietnam's Logistic Performance Index surges to 3.3 points in 2023, driven by logistics sector and export growth
- The textiles and garments manufacturing sector to advance in Vietnam in lines with its textile strategy
- Inflationary pressures are expected to ease in the coming years in Vietnam
- The GVA of the manufacturing sector expanded by over 12% YoY in 2022, led by the textiles and apparel sub-segment
- Vietnam is prioritizing imports of machinery and equipment to advance its economy
- Vietnam accelerates infrastructural development with USD 21 billion investment by 2025, focusing on transport and urban projects
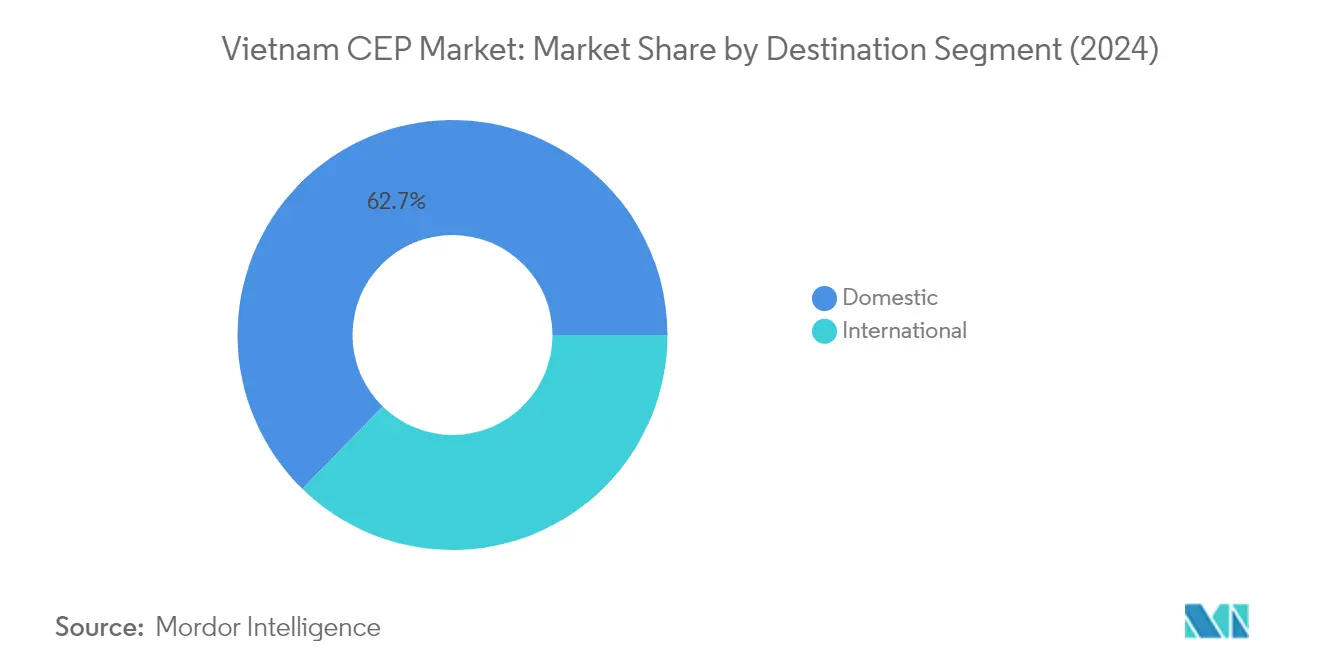
Segment Analysis: By Destination
Domestic Segment in Vietnam CEP Market
The domestic segment dominates the Vietnam courier, express, and parcel (CEP) market, commanding approximately 63% market share in 2024. This significant market position is driven by the thriving e-commerce sector, with major players like Shopee, Lazada, and Tiki generating substantial domestic delivery volumes. The segment's growth is further supported by Vietnam's expanding retail sector, with retail sales of consumer goods and services reaching significant levels. The domestic CEP market benefits from extensive infrastructure development, including the presence of numerous sorting centers, warehouses, and post offices across the country. Key players like Vietnam Post, Viettel Post, and Giao Hang Nhanh have established comprehensive nationwide networks to facilitate efficient parcel delivery.
International Segment in Vietnam CEP Market
The international segment of Vietnam's CEP market is projected to exhibit robust growth, with an expected CAGR of approximately 8% during 2024-2029. This growth trajectory is primarily driven by Vietnam's increasing cross-border e-commerce activities and strengthening trade relationships with global partners. Major international players like DHL, FedEx, and UPS have expanded their operations in Vietnam, introducing new routes and enhanced services to meet the rising demand. The segment's expansion is further supported by strategic developments such as FedEx's launch of intercontinental services connecting Vietnam with Singapore and other key markets in Asia, the Middle East, Africa, and Europe. The implementation of various free trade agreements and the government's supportive policies for cross-border trade continue to create favorable conditions for international courier services.
Segment Analysis: By Speed of Delivery
Non-Express Segment in Vietnam CEP Market
The non-express segment dominates the Vietnam courier, express, and parcel (CEP) market, commanding approximately 74% market share in 2024. This segment's prominence is driven by cost-conscious customers who prioritize economical shipping options over speed. The segment benefits from strong partnerships between e-commerce platforms and logistics providers, with companies like Lazada partnering with multiple courier providers such as Flash Express, Ximex Delivery Express, and J&T Express for their standard delivery services. The growth in this segment is particularly notable in tier-2 and tier-3 cities where price sensitivity is higher. Major players like Vietnam Post and Viettel Post have extensively developed their non-express delivery networks across the country's 63 provinces, ensuring comprehensive coverage for regular delivery services.
Express Segment in Vietnam CEP Market
The express delivery segment is experiencing rapid growth in the Vietnam CEP market, projected to grow at approximately 9% annually from 2024 to 2029. This accelerated growth is driven by increasing demand for time-sensitive deliveries, particularly in urban areas like Hanoi and Ho Chi Minh City. The segment's expansion is supported by significant investments in infrastructure and technology, exemplified by Lazada Logistics Park's state-of-the-art sorting center in Bình D°¡ng province, capable of handling 1 million parcels daily. International players like FedEx have strengthened their express services by introducing dedicated B767 freighter flights operating four evenings weekly from Ho Chi Minh City. The development of automated sorting systems and the integration of AI-driven logistics solutions are further enhancing the efficiency and reliability of express delivery services across Vietnam.
Segment Analysis: By Model
Business-to-Consumer (B2C) Segment in Vietnam CEP Market
The Business-to-Consumer (B2C) segment dominates the Vietnam courier, express, and parcel market, commanding approximately 38% market share in 2024. This segment's prominence is primarily driven by the robust growth of e-commerce platforms like Shopee and Lazada, which hold significant positions as international e-marketplaces within Vietnam's e-commerce landscape. Local brands have also gained substantial traction, with Gioi Di Dong, focusing on consumer electronics and IT devices, generating significant revenue and positioning itself as Vietnam's largest e-commerce site. The B2C segment is experiencing the fastest growth trajectory among all segments, projected to grow at around 10% annually from 2024 to 2029, driven by aggressive government policies, increased middle-income groups, and a fast-growing internet economy. The segment's growth is further supported by major e-commerce players' investments in logistics infrastructure, with companies like Lazada operating their own logistics division (LEL Express) while maintaining partnerships with third-party courier providers such as Flash Express, Ximex Delivery Express, and J&T Express.
Remaining Segments in Model-Based CEP Market
The Business-to-Business (B2B) and Consumer-to-Consumer (C2C) segments complete the Vietnam CEP market landscape, each serving distinct market needs. The B2B segment facilitates business promotion for local companies and manufacturers, with platforms like Buy2Sell expanding to include domestic sellers and partnering with major logistics providers to streamline imports and exports. The C2C segment has been making significant strides in establishing dedicated logistics services, with major platforms like Lazada and Tiki developing their order fulfillment systems. This segment particularly benefits from the shift in consumer behavior toward buying and selling second-hand items, especially in categories like electronics, home goods, furniture, and motorcycles. Both segments are supported by the top three e-commerce platforms - Facebook, Shopee, and Lazada - which collectively facilitate B2B and C2C e-commerce transactions, while various players like Sen Do, Tiki, Vat Gia, and En Bac serve specific market niches.
Segment Analysis: By Shipment Weight
Segment Analysis: By Mode of Transport
Road Segment in Vietnam CEP Market
The road transport segment dominates the Vietnam courier, express, and parcel (CEP) market, accounting for approximately 80% of total logistics movement in 2024. Road network serves as the primary mode for parcel delivery in Vietnam, particularly concentrated in the Red River Delta and Southeast Vietnam regions including major cities like Hanoi and Ho Chi Minh City. The segment's strong performance is driven by extensive last-mile delivery networks, rising e-commerce volumes, and ongoing infrastructure development initiatives. The Vietnamese government has adopted an ambitious Road Network Development Plan aimed at expanding the expressway network to over 5,000 km by 2030. Major courier players leveraging road transport include Vietnam Post, Viettel Post, and Express Delivery Services Corporation. However, the segment faces challenges from high fuel costs, which account for about 40% of transportation expenses. To address sustainability concerns, several players like DHL have introduced electric vehicles for parcel deliveries since 2023, demonstrating the industry's commitment to reducing emissions while maintaining operational efficiency.
Other Modes of Transport in Vietnam CEP Market
Beyond road transport, the Vietnam CEP market utilizes air, railway, and waterway modes for parcel delivery services. Air transport plays a crucial role in international express deliveries and time-sensitive shipments, with major operators like DHL, FedEx, and Cathay Pacific Cargo dominating the air cargo segment. The segment benefits from ongoing airport infrastructure expansions, particularly at Hanoi and Ho Chi Minh City airports. The Long Thanh airport development is expected to significantly boost cargo handling capacity in the coming years. Railway and waterway modes, while currently having a smaller share, are being developed as alternative transport options to reduce dependence on road transport and optimize logistics costs. The government is actively promoting multimodal transport integration to enhance the efficiency of parcel delivery services across different regions of the country.
Segment Analysis: By End User Industry
Manufacturing Segment in Vietnam CEP Market
The manufacturing segment dominates the Vietnam courier, express, and parcel (CEP) market, accounting for approximately 33% market share in 2024. This significant market position is driven by Vietnam's emergence as a prominent manufacturing hub in Southeast Asia, attracting substantial foreign direct investments. Major manufacturing companies like Lego AS, which invested USD 1.3 billion, and Trina Solar with USD 275 million investment, have established operations in Vietnam, driving the demand for specialized same day delivery solutions. The segment requires both scheduled and same day delivery services for various purposes, including the collection and delivery of electronics, hardware components, and finished products to main facilities for processing. Leading CEP providers serving this segment include Deutsche Post DHL Group, Vietnam Post Corporation (VNPost), Viettel Post, and Two Four Seven Joint Stock Company (247Post), offering comprehensive logistics solutions tailored to manufacturing needs.
Healthcare Segment in Vietnam CEP Market
The healthcare segment is projected to be the fastest-growing segment in the Vietnam CEP market between 2024-2029. This growth is primarily driven by increasing healthcare spending, which is expected to reach USD 33.8 billion by 2030. The segment's expansion is further supported by Vietnam's active pursuit of foreign investors through attractive incentives, particularly in the pharmaceutical sector. The 2023 agreement between Vietnam and Europe, allowing European companies to establish wholly-owned pharmaceutical operations and import medicines, has created additional opportunities for specialized medical courier services. Major CEP players have developed dedicated healthcare logistics solutions, including temperature-controlled transportation and specialized handling for medical supplies. The segment requires specialized next day delivery solutions and overnight deliveries for various purposes, including the transportation of medicines, medical equipment, and healthcare supplies to hospitals, clinics, and healthcare facilities across the country.
Remaining Segments in End User Industry
The Vietnam CEP market encompasses several other significant end-user segments including e-commerce, financial services (BFSI), primary industry, wholesale and retail trade, and others. The e-commerce segment has emerged as a crucial driver of CEP services, supported by major platforms like Shopee, Lazada, and Tiki. The BFSI sector generates consistent demand through the transportation of financial documents, checks, and banking materials. The primary industry segment, comprising agriculture, fishing, forestry, and mining, requires specialized delivery solutions for samples and equipment. The wholesale and retail trade segment maintains steady demand through traditional retail distribution networks. Each of these segments contributes uniquely to the market's dynamics, requiring customized delivery solutions and specialized handling capabilities from CEP service providers.
Vietnam Courier, Express, and Parcel (CEP) Industry Overview
Top Companies in Vietnam Courier, Express, and Parcel Market
The leading companies in Vietnam's CEP market are demonstrating a strong commitment to innovation and operational excellence through various strategic initiatives. Companies are increasingly investing in automated sorting centers and AI-powered warehouses to enhance operational efficiency and reduce delivery times. The adoption of digital technologies for tracking, route optimization, and last-mile delivery has become a key focus area. Market players are expanding their presence through new service centers, delivery hubs, and cross-border capabilities, particularly in response to growing e-commerce demand. Strategic partnerships with e-commerce platforms and international logistics providers are becoming increasingly common to strengthen service offerings. Companies are also investing in sustainable delivery solutions, including electric vehicles and eco-friendly packaging, while developing specialized services for different industry verticals.
Market Dominated by Local and Global Players
The Vietnamese CEP market exhibits a consolidated structure with a mix of established local players and international logistics giants. Local companies like Vietnam Post Corporation (VNPost) and Viettel Post leverage their extensive domestic networks and market understanding, while global players such as DHL, FedEx, and UPS bring international expertise and advanced technological capabilities. The market demonstrates a clear hierarchy with the top five companies accounting for a significant market share, indicating high barriers to entry and strong competitive advantages for established players. The presence of both state-owned enterprises and private companies creates a dynamic competitive environment.
The market is characterized by ongoing consolidation through strategic partnerships and acquisitions, particularly in response to e-commerce growth. Companies are forming alliances to enhance their service capabilities and geographic reach, with a notable trend of cross-border partnerships to facilitate international trade. Local players are strengthening their position through modernization and service diversification, while international companies are deepening their local presence through infrastructure investments and partnerships with domestic firms. The competitive landscape is evolving with the entry of technology-driven logistics startups and e-commerce platforms developing their own logistics capabilities.
Innovation and Network Expansion Drive Success
Success in the Vietnamese CEP market increasingly depends on technological advancement and service differentiation. Companies must invest in automated sorting facilities, digital platforms, and advanced tracking systems to meet rising customer expectations for speed and reliability. Building strong partnerships with e-commerce platforms and developing specialized solutions for different industry segments are becoming crucial for market growth. The ability to offer integrated logistics services, including warehousing and fulfillment services, while maintaining cost efficiency through operational optimization, will be key to gaining market share.
Market players need to focus on expanding their delivery networks while maintaining service quality and reliability. This includes developing hub-and-spoke models, establishing strategic locations for sorting centers, and implementing efficient last-mile delivery solutions. Companies must also address environmental concerns through sustainable practices and green logistics solutions. The regulatory environment, particularly regarding cross-border trade and e-commerce logistics, will continue to shape competitive strategies. Success will depend on the ability to adapt to changing market dynamics, including shifts in consumer behavior and technological advancements, while maintaining operational efficiency and service quality.
Vietnam Courier, Express, and Parcel (CEP) Market Leaders
-
DHL Group
-
Giaohangtietkiem
-
J&T Express
-
Vietnam Posts and Telecommunications Group (including Vietnam Post Corporation)
-
ViettelPost
- *Disclaimer: Major Players sorted in no particular order
Market/1735909240478-VietnamCourier,Express,andParcel(CEP)Market-market-concentration.svg)
Need More Details on Market Players and Competitors?
Download PDF
Vietnam Courier, Express, and Parcel (CEP) Market News
- October 2024: UPS had enhanced its air network, enabling faster deliveries for customers across Asia, Africa, and the Middle East, covering over 35 countries. Customers from major Asia Pacific economies had enjoyed next-day delivery to Seoul, South Korea, and from Bangkok to various destinations in the region. In Vietnam, Ho Chi Minh City customers had benefited from next-day services to select regional cities. Shipments from Hanoi to certain Australian cities were completed in just two business days. Additionally, UPS had rolled out Saturday pick-ups in Hanoi for deliveries heading to Sydney, offering businesses more flexibility and accelerating their speed-to-market. Furthermore, deliveries from select Australian cities to Europe were made in as little as two business days.
- September 2024: DHL Express launched a new direct flight route from Hong Kong to Jakarta, Indonesia, enhancing its transit times. The dedicated flight, utilizing the B737-800 freighter, operated four times weekly. By flying directly from Hong Kong to Jakarta, this new service offered a non-stop alternative. The B737-800 freighter, boasting a 20-ton payload capacity, handled everything from e-commerce packages to larger consignments. It transports shipments originating from China, Hong Kong, Japan, Korea, Taiwan, the Philippines, and Vietnam via the Central Asia Hub in Hong Kong.
- September 2024: FedEx partnered with and invested in Nimble, an AI robotics and autonomous e-commerce fulfillment technology company, to scale FedEx Fulfillment with their fully autonomous 3PL model. FedEx offered a comprehensive approach to help e-commerce and omnichannel brands make faster, smarter supply chain decisions. With more than 130 warehouse and fulfillment operations in North America and 475 million returns processed annually, FedEx Supply Chain helped brands consolidate functions, increase agility, and accelerate click-to-door speed to maximize supply chain value.
Free With This Report
We provide a complimentary and exhaustive set of data points on global and regional metrics that present the fundamental structure of the industry. Presented in the form of 60+ free charts, the section covers difficult to find data on various regions pertaining to e-commerce industry trends, economic contribution of the transportation & storage sector, export-import trends, logistics performance among other key indicators.
-of-E-Commerce-Industry,-USD,-Global,-2017---2022.svg)
-of-E-Commerce-Industry,-North-America,-Value,-USD,-2017-2022.svg)
-of-E-Commerce-Industry,-Europe,-Value,-USD,-2017-2022.svg)
-of-E-Commerce-Industry,-Asia-Pacific,-Value,-USD,-2017-2022.svg)
,-Share---of-GDP,-Global,-2022.svg)


Vietnam Courier, Express, and Parcel (CEP) Market Report - Table of Contents
1. EXECUTIVE SUMMARY & KEY FINDINGS
2. REPORT OFFERS
3. INTRODUCTION
- 3.1 Study Assumptions & Market Definition
- 3.2 Scope of the Study
- 3.3 Research Methodology
4. KEY INDUSTRY TRENDS
- 4.1 Demographics
- 4.2 GDP Distribution By Economic Activity
- 4.3 GDP Growth By Economic Activity
- 4.4 Inflation
-
4.5 Economic Performance And Profile
- 4.5.1 Trends in E-Commerce Industry
- 4.5.2 Trends in Manufacturing Industry
- 4.6 Transport And Storage Sector GDP
- 4.7 Export Trends
- 4.8 Import Trends
- 4.9 Fuel Price
- 4.10 Logistics Performance
- 4.11 Infrastructure
-
4.12 Regulatory Framework
- 4.12.1 Vietnam
- 4.13 Value Chain & Distribution Channel Analysis
5. MARKET SEGMENTATION (includes Market Value in USD, Forecasts up to 2030 and analysis of growth prospects)
-
5.1 Destination
- 5.1.1 Domestic
- 5.1.2 International
-
5.2 Speed Of Delivery
- 5.2.1 Express
- 5.2.2 Non-Express
-
5.3 Model
- 5.3.1 Business-to-Business (B2B)
- 5.3.2 Business-to-Consumer (B2C)
- 5.3.3 Consumer-to-Consumer (C2C)
-
5.4 Shipment Weight
- 5.4.1 Heavy Weight Shipments
- 5.4.2 Light Weight Shipments
- 5.4.3 Medium Weight Shipments
-
5.5 Mode Of Transport
- 5.5.1 Air
- 5.5.2 Road
- 5.5.3 Others
-
5.6 End User Industry
- 5.6.1 E-Commerce
- 5.6.2 Financial Services (BFSI)
- 5.6.3 Healthcare
- 5.6.4 Manufacturing
- 5.6.5 Primary Industry
- 5.6.6 Wholesale and Retail Trade (Offline)
- 5.6.7 Others
6. COMPETITIVE LANDSCAPE
- 6.1 Key Strategic Moves
- 6.2 Market Share Analysis
- 6.3 Company Landscape
-
6.4 Company Profiles
- 6.4.1 247 Express
- 6.4.2 DHL Group
- 6.4.3 FedEx
- 6.4.4 Giao Hang Nhanh
- 6.4.5 Giaohangtietkiem
- 6.4.6 J&T Express
- 6.4.7 United Parcel Service of America, Inc. (UPS)
- 6.4.8 Vietnam Posts and Telecommunications Group (including Vietnam Post Corporation)
- 6.4.9 Vietstar Express
- 6.4.10 ViettelPost
- *List Not Exhaustive
7. KEY STRATEGIC QUESTIONS FOR CEP CEOS
8. APPENDIX
-
8.1 Global Overview
- 8.1.1 Overview
- 8.1.2 Porter’s Five Forces Framework
- 8.1.3 Global Value Chain Analysis
- 8.1.4 Market Dynamics (DROs)
- 8.1.5 Technological Advancements
- 8.2 Sources & References
- 8.3 List of Tables & Figures
- 8.4 Primary Insights
- 8.5 Data Pack
- 8.6 Glossary of Terms
You Can Purchase Parts Of This Report. Check Out Prices For Specific Sections
Get Price Break-up Now
List of Tables & Figures
- Figure 1:
- POPULATION DISTRIBUTION BY GENDER, COUNT, VIETNAM, 2017 - 2030
- Figure 2:
- POPULATION DISTRIBUTION BY DEVELOPMENT AREA, COUNT, VIETNAM, 2017 - 2030
- Figure 3:
- POPULATION DENSITY, POPULATION/SQ. KM, VIETNAM, 2017 - 2030
- Figure 4:
- GROSS DOMESTIC PRODUCT (GDP) SHARE OF FINAL CONSUMPTION EXPENDITURE (IN CURRENT PRICES), SHARE % OF GDP, VIETNAM, 2017 - 2022
- Figure 5:
- FINAL CONSUMPTION EXPENDITURE, ANNUAL GROWTH (%), VIETNAM, 2017 - 2022
- Figure 6:
- POPULATION DISTRIBUTION BY MAJOR CITY, COUNT, VIETNAM, 2022
- Figure 7:
- DISTRIBUTION OF GROSS DOMESTIC PRODUCT (GDP) BY ECONOMIC ACTIVITY, SHARE %, VIETNAM, 2022
- Figure 8:
- GROWTH OF GROSS DOMESTIC PRODUCT (GDP) BY ECONOMIC ACTIVITY, CAGR %, VIETNAM, 2017 – 2022
- Figure 9:
- WHOLESALE PRICE INFLATION RATE, %, VIETNAM, 2017 - 2022
- Figure 10:
- CONSUMER PRICE INFLATION RATE, %, VIETNAM, 2017 - 2022
- Figure 11:
- GROSS MERCHANDISE VALUE (GMV) OF E-COMMERCE INDUSTRY, USD, VIETNAM, 2017 - 2027
- Figure 12:
- SECTORAL SHARE IN E-COMMERCE INDUSTRY GROSS MERCHANDISE VALUE (GMV), SHARE %, VIETNAM, 2022
- Figure 13:
- GROSS VALUE ADDED (GVA) OF MANUFACTURING INDUSTRY (IN CURRENT PRICES), USD, VIETNAM, 2017 - 2022
- Figure 14:
- SECTORAL SHARE IN GROSS VALUE ADDED (GVA) OF MANUFACTURING INDUSTRY, SHARE %, VIETNAM, 2022
- Figure 15:
- VALUE OF TRANSPORT AND STORAGE SECTOR GROSS DOMESTIC PRODUCT (GDP), USD, VIETNAM, 2017 – 2022
- Figure 16:
- TRANSPORT AND STORAGE SECTOR GROSS DOMESTIC PRODUCT (GDP), SHARE % OF GDP, VIETNAM, 2022
- Figure 17:
- VALUE OF EXPORTS, USD, VIETNAM, 2017 - 2022
- Figure 18:
- VALUE OF IMPORTS, USD, VIETNAM, 2017 - 2022
- Figure 19:
- FUEL PRICE BY TYPE OF FUEL, USD/LITER, VIETNAM, 2017 - 2022
- Figure 20:
- RANK OF LOGISTICS PERFORMANCE, RANK, VIETNAM, 2010 - 2023
- Figure 21:
- LENGTH OF ROADS, KM, VIETNAM, 2017 - 2022
- Figure 22:
- SHARE OF ROAD LENGTH BY SURFACE CATEGORY, %, VIETNAM, 2022
- Figure 23:
- SHARE OF ROAD LENGTH BY ROAD CLASSIFICATION, %, VIETNAM, 2022
- Figure 24:
- RAIL LENGTH, KM, VIETNAM, 2017 - 2022
- Figure 25:
- CONTAINERS HANDLED AT MAJOR PORTS, TWENTY-FOOT EQUIVALENT UNITS (TEUS), VIETNAM, 2022
- Figure 26:
- CARGO WEIGHT HANDLED AT MAJOR AIRPORTS, TONS, VIETNAM, 2022
- Figure 27:
- VOLUME OF COURIER, EXPRESS, AND PARCEL (CEP) MARKET, NUMBER OF PARCELS, VIETNAM, 2017 - 2030
- Figure 28:
- VALUE OF COURIER, EXPRESS, AND PARCEL (CEP) MARKET, USD, VIETNAM, 2017 - 2030
- Figure 29:
- VOLUME OF COURIER, EXPRESS, AND PARCEL (CEP) MARKET BY DESTINATION, NUMBER OF PARCELS, VIETNAM 2017 - 2030
- Figure 30:
- VALUE OF COURIER, EXPRESS, AND PARCEL (CEP) MARKET BY DESTINATION, USD, VIETNAM 2017 - 2030
- Figure 31:
- VALUE SHARE OF COURIER, EXPRESS, AND PARCEL (CEP) MARKET BY DESTINATION, %, VIETNAM, 2017 - 2030
- Figure 32:
- VOLUME SHARE OF COURIER, EXPRESS, AND PARCEL (CEP) MARKET BY DESTINATION, %, VIETNAM, 2017 - 2030
- Figure 33:
- VOLUME OF DOMESTIC COURIER, EXPRESS, AND PARCEL (CEP) MARKET, NUMBER OF PARCELS, VIETNAM, 2017 - 2030
- Figure 34:
- VALUE OF DOMESTIC COURIER, EXPRESS, AND PARCEL (CEP) MARKET, USD, VIETNAM, 2017 - 2030
- Figure 35:
- VALUE SHARE OF DOMESTIC COURIER, EXPRESS, AND PARCEL (CEP) MARKET BY END USER INDUSTRY, %, VIETNAM, 2022 VS 2030
- Figure 36:
- VOLUME OF INTERNATIONAL COURIER, EXPRESS, AND PARCEL (CEP) MARKET, NUMBER OF PARCELS, VIETNAM, 2017 - 2030
- Figure 37:
- VALUE OF INTERNATIONAL COURIER, EXPRESS, AND PARCEL (CEP) MARKET, USD, VIETNAM, 2017 - 2030
- Figure 38:
- VALUE SHARE OF INTERNATIONAL COURIER, EXPRESS, AND PARCEL (CEP) MARKET BY END USER INDUSTRY, %, VIETNAM, 2022 VS 2030
- Figure 39:
- VOLUME OF COURIER, EXPRESS, AND PARCEL (CEP) MARKET BY SPEED OF DELIVERY, NUMBER OF PARCELS, VIETNAM 2017 - 2030
- Figure 40:
- VALUE OF COURIER, EXPRESS, AND PARCEL (CEP) MARKET BY SPEED OF DELIVERY, USD, VIETNAM 2017 - 2030
- Figure 41:
- VALUE SHARE OF COURIER, EXPRESS, AND PARCEL (CEP) MARKET BY SPEED OF DELIVERY, %, VIETNAM, 2017 - 2030
- Figure 42:
- VOLUME SHARE OF COURIER, EXPRESS, AND PARCEL (CEP) MARKET BY SPEED OF DELIVERY, %, VIETNAM, 2017 - 2030
- Figure 43:
- VOLUME OF EXPRESS COURIER, EXPRESS, AND PARCEL (CEP) MARKET, NUMBER OF PARCELS, VIETNAM, 2017 - 2030
- Figure 44:
- VALUE OF EXPRESS COURIER, EXPRESS, AND PARCEL (CEP) MARKET, USD, VIETNAM, 2017 - 2030
- Figure 45:
- VALUE SHARE OF EXPRESS COURIER, EXPRESS, AND PARCEL (CEP) MARKET BY END USER INDUSTRY, %, VIETNAM, 2022 VS 2030
- Figure 46:
- VOLUME OF NON-EXPRESS COURIER, EXPRESS, AND PARCEL (CEP) MARKET, NUMBER OF PARCELS, VIETNAM, 2017 - 2030
- Figure 47:
- VALUE OF NON-EXPRESS COURIER, EXPRESS, AND PARCEL (CEP) MARKET, USD, VIETNAM, 2017 - 2030
- Figure 48:
- VALUE SHARE OF NON-EXPRESS COURIER, EXPRESS, AND PARCEL (CEP) MARKET BY END USER INDUSTRY, %, VIETNAM, 2022 VS 2030
- Figure 49:
- VOLUME OF COURIER, EXPRESS, AND PARCEL (CEP) MARKET BY MODEL, NUMBER OF PARCELS, VIETNAM 2017 - 2030
- Figure 50:
- VALUE OF COURIER, EXPRESS, AND PARCEL (CEP) MARKET BY MODEL, USD, VIETNAM 2017 - 2030
- Figure 51:
- VALUE SHARE OF COURIER, EXPRESS, AND PARCEL (CEP) MARKET BY MODEL, %, VIETNAM, 2017 - 2030
- Figure 52:
- VOLUME SHARE OF COURIER, EXPRESS, AND PARCEL (CEP) MARKET BY MODEL, %, VIETNAM, 2017 - 2030
- Figure 53:
- VOLUME OF BUSINESS-TO-BUSINESS (B2B) COURIER, EXPRESS, AND PARCEL (CEP) MARKET, NUMBER OF PARCELS, VIETNAM, 2017 - 2030
- Figure 54:
- VALUE OF BUSINESS-TO-BUSINESS (B2B) COURIER, EXPRESS, AND PARCEL (CEP) MARKET, USD, VIETNAM, 2017 - 2030
- Figure 55:
- VALUE SHARE OF BUSINESS-TO-BUSINESS (B2B) COURIER, EXPRESS, AND PARCEL (CEP) MARKET BY END USER INDUSTRY, %, VIETNAM, 2022 VS 2030
- Figure 56:
- VOLUME OF BUSINESS-TO-CONSUMER (B2C) COURIER, EXPRESS, AND PARCEL (CEP) MARKET, NUMBER OF PARCELS, VIETNAM, 2017 - 2030
- Figure 57:
- VALUE OF BUSINESS-TO-CONSUMER (B2C) COURIER, EXPRESS, AND PARCEL (CEP) MARKET, USD, VIETNAM, 2017 - 2030
- Figure 58:
- VALUE SHARE OF BUSINESS-TO-CONSUMER (B2C) COURIER, EXPRESS, AND PARCEL (CEP) MARKET BY END USER INDUSTRY, %, VIETNAM, 2022 VS 2030
- Figure 59:
- VOLUME OF CONSUMER-TO-CONSUMER (C2C) COURIER, EXPRESS, AND PARCEL (CEP) MARKET, NUMBER OF PARCELS, VIETNAM, 2017 - 2030
- Figure 60:
- VALUE OF CONSUMER-TO-CONSUMER (C2C) COURIER, EXPRESS, AND PARCEL (CEP) MARKET, USD, VIETNAM, 2017 - 2030
- Figure 61:
- VALUE SHARE OF CONSUMER-TO-CONSUMER (C2C) COURIER, EXPRESS, AND PARCEL (CEP) MARKET BY END USER INDUSTRY, %, VIETNAM, 2022 VS 2030
- Figure 62:
- VOLUME OF COURIER, EXPRESS, AND PARCEL (CEP) MARKET BY SHIPMENT WEIGHT, NUMBER OF PARCELS, VIETNAM 2017 - 2030
- Figure 63:
- VALUE OF COURIER, EXPRESS, AND PARCEL (CEP) MARKET BY SHIPMENT WEIGHT, USD, VIETNAM 2017 - 2030
- Figure 64:
- VALUE SHARE OF COURIER, EXPRESS, AND PARCEL (CEP) MARKET BY SHIPMENT WEIGHT, %, VIETNAM, 2017 - 2030
- Figure 65:
- VOLUME SHARE OF COURIER, EXPRESS, AND PARCEL (CEP) MARKET BY SHIPMENT WEIGHT, %, VIETNAM, 2017 - 2030
- Figure 66:
- VOLUME OF HEAVY WEIGHT SHIPMENTS COURIER, EXPRESS, AND PARCEL (CEP) MARKET, NUMBER OF PARCELS, VIETNAM, 2017 - 2030
- Figure 67:
- VALUE OF HEAVY WEIGHT SHIPMENTS COURIER, EXPRESS, AND PARCEL (CEP) MARKET, USD, VIETNAM, 2017 - 2030
- Figure 68:
- VALUE SHARE OF HEAVY WEIGHT SHIPMENTS COURIER, EXPRESS, AND PARCEL (CEP) MARKET BY END USER INDUSTRY, %, VIETNAM, 2022 VS 2030
- Figure 69:
- VOLUME OF LIGHT WEIGHT SHIPMENTS COURIER, EXPRESS, AND PARCEL (CEP) MARKET, NUMBER OF PARCELS, VIETNAM, 2017 - 2030
- Figure 70:
- VALUE OF LIGHT WEIGHT SHIPMENTS COURIER, EXPRESS, AND PARCEL (CEP) MARKET, USD, VIETNAM, 2017 - 2030
- Figure 71:
- VALUE SHARE OF LIGHT WEIGHT SHIPMENTS COURIER, EXPRESS, AND PARCEL (CEP) MARKET BY END USER INDUSTRY, %, VIETNAM, 2022 VS 2030
- Figure 72:
- VOLUME OF MEDIUM WEIGHT SHIPMENTS COURIER, EXPRESS, AND PARCEL (CEP) MARKET, NUMBER OF PARCELS, VIETNAM, 2017 - 2030
- Figure 73:
- VALUE OF MEDIUM WEIGHT SHIPMENTS COURIER, EXPRESS, AND PARCEL (CEP) MARKET, USD, VIETNAM, 2017 - 2030
- Figure 74:
- VALUE SHARE OF MEDIUM WEIGHT SHIPMENTS COURIER, EXPRESS, AND PARCEL (CEP) MARKET BY END USER INDUSTRY, %, VIETNAM, 2022 VS 2030
- Figure 75:
- VOLUME OF COURIER, EXPRESS, AND PARCEL (CEP) MARKET BY MODE OF TRANSPORT, NUMBER OF PARCELS, VIETNAM 2017 - 2030
- Figure 76:
- VALUE OF COURIER, EXPRESS, AND PARCEL (CEP) MARKET BY MODE OF TRANSPORT, USD, VIETNAM 2017 - 2030
- Figure 77:
- VALUE SHARE OF COURIER, EXPRESS, AND PARCEL (CEP) MARKET BY MODE OF TRANSPORT, %, VIETNAM, 2017 - 2030
- Figure 78:
- VOLUME SHARE OF COURIER, EXPRESS, AND PARCEL (CEP) MARKET BY MODE OF TRANSPORT, %, VIETNAM, 2017 - 2030
- Figure 79:
- VOLUME OF AIR COURIER, EXPRESS, AND PARCEL (CEP) MARKET, NUMBER OF PARCELS, VIETNAM, 2017 - 2030
- Figure 80:
- VALUE OF AIR COURIER, EXPRESS, AND PARCEL (CEP) MARKET, USD, VIETNAM, 2017 - 2030
- Figure 81:
- VALUE SHARE OF AIR COURIER, EXPRESS, AND PARCEL (CEP) MARKET BY END USER INDUSTRY, %, VIETNAM, 2022 VS 2030
- Figure 82:
- VOLUME OF ROAD COURIER, EXPRESS, AND PARCEL (CEP) MARKET, NUMBER OF PARCELS, VIETNAM, 2017 - 2030
- Figure 83:
- VALUE OF ROAD COURIER, EXPRESS, AND PARCEL (CEP) MARKET, USD, VIETNAM, 2017 - 2030
- Figure 84:
- VALUE SHARE OF ROAD COURIER, EXPRESS, AND PARCEL (CEP) MARKET BY END USER INDUSTRY, %, VIETNAM, 2022 VS 2030
- Figure 85:
- VOLUME OF OTHERS COURIER, EXPRESS, AND PARCEL (CEP) MARKET, NUMBER OF PARCELS, VIETNAM, 2017 - 2030
- Figure 86:
- VALUE OF OTHERS COURIER, EXPRESS, AND PARCEL (CEP) MARKET, USD, VIETNAM, 2017 - 2030
- Figure 87:
- VALUE SHARE OF OTHERS COURIER, EXPRESS, AND PARCEL (CEP) MARKET BY END USER INDUSTRY, %, VIETNAM, 2022 VS 2030
- Figure 88:
- VOLUME OF COURIER, EXPRESS, AND PARCEL (CEP) MARKET BY END USER INDUSTRY, NUMBER OF PARCELS, VIETNAM 2017 - 2030
- Figure 89:
- VALUE OF COURIER, EXPRESS, AND PARCEL (CEP) MARKET BY END USER INDUSTRY, USD, VIETNAM 2017 - 2030
- Figure 90:
- VALUE SHARE OF COURIER, EXPRESS, AND PARCEL (CEP) MARKET BY END USER INDUSTRY, %, VIETNAM, 2017 - 2030
- Figure 91:
- VOLUME SHARE OF COURIER, EXPRESS, AND PARCEL (CEP) MARKET BY END USER INDUSTRY, %, VIETNAM, 2017 - 2030
- Figure 92:
- VOLUME OF E-COMMERCE COURIER, EXPRESS, AND PARCEL (CEP) MARKET, NUMBER OF PARCELS, VIETNAM, 2017 - 2030
- Figure 93:
- VALUE OF E-COMMERCE COURIER, EXPRESS, AND PARCEL (CEP) MARKET, USD, VIETNAM, 2017 - 2030
- Figure 94:
- VALUE SHARE OF E-COMMERCE COURIER, EXPRESS, AND PARCEL (CEP) MARKET BY DESTINATION, %, VIETNAM, 2022 VS 2030
- Figure 95:
- VOLUME OF FINANCIAL SERVICES (BFSI) COURIER, EXPRESS, AND PARCEL (CEP) MARKET, NUMBER OF PARCELS, VIETNAM, 2017 - 2030
- Figure 96:
- VALUE OF FINANCIAL SERVICES (BFSI) COURIER, EXPRESS, AND PARCEL (CEP) MARKET, USD, VIETNAM, 2017 - 2030
- Figure 97:
- VALUE SHARE OF FINANCIAL SERVICES (BFSI) COURIER, EXPRESS, AND PARCEL (CEP) MARKET BY DESTINATION, %, VIETNAM, 2022 VS 2030
- Figure 98:
- VOLUME OF HEALTHCARE COURIER, EXPRESS, AND PARCEL (CEP) MARKET, NUMBER OF PARCELS, VIETNAM, 2017 - 2030
- Figure 99:
- VALUE OF HEALTHCARE COURIER, EXPRESS, AND PARCEL (CEP) MARKET, USD, VIETNAM, 2017 - 2030
- Figure 100:
- VALUE SHARE OF HEALTHCARE COURIER, EXPRESS, AND PARCEL (CEP) MARKET BY DESTINATION, %, VIETNAM, 2022 VS 2030
- Figure 101:
- VOLUME OF MANUFACTURING COURIER, EXPRESS, AND PARCEL (CEP) MARKET, NUMBER OF PARCELS, VIETNAM, 2017 - 2030
- Figure 102:
- VALUE OF MANUFACTURING COURIER, EXPRESS, AND PARCEL (CEP) MARKET, USD, VIETNAM, 2017 - 2030
- Figure 103:
- VALUE SHARE OF MANUFACTURING COURIER, EXPRESS, AND PARCEL (CEP) MARKET BY DESTINATION, %, VIETNAM, 2022 VS 2030
- Figure 104:
- VOLUME OF PRIMARY INDUSTRY COURIER, EXPRESS, AND PARCEL (CEP) MARKET, NUMBER OF PARCELS, VIETNAM, 2017 - 2030
- Figure 105:
- VALUE OF PRIMARY INDUSTRY COURIER, EXPRESS, AND PARCEL (CEP) MARKET, USD, VIETNAM, 2017 - 2030
- Figure 106:
- VALUE SHARE OF PRIMARY INDUSTRY COURIER, EXPRESS, AND PARCEL (CEP) MARKET BY DESTINATION, %, VIETNAM, 2022 VS 2030
- Figure 107:
- VOLUME OF WHOLESALE AND RETAIL TRADE (OFFLINE) COURIER, EXPRESS, AND PARCEL (CEP) MARKET, NUMBER OF PARCELS, VIETNAM, 2017 - 2030
- Figure 108:
- VALUE OF WHOLESALE AND RETAIL TRADE (OFFLINE) COURIER, EXPRESS, AND PARCEL (CEP) MARKET, USD, VIETNAM, 2017 - 2030
- Figure 109:
- VALUE SHARE OF WHOLESALE AND RETAIL TRADE (OFFLINE) COURIER, EXPRESS, AND PARCEL (CEP) MARKET BY DESTINATION, %, VIETNAM, 2022 VS 2030
- Figure 110:
- VOLUME OF OTHERS COURIER, EXPRESS, AND PARCEL (CEP) MARKET, NUMBER OF PARCELS, VIETNAM, 2017 - 2030
- Figure 111:
- VALUE OF OTHERS COURIER, EXPRESS, AND PARCEL (CEP) MARKET, USD, VIETNAM, 2017 - 2030
- Figure 112:
- VALUE SHARE OF OTHERS COURIER, EXPRESS, AND PARCEL (CEP) MARKET BY DESTINATION, %, VIETNAM, 2022 VS 2030
- Figure 113:
- MOST ACTIVE COMPANIES BY NUMBER OF STRATEGIC MOVES, COUNT, VIETNAM, 2017 - 2023
- Figure 114:
- MOST ADOPTED STRATEGIES, COUNT, VIETNAM, 2017 - 2023
- Figure 115:
- VALUE SHARE OF MAJOR PLAYERS, %, VIETNAM
Vietnam Courier, Express, and Parcel (CEP) Industry Segmentation
Domestic, International are covered as segments by Destination. Express, Non-Express are covered as segments by Speed Of Delivery. Business-to-Business (B2B), Business-to-Consumer (B2C), Consumer-to-Consumer (C2C) are covered as segments by Model. Heavy Weight Shipments, Light Weight Shipments, Medium Weight Shipments are covered as segments by Shipment Weight. Air, Road, Others are covered as segments by Mode Of Transport. E-Commerce, Financial Services (BFSI), Healthcare, Manufacturing, Primary Industry, Wholesale and Retail Trade (Offline), Others are covered as segments by End User Industry.| Destination | Domestic |
| International | |
| Speed Of Delivery | Express |
| Non-Express | |
| Model | Business-to-Business (B2B) |
| Business-to-Consumer (B2C) | |
| Consumer-to-Consumer (C2C) | |
| Shipment Weight | Heavy Weight Shipments |
| Light Weight Shipments | |
| Medium Weight Shipments | |
| Mode Of Transport | Air |
| Road | |
| Others | |
| End User Industry | E-Commerce |
| Financial Services (BFSI) | |
| Healthcare | |
| Manufacturing | |
| Primary Industry | |
| Wholesale and Retail Trade (Offline) | |
| Others |
Need A Different Region or Segment?
Customize Now
Market Definition
- Courier, Express, and Parcel - The Courier, Express, and Parcel services, often called as CEP Market, refers to the logistics and postal service providers which specialize in moving small goods (parcels/packages). It captures the overall market size (USD) and market volume (number of parcels) of (1) the shipments/parcels/packages which are under 70kgs/ 154lbs weight, (2) Business Customer packages viz. Business-to-Business (B2B) & Business-to-Consumer (B2C) as well as private customer packages (C2C), (3) non-express parcel delivery services (Standard and Deferred) as well as express parcel delivery services (Day-Definite-Express and Time-Definite-Express), (4) domestic as well as international shipments.
- Demographics - To analyse total addressable market demand, population growth & forecasts have been studied and presented in this industry trend. It represents population distribution across categories like gender (male/female), development area (urban/rural), major cities among other key parameters like population density and final consumption expenditure (growth and share % of GDP). This data has been used for assessing the fluctations in demand & consumption expenditure, and the major hotspots (cities) of potential demand.
- Domestic Courier Market - Domestic Courier Market refers to the CEP shipments wherein the origin and destination is within the boundary of the geography studied (country or region as per the scope of report). It captures the market size (USD) and market volume (number of parcels) of (1) the shipments/parcels/packages which are under 70kgs/ 154lbs weight, including light weight shipments, medium weight shipments and heavy weight shipments (2) Business Customer packages viz. Business-to-Business (B2B) & Business-to-Consumer (B2C) as well as private customer packages (C2C), (3) non-express parcel delivery services (Standard and Deferred) as well as express parcel delivery services (Day-Definite-Express and Time-Definite-Express).
- E-Commerce - This end user industry segment captures the external (outsourced) logistics expenditure incurred by the e-tailers, through online sales channel, on Courier, Express, and Parcel (CEP) services. The scope includes (i) the supply chain of a company's online customer orders being fulfilled, (ii) the process of getting a product from the point of manufacturing to the point at which it is delivered to consumers. It involves managing inventory (deferred as well as time critical), shipping, and distribution.
- Export Trends and Import Trends - Overall logistics performance of an economy is positively and significantly (statistically) correlated to its trade performance (exports and imports). Hence, in this industry trend, total value of trade, major commodities/ commodity groups and the major trade partners, for the studied geography (country or region as per the scope of report) have been analysed alongside the impact of major trade/logistics infrastructure investments & regulatory environment.
- Financial Services (BFSI) - This end user industry segment captures the external (outsourced) logistics expenditure incurred by the BFSI players, on Courier, Express, and Parcel (CEP) services. CEP is important to the financial services industry in shipping of confidential documents and files. The establishments in this sector are engaged in (i) financial transactions (that is, transactions involving the creation, liquidation, or change in ownership of financial assets) or in facilitating financial transactions, (ii) financial intermediation, (iii) the pooling of risk by underwriting annuities and insurance, (iv) providing specialized services that facilitate or support financial intermediation, insurance and employee benefit programs, and (v) monetary control - the monetary authorities.
- Fuel Price - Fuel price spikes can cause delays and diruption for logistics service providers (LSPs), while drops in the same can result in higher short-term profitability and increased market rivalry to offer consumers with the best deals. Hence, the fuel price variations have been studied over the review period and presented along with the causes as well as market impacts.
- GDP Distribution by Economic Activity - Nominal Gross Domestic Product and distribution of the same, across major economic sectors in the geography studied (country or region as per scope of the report) have been studied and presented in this industry trend. As GDP is positively related to the profitability and growth of logistics industry, this data has been used in adjunction to the input-output tables/ supply-use tables for analyzing the potential major contributing sectors towards the logistics demand.
- GDP Growth by Economic Activity - Growth of Nominal Gross Domestic Product across major economic sectors, for the geography studied (country or region as per scope of the report) have been presented in this industry trend. This data has been utilized for assessing the growth of logistics demand from all the market end users (economic sectors considered here).
- Healthcare - This end user industry segment captures the external (outsourced) logistics expenditure incurred by the Healthcare players (Hospitals, clinics, mrdical centres) , on Courier, Express, and Parcel (CEP) services. The scope includes CEP services involved in the defrerred as well time critical movement of medical goods & supplies (surgical supplies and instruments, including gloves, masks, syringes, equipment). The establishments in this sector (i) include the ones providing medical care exclusively (ii) deliver services by trained professionals (iii) involve processes, including labor inputs of health practitioners with the requisite expertise (iv) are defined based on the educational degree held by the practitioners included in the industry.
- Inflation - Variations in both Wholesale Price Inflation (YoY change in producer price index) and Consumer Price Inflation have been presented in this industry trend. This data has been used to assess the inflationary environment as it plays a vital role in smooth functioning of the supply chain, directly impacting the logistics operational cost components e.g., pricing of tyres, driver wages & benefits, energy/fuel prices, maintenace costs, toll charges, warehousing rents, custom brokerage, forwarding rates, courier rates etc. hence impacting the overall freight and logistics market.
- Infrastructure - As infrastructure plays a vital role in an economy's logistics performance, variables like length of roads, distribution of road length by surface category (paved v/s unpaved), distribution of road length by road classification (expressways v/s highways v/s other roads), rail length, volume of containers handled by major ports and tonnage handled by major airports have been analysed and presented in this industry trend.
- International Express Service Market - International Express Service Market refers to the CEP shipments wherein the origin or destination is not within the boundary of the geography studied (country or region as per the scope of report). It captures the market size (USD) and market volume (number of parcels) of (1) the shipments/parcels/packages which are under 70kgs/ 154lbs weight, including light weight shipments, medium weight shipments and heavy weight shipments (ii) Inter-Region as well as Intra-Region Shipments
- Key Industry Trends - The report section named "Key Industry Trends" include all the key variables/parameters studied to better analyze the market size estimates and forecasts. All the trends have been presented in the form of data points (time series or latest available data points) along with analysis of the paramter in the form of concise market relevant commentary, for the geography studied (country or region as per the scope of report).
- Key Strategic Moves - The action taken by a company to differentiate from its competitor or used as a general strategy is referred to as a key strategic move (KSM). This includes (1) Agreements (2) Expansions (3) Financial Restructuring (4) Mergers and Acquisitions (5) Partnerships, and (6) Product Innovations. Key players (Logistics Service Providers, LSPs) in the market have been shortlisted, their KSM have been studied and presented in this section.
- Logistics Performance - Logistics Performance and Logistics Costs are the backbone of trade, and influences trade costs, making countries compete globally. Logistics performance is influenced by market wide adopted supply chain management strategies, government services, investments & policies, fuel/ energy costs, inflationary environment etc. Hence, in this industry trend, the logistics performance of the geography studied (country/ region as per the scope of report) has been analysed and presented over the review period.
- Manufacturing - This end user industry segment captures the external (outsourced) logistics expenditure incurred by the Manufacturing industry (including Hi-Tech/Technology) players, on Courier, Express, and Parcel (CEP) services. The end user players considered are the establishments primarily engaged in the chemical, mechanical or physical transformation of materials or substances into new products. Logistics Service Providers (LSPs) play a crucial role in maintaining a smooth flow of raw materials across the supply chain, enabling timely delivery of finished goods to distributors or end customers and storing & supplying the raw materials to clients for just-in-time manufacturing.
- Other End Users - Other end user segment captures the external (outsourced) logistics expenditure incurred by the construction, real estate, educational services, and professional services (administrative, waste management, legal, architectural, engineering, design, consulting, scientific R&D), on Courier, Express, and Parcel (CEP) services. Logistics Service Providers (LSPs) plays a crucial role in the reliable movement of time critical supplies and documents to/from these industries such as transporting any equipment or resources required, shipping confidential documents and files.
- Primary Industry - This end user industry segment captures the external (outsourced) logistics expenditure incurred by the AFF (Agriculture, Fishing, and Forestry) and Extraction indsutry (Oil &Gas, Quarrying and Mining) players, on Courier, Express, and Parcel (CEP) services. The end user players considered are the establishments (i) primarily engaged in growing crops, raising animals, harvesting timber, harvesting fish & other animals from their natural habitats and providing related support activities; (ii) that extract naturally occurring mineral solids, such as coal and ores; liquid minerals, such as crude petroleum; and gases, such as natural gas. Herein, Logistics Service Providers (LSPs) (i) play a crucial role in acquisition, storage, handling, transportation, and distribution activities for the optimal & continuous flow of inputs (seeds, pesticides, fertilizers, equipment, and water) from manufacturers or suppliers to the producers and smooth flow of output (produce, agro-goods) to distributors/ consumers; (ii) cover entire phases from upstream to downstream and play a crucial role in the transportation of machinery, drilling equipments, extracted minerals, crude oil & natural gas and refined/ processed products from one place to another. This includes both termperature controlled and non-temperature controlled logistics, as and when required according to the shelf life of goods being transported or stored.
- Producer Price Inflation - It indicates inflation from viewpoint of the producers viz. the average selling price received for their output over a period of time. Annual change (YoY) of producer price index is reported as wholesale price inflation in the "Inflation" industry trend. As WPI captures dynamic price movements in most comprehensive way, it is widely used by governments, banks, industry, business circles and is deemed important in formulation of trade, fiscal and other economic policies. The data has been used in adjunction to consumer price inflation for better understanding the inflationary environment.
- Segmental Revenue - Segmental Revenue has been triangulated or computed and presented for all the major players in the market. It refers to the courier, express, and parcel (CEP) market specific revenue earned by the company, over the base year of study, in the geography studied (country or region as per the scope of report). It is computed through the study and analysis of major parameters like financials, service portfolio, employee strength, fleet size, investments, number of countries present in, major economies of concern, etc. that have been reported by the company in its annual reports, webpage. For companies having scarce financial disclosures, paid databases like D&B Hoovers, Dow Jones Factiva have been resorted to and verified through industry/expert interactions.
- Transport and Storage Sector GDP - Value and growth of Transport and Storage Sector GDP has a direct relation to the freight and logistics market size. Hence, this variable has been studied and presented over the review period, in value terms (USD) and as share % of total GDP, in this industry trend. The data has been supported by concise and relevant commentary around the investments, developments, and current market scenario.
- Trends in E-Commerce Industry - Enhanced internet connectivity and boom in smartphone penetration, coupled with increasing disposable incomes, has led to a phenomenal growth in the e-commerce market globally. Online shoppers require fast and efficient delivery of their orders leading to an increase in the demand for logistics services especially e-commerce fulfilment services. Hence, the Gross Merchandise Value (GMV), historial and projected growth, breakup of major commodity groups in e-commerce industry for the studied geography (country or region as per scope of the report) have been analysed and presented in this industry trend.
- Trends in Manufacturing Industry - Manufacturing industry involves the transformation of raw materials into finished products, while logistics industry ensures the efficient flow of raw materials to the factory, and the transport of manufactured products to the distributors & consumers. Demand-Supply of both industries are highly cross-linked and critical for a seamless supply chain. Hence, the Gross Value Added (GVA), breakup of GVA into major manufacturing sectors, and growth of manufacturing industry over the review period have been analysed and presented, in this industry trend.
- Wholesale and Retail Trade (Offline) - This end user industry segment captures the external (outsourced) logistics expenditure incurred by the wholesalers and retailers, through offline sales channel, on Courier, Express, and Parcel (CEP) services. The end user players considered are the establishments primarily engaged in wholesaling or retailing merchandise, generally without transformation, and rendering services incidental to the sale of merchandise. Logistics Service Providers (LSPs) plays a crucial role in the reliable movement of supplies to and finished products from production houses to the distributors and finally to the end customer covering activites like material sourcing, transportation, order fulfillment, warehousing & storage, demand forecasting, inventory management etc.
| Keyword | Definition |
|---|---|
| Axle Load | The axle load refers to the total load (weight) bearing on the roadway through wheels connected to a given axle. Across the globe, there are systems in place to ensure axle load monitoring, wherein surpassing the defined limits set by the concerned regulatory authority can lead to penalty/fine. For transportation of goods via road this can be an important determinant of costs as knowledge about the axle load limits can be used to (i) load the vehicle optimally for maximizing profits (ii) avoid exceeding the same and hence the probable fines associated (iii) avoid wear and tear of the vehicle (iv) avoid damage to pavement resulting in noticeable public maintenance and repair costs (v) achieve better turnaround time. |
| Back Haul | Backhaul is the return movement of a transport vehicle from its original destination to its original point of departure, and can include full, partial, or empty truck loads (all or part of the way) depending on the visibility of the local freight ecosystem. In this regard, transportation of empty containers to the point of origin, known as deadheading is also a significant factor, considering the supply/container shortages across the geographies, resulting in cost escalation and under optimized profit potential attainment. Generally, the carriers offer discounts on the backhaul, to secure freight for the trip. |
| Bill of Lading (BOL) | A bill of lading is a legal contract document issued by a carrier to a shipper to acknowledge reception of their cargo, and is evidence for the contract of carriage between the two parties. Broadly it details the (i) type, quantity, and other specifications of the goods being carried (ii) destination, and terms & conditions of the shipment (iii) carrier and drivers with all the necessary information to process the shipment, which can be used for insurance and customs clearance purposes (iv) assurance that the consignment is damage-free and ready to be shipped to the consignee. In this regard, a house bill of lading (HBL) is a document issued by a freight forwarder or a non-vessel operating common carrier (NVOCC) to acknowledge receipt of items for shipment (to a shipper). If shipments from several shippers are involved a master bill of lading (MBL) might be involved which is a consolidated version of the same for all the shipments being taken care of by the carrier (to a common destination) and might be issued by the carrier to the freight forwarder or the shipper (depending on who books the transport). |
| Bunkering | Bunkering is the process of supplying fuel to power the propulsion system of a ship. It includes the logistics of loading and distributing the fuel among available shipboard tanks. In this regard, (i) Bunker fuel is technically any type of fuel oil used aboard ships. It gets its name from the containers on ships and in ports that it is stored in; in the days of steam they were coal bunkers but now they are bunker-fuel tanks, (ii) Bunker refers to the spaces (Tank) on board a vessel to store fuel, (iii) Bunker trader refers to a person dealing in trade of bunker (fuel), (iv) Bunker call is made when a cargo ship anchors or berths in a port to take on bunker oil or supplies, (v) Bunkering service is the supply of a requested quality and quantity of bunkers to a ship. Bunkering is signficant from point of view of freight rates applicable to the shipper as Bunker Contribution (BUC)/ Fuel Adjustment Factor (FAF)/ Bunker Adjustment Factor (BAF) are applied by shipping lines to offset the effect of fluctuations in the cost of bunkers. |
| Cabotage | Transport by a vehicle registered in a country, performed on the national territory of another country. Cabotage law may restrict domestic cargo traffic to be carried in its own nationally registered, and sometimes built and crewed vehicles, though regulations vary across industries/commodity groups/countries and sometimes specify maximum allowable percentage of cabotage that can be serviced by foreign registered fleet. |
| C-commerce | Collaborative commerce (also known as C-commerce), (i) describes electronically enabled business interactions among an enterprise’s internal personnel, business partners and customers throughout a trading community (industry, industry segment, supply chain or supply chain segment); (ii) is the optimization of supply and distribution channels to capitalize on the global economy by using new technology efficiently. Advantages of C-commerce, to detail few include (i) maximization of organization's efficiency and profitability (ii) technology integration with physical channels to allow companies to work together (iii) increased information exchange such as inventory and product specifications, using the web as an intermediary (iv) increased competitiveness by reaching a broader audience. Examples of C-commerce, also known as peer-to-peer commerce, include (i) companies that allow consumers to rent things from each other, or marketplaces, such as Meta (formerly Facebook) Marketplace, that allow the sale of used goods; (ii) DoorDash teamed up with many national brands, such as McDonald’s and Chipotle, to offer fast food delivery, building their business model on c-commerce. They have since expanded their delivery service from restaurants to retailers and even offer 'fleets' of drivers to businesses. |
| Courier | A business/company that delivers packages/parcels/shipments (upto 70 kgs) including quick door to door pickup and delivery service for goods or documents, domestically or internationally, on a commercial contract basis. Example, DHL Group, FedEx, United Parcel Service of America, Inc., USPS, International Distributions Services, J&T Express, SF Express among several others |
| Cross docking | Cross docking is a practice in logistics management that includes unloading incoming delivery vehicles and loading the materials directly into outbound delivery vehicles, omitting traditional warehouse logistical practices and saving time and money. It requires close synchronization of both inbound and outbound movements. It is highly significant in reduction of costs pertaining to warehousing & storage (and the associated Value Added Services). |
| Cross Trade | International transport between two different countries performed by a vehicle registered in a third country. A third country is a country other than the country of loading/embarkation and the country of unloading/disembarkation. Cross Trade law may restrict international cargo traffic to be carried by respective country's registered vehicles, and sometimes built and crewed vehicles, though regulations vary across industries/commodity groups/countries and sometimes specify maximum allowable percentage of cross trade that can be serviced by foreign registered fleet. |
| Customs Clearance | The process of declaring and clearing cargoes through customs. It includes the procedures involved in getting cargo released by Customs through designated formalities such as presenting import license/permit, payment of import duties and other required documentations by the nature of the cargo. In this regard, a customs broker is a person or company licensed by the respective department of the country to act on behalf of freight importers and exporters. |
| Dangerous Goods | Dangerous goods (or hazardous materials or HAZMAT) include flammable liquids/solids, gases (compressed, liquified, dissolved under pressure), corrosives, oxidising substances, explosive substances and articles, substances which on contact with water emit flammable gasses, organic peroxides, toxic substances, infectious substances, radioactive materials, miscellaneous dangerous goods and articles. |
| First mile Delivery | First mile delivery refers to the (i) first stage of the freight/shipment/cargo/courier transportation (ii) the transportation of goods from a merchant’s premises or warehouse to the next fulfillment centre/warehouse/hub from where the goods are forwarded (iii) shipping goods from local distribution centers to stores (For retailers) (iv) transportation of finished goods from a plant or a factory to a distribution center (For manufacturers), (v) pick up of goods from the end-customer’s home or store followed by movement to a warehouse or storage location (movers and packers), (vi) process where goods are picked up from a retailer and then transferred to third-party logistics providers or courier service providers to be delivered to the end-consumer (e-commerce). Once the package reaches the next warehouse or the courier’s hub, it is then sorted and transported further until it reaches the customer’s doorstep. Example, if one chooses UPS as a courier, first-mile delivery will be the product being delivered from manufacturer's/retailer's warehouse to the UPS’s warehouse/ fulfilment centre. |
| Last Mile Delivery | Last mile delivery refers to the very last step of the delivery process when a parcel is moved from a transportation hub (warehouse or a distribution center or fulfillment centre) to its final destination, which usually is a personal residence/retail store/ business, or parcel locker. It accounts for around half of the total cost involved in entire process of first mile, middle mile, and last mile delivery, though it can vary shipment to shipment, based on commodity, business model and similar factors. |
| Milkrun | A Milk Run is a delivery method used to transport mixed loads from various suppliers to one customer, using lean management principles applied to logistics. Instead of each supplier sending a truck every week to meet the needs of one customer, one truck (or vehicle) visits the suppliers to pick up the loads for that customer. This method of transport got its name from the dairy industry practice, where one tanker used to collect milk from several dairy farms for delivery to a milk processing company. A milk run can be a more efficient way to handle logistics but require proper planning. If the route involves products from different companies, there is need for an agreement about cost-sharing and other aspects of the cooperative delivery arrangement. Once the group settles these issues, this delivery method can save time and money for everyone by pooling operation costs and resources. |
| Multi country consolidation | Multi-Country Consolidation (MCC) is a cost-effective solution that consolidates one's cargo from different countries of origin to build Full Container Loads (FCL). MCC is most suitable for companies that import light volumes of goods from multiple countries but want to take advantage of the more economic FCL freight rates. Apart from costing some of the other advantages include (i) flexibility to choose suppliers from a wider range of origin countries without worrying about the logistics to final destination from each origin, (ii) ability to pick the most suitable suppliers from many different countries for one's business operations. The increase in one's sourcing options by MCC provides the kind of flexibility needed in competitive global markets. |
| Q-commerce | Q-commerce, also referred to as quick commerce, is a type of e-commerce where emphasis is on quick deliveries, typically in less than an hour. The companies providing Q-Commerce services might have vertically intergrated model or might be using third party delivery platforms (outsourced logistics). It has advantages like (i) competitve USP, (ii) potential to earn greater profit margins, (iii) better customer experience, (iv) guaranteed availability of products, (v) traceability, and (vi) scaleability. |
| ReverseLogistics | Reverse logistics is a type of supply chain management that moves goods from customers back to the sellers or manufacturers and may involve ciruclar economy principles (3Rs) viz. recycling, reuse (repurposing, reselling), reducing or repairing. In this regard, reverse commerce (or Recommerce) is the selling of previously owned items through physical or online marketplaces/distribution channels to buyers who reuse, recycle or resell them. |
Need More Details on Market Definition?
Ask a Question
Research Methodology
Mordor Intelligence follows a four-step methodology in all our reports.
- Step-1: Identify Key Variables: In order to build a robust forecasting methodology, the variables and factors identified in Step-1 are tested against available historical market numbers. Through an iterative process, the variables required for market forecast are set and the model is built on the basis of these variables.
- Step-2: Build a Market Model: Market-size estimations for the forecast years are in nominal terms. Inflation is considered to be a part of the pricing, and the average selling price (ASP) is varying throughout the forecast period for each country
- Step-3: Validate and Finalize: In this important step, all market numbers, variables and analyst calls are validated through an extensive network of primary research experts from the market studied. The respondents are selected across levels and functions to generate a holistic picture of the market studied.
- Step-4: Research Outputs: Syndicated Reports, Custom Consulting Assignments, Databases & Subscription Platforms

Get More Details On Research Methodology
Download PDF


