
Global Veterinary MRI Market Size and Share
Market Overview
| Study Period | 2020 - 2031 |
|---|---|
| Market Size (2026) | USD 276.39 Million |
| Market Size (2031) | USD 404.57 Million |
| Growth Rate (2026 - 2031) | 7.92 % |
| Fastest Growing Market | Asia Pacific |
| Largest Market | North America |
| Market Concentration | Medium |
Major Players *Disclaimer: Major Players sorted in no particular order Image © Mordor Intelligence. Reuse requires attribution under CC BY 4.0. | |
Global Veterinary MRI Market Analysis by Mordor Intelligence
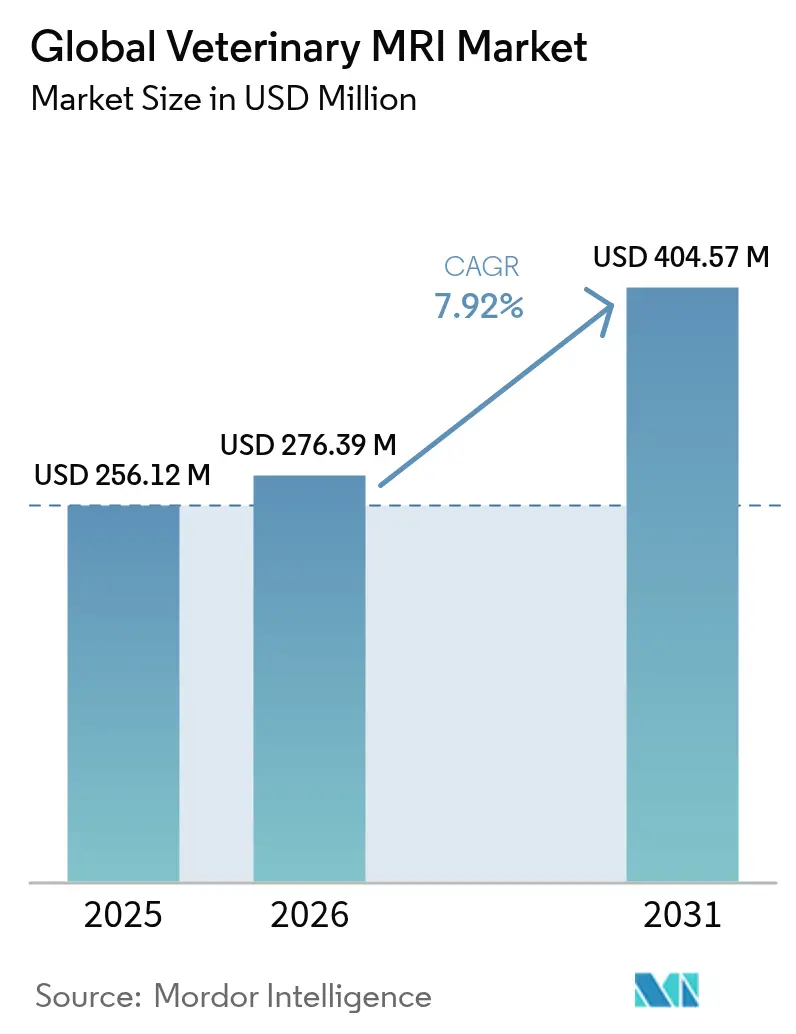
The veterinary MRI market size is expected to grow from USD 256.12 million in 2025 to USD 276.39 million in 2026 and is forecast to reach USD 404.57 million by 2031 at 7.92% CAGR over 2026-2031. Robust growth reflects rising companion-animal health spending, helium-free magnet innovations that cut operating costs, and broader insurance coverage that lowers out-of-pocket expenses for pet owners. North America retained a 44.62% veterinary MRI market share in 2024, yet Asia-Pacific is expanding the fastest at a 10.36% CAGR as urbanization and disposable incomes lift demand for premium diagnostics. Neurology remains the highest-volume clinical application because MRI delivers unmatched soft-tissue contrast for brain and spinal imaging, while oncology studies are climbing at 9.72% CAGR as cancer incidence rises in aging pets. Competitive momentum centers on helium-free 1.5 T systems and AI-assisted reconstruction that trims scan time 30%-50% while boosting image clarity.
Key Report Takeaways
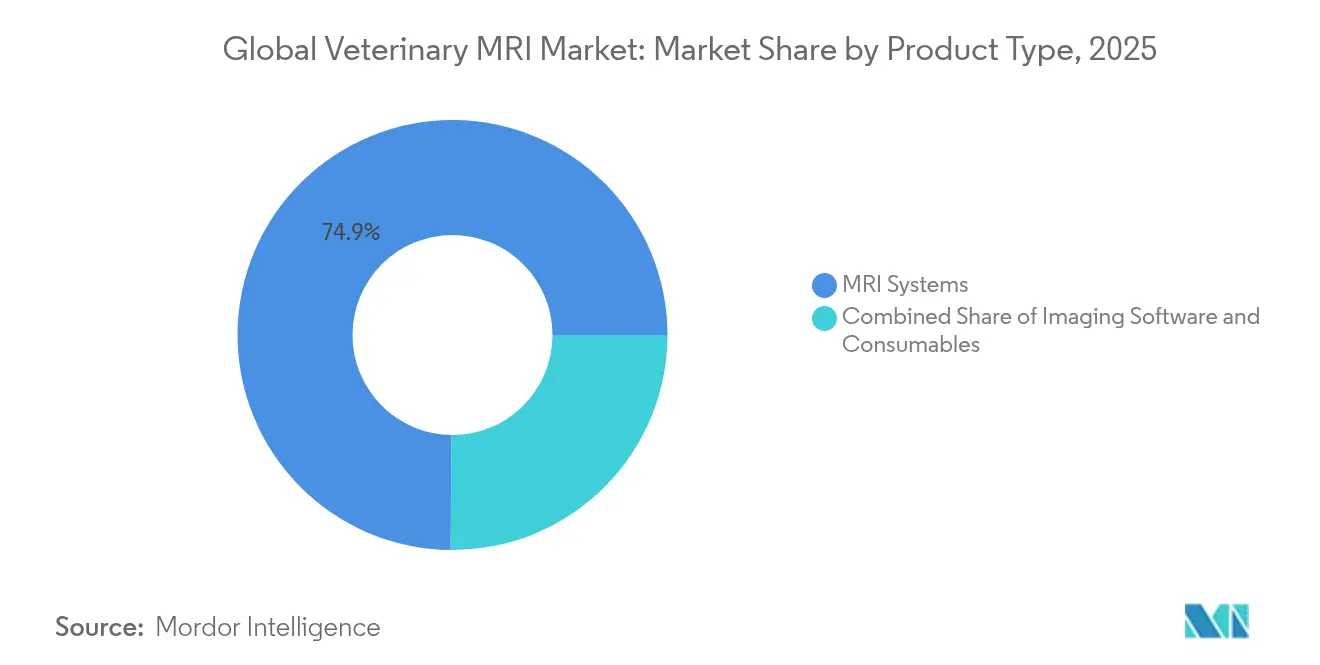
- By product type, MRI systems led with 74.86% of 2025 revenue; consumables are forecast to rise at 8.86% CAGR through 2031.
- By application, neurology held 35.02% of the veterinary MRI market share in 2025; oncology is poised for 9.28% CAGR growth to 2031.
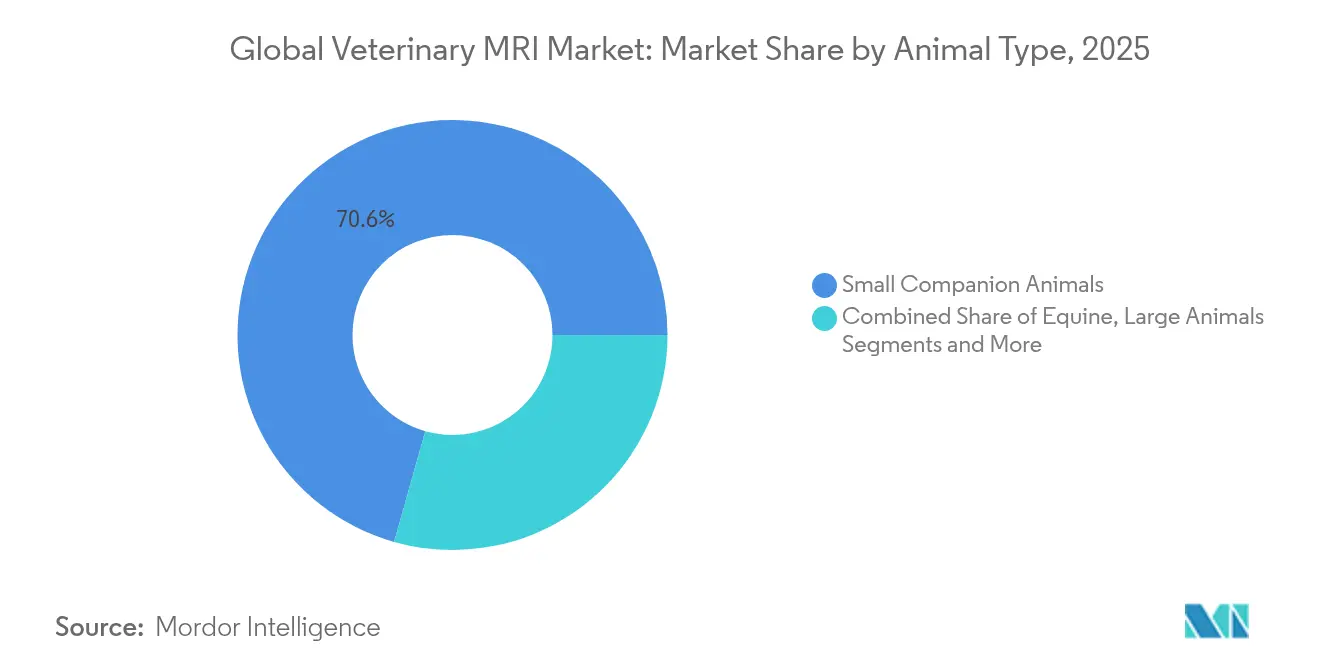
- By animal type, small companion animals accounted for 70.62% of the veterinary MRI market size in 2025, while equine imaging is projected to expand at 9.21% CAGR.
- By end user, veterinary hospitals represented 56.05% of 2025 revenue, whereas veterinary clinics are expected to post a 9.64% CAGR to 2031.
Note: Market size and forecast figures in this report are generated using Mordor Intelligence’s proprietary estimation framework, updated with the latest available data and insights as of 2026.
Global Veterinary MRI Market Trends and Insights
Drivers Impact Analysis*
| Driver | (~) % Impact on CAGR Forecast | Geographic Relevance | Impact Timeline |
|---|---|---|---|
| Growing pet ownership & rising spend on companion-animal health | +2.1% | Global; strongest in North America & Asia-Pacific | Long term (≥ 4 years) |
| Technological advances in veterinary MRI hardware & software | +1.8% | Global; led by North America & Europe | Medium term (2-4 years) |
| Higher incidence of chronic neurological & orthopedic disorders in pets | +1.5% | Global; concentrated in developed markets | Long term (≥ 4 years) |
| Shift toward standing equine MRI reducing anesthesia risk & throughput time | +1.2% | North America & Europe | Short term (≤ 2 years) |
| Helium-free compact magnets lowering facility barriers | +0.9% | Emerging markets | Medium term (2-4 years) |
| AI-assisted image reconstruction enabling low-field systems adoption | +0.8% | Early uptake in North America & Europe | Medium term (2-4 years) |
| Source: Mordor Intelligence | |||
Growing Pet Ownership & Rising Spend On Companion-Animal Health
Global pet care expenditure is projected to climb to USD 279 billion by 2030, largely driven by millennials and Gen Z who treat pets as family members [1]Harris Williams, “Pet Care Industry Overview,” harristwilliams.com. MRI scans for dogs can cost USD 2,500-6,000 yet are increasingly reimbursed by insurance plans covering 70%-90% of fees. This willingness to finance high-value diagnostics underpins steady utilization growth in the veterinary MRI market. Europe’s companion-animal health outlays are tracking a 6.4% CAGR, reinforcing long-term demand for advanced imaging. In urban centers, smaller household sizes concentrate discretionary spend on pets, fueling premium care adoption. These patterns signal durable volume expansion through the forecast horizon.
Technological Advances In Veterinary MRI Hardware & Software
Helium-free architectures slash operating complexity by reducing coolant volumes from 1,500 L to under 1 L. AI reconstruction now shortens scans by up to 50% while improving signal-to-noise ratios, letting clinicians deliver faster diagnoses. Bruker’s d-DNP polarizer achieves >10,000× signal gains, broadening oncology research opportunities. Low-field 0.05 T systems that draw only 1,800 W of power cut energy costs relative to conventional 25 kW units [2]IEEE Spectrum, “Low-Field MRI Advances,” ieee.org. Collectively, these breakthroughs lower ownership barriers and widen the veterinary MRI market.
Higher Incidence Of Chronic Neurological & Orthopedic Disorders In Pets
Nearly half of dogs over age 10 develop cancer or neurologic complications that often necessitate MRI for staging and monitoring. AI models now reach 75.32% average precision in automated disc-herniation detection, boosting diagnostic throughput. The veterinary oncology device segment is growing 11.6% annually, directly translating into higher MRI case volumes for treatment planning. Breed-specific screening—for example, cardiac imaging in Miniature Schnauzers—further widens addressable demand. These clinical drivers firmly anchor long-term growth expectations for the veterinary MRI market.
Shift Toward Standing Equine MRI Reducing Anesthesia Risk & Throughput Time
Hallmarq’s standing equine systems let horses remain conscious, eliminating anesthesia-related complications that historically curbed equine MRI uptake. Detomidine-morphine sedation protocols stabilize patients without compromising image fidelity. The technology halves procedure time and quickens return to training, traits valued by owners of performance animals. Uptake in Europe and North America underpins a 9.62% CAGR for equine imaging volumes. Broader application to large livestock and zoo animals is emerging as technical experience grows.
Restraints Impact Analysis*
| Restraint | (~) % Impact on CAGR Forecast | Geographic Relevance | Impact Timeline |
|---|---|---|---|
| High upfront & maintenance cost of MRI systems | −1.4% | Emerging markets most affected | Long term (≥ 4 years) |
| Shortage of board-certified veterinary radiologists | −1.1% | Acute in North America & Europe | Medium term (2-4 years) |
| Absence of reimbursement pathways for advanced imaging in most regions | −0.8% | Global except North America & select EU states | Long term (≥ 4 years) |
| Global helium supply volatility impacting operational costs | −0.6% | Conventional systems worldwide | Short term (≤ 2 years) |
| Source: Mordor Intelligence | |||
High Upfront & Maintenance Cost Of MRI Systems
Purchase prices span USD 150,000 for refurbished low-field units to over USD 1 million for high-field scanners, while older designs can consume helium worth more than USD 30,000 per year. Installation demands shielded rooms and reinforced floors, raising capital needs for smaller clinics. Independent practices thus lean toward mobile services or shared centers, delaying purchases and tempering veterinary MRI market size expansion. Helium-free magnets are helping narrow the affordability gap but remain early in the adoption curve.
Shortage Of Board-Certified Veterinary Radiologists
Workforce supply is lagging demand as imaging volumes grow faster than specialist training pipelines. Teleradiology alleviates part of the shortfall, yet complex neurology and oncology cases still require on-site expertise. AI-enabled interpretation platforms that deliver preliminary reads within 5 minutes and achieve 92% agreement with human specialists are gaining traction. Despite technological aids, the talent deficit continues to dampen full utilization rates, trimming near-term growth in the veterinary MRI market.
*Our forecasts treat driver/restraint impacts as directional, not additive. The impact forecasts reflect baseline growth, mix effects, and variable interactions.
Segment Analysis
By Product Type: Systems Drive Revenue While Consumables Accelerate
The systems segment generated 74.86% of 2025 revenue, underscoring its pivotal role in the veterinary MRI market. Global demand is buoyed by installation of helium-free 1.5 T consoles that can operate in standard exam rooms, trimming facility modification budgets. Hallmarq installed the first zero-helium small-animal scanner in the United States in 2024, a milestone that underscores rapid technology diffusion. AI-ready consoles are also shipping with pre-loaded reconstruction algorithms that shrink scan times by up to 50%, elevating daily study throughput.
Consumables—contrast agents, positioning aids, and maintenance kits—captured a modest share in 2025 yet are forecast for 8.86% CAGR, the fastest among product categories. Rising case volumes create annuity-like revenue streams, while regulatory approvals of gadolinium-free formulations widen clinical use. Imaging software, although a smaller revenue pool, grows steadily as subscription models gain acceptance among clinics that prefer operating-expense budgeting over upfront licenses. Collectively, these dynamics reinforce the diversified revenue profile that underpins sustained expansion of the veterinary MRI market.


By Application: Neurology Leads While Oncology Surges
Neurology accounted for 35.02% of 2025 revenue, illustrating MRI’s centrality in evaluating brain tumors, spinal injuries, and seizure disorders that cannot be characterized adequately with radiography or ultrasonography. High-field magnets combined with phased-array coils deliver sub-millimeter resolution, critical for mapping subtle intracranial lesions. AI-powered segmentation further refines lesion boundaries, accelerating report turnaround and clinician confidence.
Oncology applications, however, are charting 9.28% CAGR as cancer prevalence rises in pets living longer under improved preventive care. Dynamic contrast-enhanced MRI allows earlier detection of vascular changes in neoplasms, guiding surgical planning and radiotherapy targeting. Cardiothoracic protocols are also gaining popularity, propelled by refined sequences that reduce motion artifacts in conscious patients. Orthopedic studies benefit from standing MRI adoption that eliminates anesthesia risks, enabling repetitive monitoring of tendon healing in performance horses. These trends collectively augment the veterinary MRI market size for specialized clinical indications.
By Animal Type: Companion Animals Dominate While Equine Accelerates
Small companion animals—principally dogs and cats—represented 70.62% of global revenue in 2025 thanks to dense referral networks, strong insurance penetration, and owner willingness to invest in advanced care. Dedicated coils tailored to toy breeds and feline cranial anatomy enhance diagnostic yield, while sedation-optimized protocols cut anesthesia time. AI-assisted triage further boosts throughput, enabling busy hospitals to manage rising caseloads without proportionate staff expansions.
Equine imaging is advancing at 9.21% CAGR, powered by standing MRI that sidesteps the anesthesia risks long deterring owners of valuable sport horses. Portable platforms are entering pilot trials for on-farm imaging, promising adoption in remote regions. Livestock and exotic species remain niche but intriguing, with zoo veterinarians experimenting with modified head coils for big-cat neurology studies. Such innovation broadens the veterinary MRI market’s clinical and species breadth, supporting longer-term growth.
By End User: Hospitals Lead While Clinics Gain Ground
Veterinary hospitals generated 56.05% of 2025 revenue because they possess the staff, shielding infrastructure, and caseload volume to justify capital-intensive MRI installation. Multi-disciplinary teams in referral centers rely on MRI for surgical planning and postoperative monitoring, anchoring high utilization rates. Academic teaching institutions further amplify demand through research projects and specialist training programs.
Veterinary clinics are forecast for a 9.64% CAGR through 2031, reflecting technology democratization. Helium-free low-field scanners fit conventional exam rooms and plug into single-phase power, permitting installation in urban storefront practices. Mobile services that transport scanners between clinics on weekly routes also proliferate, sharing costs across multiple users. These decentralized models expand the veterinary MRI market size beyond tertiary centers, extending advanced imaging to broader geographic and socioeconomic segments.
Geography Analysis
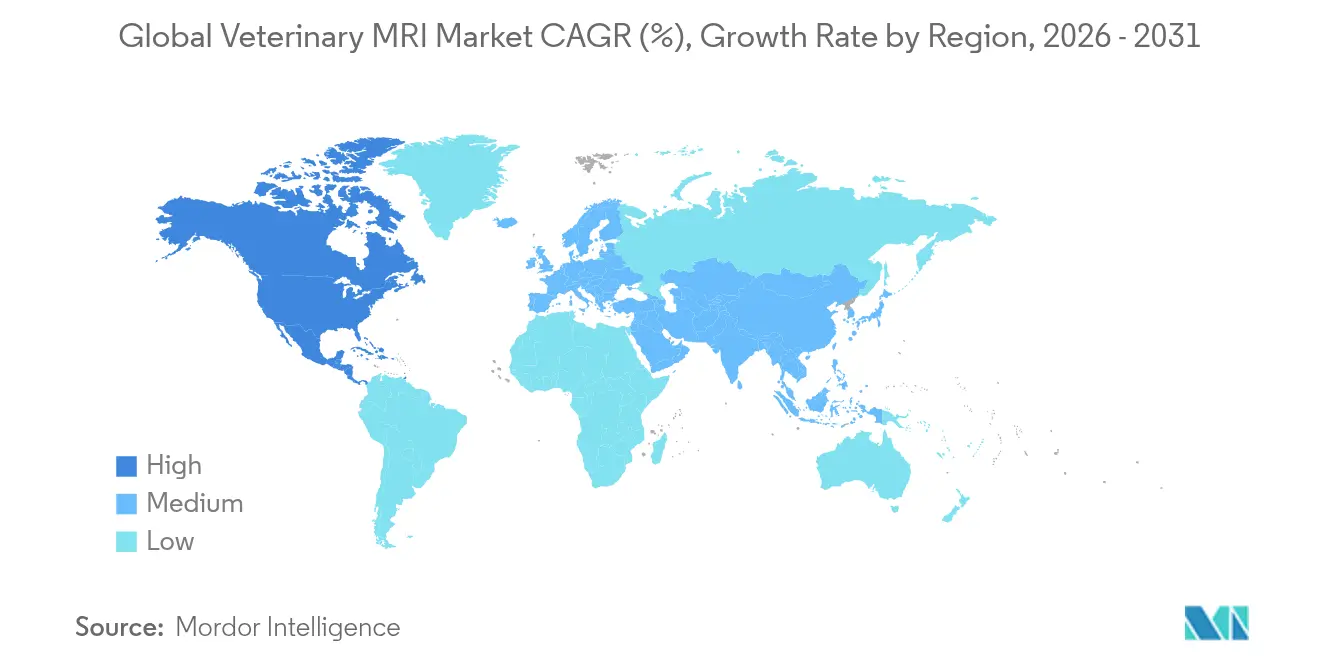
North America retained 44.15% of global revenue in 2025, anchored by the United States’ large insured companion-animal population and early adoption of AI-ready scanners. Veterinary schools at Colorado State University and University of Pennsylvania operate multiple high-field magnets that serve both clinical clients and translational research. Canada’s public-private research grants incentivize purchase of helium-free systems, while Mexico’s emerging middle class fuels private clinic upgrades. Continuous FDA engagement through the Animal and Veterinary Innovation Agenda speeds approval of novel coils and software, reinforcing regional leadership .
Europe ranked second, benefitting from stringent welfare statutes and active professional bodies such as the European Association of Veterinary Diagnostic Imaging, which issues practice guidelines on MRI protocols. Germany, France, and the United Kingdom dominate scanner installations, but Italy and Spain are catching up through consolidation plays that roll smaller clinics into national groups able to finance MRI investments. EU Medical Device Regulation harmonizes safety and performance benchmarks, boosting clinician confidence and accelerating replacement cycles.
Asia-Pacific is the fastest-growing region at 9.98% CAGR, propelled by rising pet ownership in China and South Korea and advanced research ecosystems in Japan and Australia. Japan hosts more than 100 animal MRI units in universities and private hospitals, many operating in hybrid research-clinical modes that maximize uptime. Canon Medical Systems’ distributor network in India recently added veterinary-specific sequences to human scanners, reducing incremental costs for clinics. Government-sponsored pet health insurance pilots in Singapore and Thailand, though limited, hint at additional tailwinds. The Middle East & Africa and South America remain early-stage markets but offer long-run upside as disposable incomes rise and expertise diffuses via tele-mentoring.

Regulatory Landscape
The veterinary MRI sector operates in a split regulatory environment across regions. In the United States, the FDA CDRH framework governs safety, labeling, and post-market considerations for imaging equipment used in animals, with radiation-emitting device rules applying to MRI systems and related controls. The FDA Quality Management System Regulation (QMSR) amendment, effective February 2, 2026, sets expectations for aligned quality systems across OEMs and service providers shipping veterinary-focused configurations.
Value Chain Analysis
Upstream suppliers of magnets and subsystems (permanent magnets or superconducting assemblies), gradient amplifier modules, RF coil arrays, and software stacks form the core, with cryogen management serving as a key distinction for high-field systems. The FDA QMSR environment effective in 2026 reinforces manufacturing quality expectations for US-facing production. Downstream, distribution splits between direct OEM sales to large referral hospitals, universities, and multi-site groups, and regional distributors that support clinics with installation, training, and maintenance. Service capacity, uptime management, and workflow integration are key to utilization and recurring revenue through coils, accessories, and software subscriptions.
Competitive Landscape
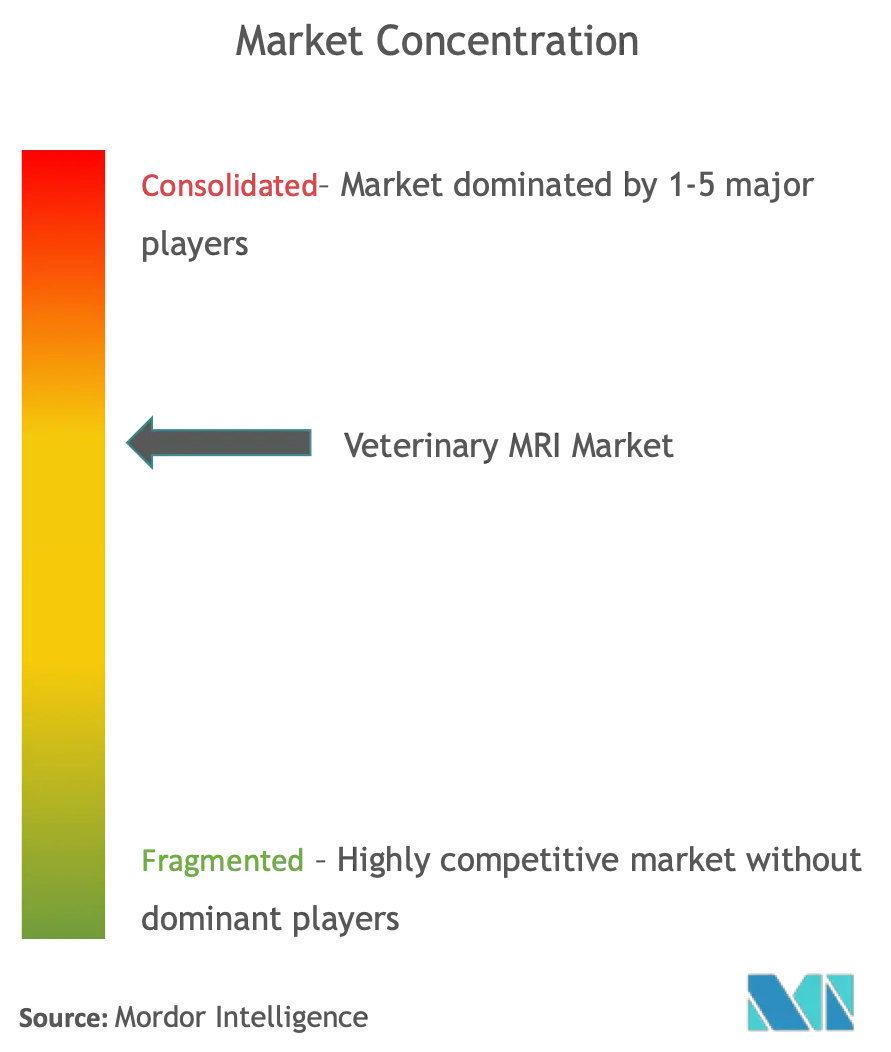
The veterinary MRI market features moderate fragmentation with three leading vendors—Hallmarq Veterinary Imaging, Esaote, and Bruker Corporation—collectively accounting for roughly one-third of 2024 unit shipments. Hallmarq differentiates with helium-free magnets targeted at small animals and standing equine configurations, appealing to practices wary of cryogen logistics. Esaote leverages its permanent-magnet legacy to position lower-cost 0.25 T scanners for first-time buyers, while Bruker capitalizes on ultra-high-field research magnets that support translational oncology studies.
Technology partnerships intensify competition. Siemens Healthineers and Bayer rolled out an MR-injector coupling system that synchronizes contrast delivery with sequence timing, trimming setup minutes per study. GE HealthCare integrated a cloud-based AI reconstruction module licensed from a start-up that trained its network on 80 million clinical images, slashing abdominal scan time to under 8 minutes. As the talent shortage persists, vendors embed guided-workflow software that steers technologists through coil selection and positioning, trimming retraining costs for clinics entering the veterinary MRI market.
Consolidation among service providers amplifies capital spending power. National Vet Associates’ 2024 acquisition of 267 clinics across Australia and New Zealand earmarked USD 150 million for imaging upgrades, an exemplar of group-level purchasing leverage. Private-equity investors favor platforms that bundle specialty care, tele-radiology, and mobile MRI fleets, betting on cross-selling synergies. For mid-sized manufacturers, white-label arrangements with regional distributors remain a viable route to scale without heavy direct sales investment. The strategic chessboard is thus defined by R&D intensity, channel alliances, and inorganic growth that together shape future share shifts in the veterinary MRI market.
Global Veterinary MRI Industry Leaders
Esaote SpA
Bruker Corporation
Mediso Ltd.
MR Solutions
Imotek International Ltd
- *Disclaimer: Major Players sorted in no particular order

Market Opportunities and Future Outlook
A central opportunity in veterinary MRI is expanding access beyond tertiary referral centers by lowering total cost of ownership and reducing workflow complexity. MRI systems still represent a large revenue pool, with 74.86 percent of 2025 revenue attributed to MRI. Compact installation footprints and software-led productivity support decentralization toward veterinary clinics, where operating-expense friendly software and service models, along with shared or mobile imaging approaches, drive adoption.
Institutional upgrades at veterinary universities and multi-species facilities expand the addressable base for modern coils, sequences, maintenance kits, and reconstruction software. Cloud-enabled reads and quality assurance workflows are gaining traction. In July 2026, Zoetis announced an agreement to acquire VitalRADS, a veterinary teleradiology platform, reinforcing opportunities for bundled scanners with interpretation networks and AI-assisted reporting across facilities lacking on-site radiology coverage.
Recent Industry Developments
- July 2026: Zoetis announced the acquisition of VitalRADS, a veterinary teleradiology platform, expanding bundled scanner and interpretation networks for veterinary imaging. The deal broadens remote-read capabilities and standardizes AI-assisted reporting across partner clinics. The acquisition also sets up Zoetis to integrate cloud-enabled QA workflows with imaging hardware.
- May 2026: Bruker commissioned a BioSpec 18 Tesla preclinical MRI system at the Champalimaud Foundation in Lisbon to support neuroscience and oncology research. The installation strengthens access to ultra-high-field imaging in translational programs that can inform advanced sequence development and preclinical-to-clinical imaging workflows relevant to veterinary oncology and neurology.
- May 2024: Hallmarq delivered its first zero-helium small-animal 1.5 T MRI scanner to Wisconsin Veterinary Neurology and Surgical Center in the United States. The milestone validated commercial deployment of helium-free high-field systems in veterinary settings, supporting adoption by practices seeking to reduce cryogen logistics and operating complexity.


Research Methodology Framework and Report Scope
Market Definition and Coverage
For this study, the veterinary MRI market value reflects MRI systems used in animal diagnostics, plus related software and consumables that are bought to run and maintain MRI imaging in veterinary settings.
Scope exclusions: Human MRI equipment and imaging performed for human healthcare are excluded, even if the same OEM sells into both areas.
Segmentation Overview
- By Product Type
- MRI Systems
- Imaging Software
- Consumables
- By Application
- Neurology
- Orthopedics & Musculoskeletal
- Oncology
- Cardiology & Thoracic
- Other Applications
- By Animal Type
- Small Companion Animals
- Equine
- Livestock & Large Animals
- Exotic & Zoo Animals
- By End User
- Veterinary Hospitals
- Veterinary Clinics
- Others
- By Geography
- North America
- United States
- Canada
- Mexico
- Europe
- Germany
- United Kingdom
- France
- Italy
- Spain
- Rest of Europe
- Asia-Pacific
- China
- Japan
- India
- Australia
- South Korea
- Rest of Asia-Pacific
- Middle East & Africa
- GCC
- South Africa
- Rest of Middle East & Africa
- South America
- Brazil
- Argentina
- Rest of South America
- North America
Data Sources, Market Sizing, and Validation
Desk Research
Desk research was used to set the model structure and build an evidence-backed view of where MRI demand is coming from in animal health. We typically relied on public sources such as USDA animal health and livestock statistics, the US FDA Center for Veterinary Medicine updates, World Organization for Animal Health disease notifications, and OECD health and economic indicators to understand demand-side signals and spending capacity.
To keep assumptions grounded, we also reviewed peer-reviewed veterinary radiology journals, university veterinary hospital case studies (to understand MRI utilization and procedure mix), and customs and trade statistics where equipment movements are visible at a category level. Company annual reports, investor materials, and reputable press were used to track product launches, clinic network expansion, and service readiness. These were then cross-checked using paid subscriptions for company financials, patent databases, and shipment-level trade views when available. The sources listed here are illustrative, and other public references were also used for data collection, validation, and clarification.
Primary Interviews and Surveys
Primary work was run to confirm what MRI is being bought for and used for in veterinary care, and to convert partial desk signals into usable ranges. We spoke with a mix of MRI OEM-side roles, veterinary hospital administrators, imaging leads, and distributors across APAC, EMEA, and the Americas, so installed base trends, replacement timing, and pricing movement could be pressure-tested across different care models.
Distribution of primary research fieldwork respondents
| Company type | Respondent position | Region |
|---|---|---|
| Top tier: 29% | CXOs: 20% | APAC: 44% |
| Mid tier: 51% | Functional/Unit leaders: 38% | EMEA: 30% |
| Smaller Players: 20% | Managers: 42% | Americas: 26% |
Market-Sizing & Forecasting
Sizing starts with a top-down build that reconstructs MRI demand by linking the addressable veterinary imaging base to MRI penetration, then translating that demand into value using observed price bands for systems, software, and key consumables. During the build, we track practical inputs such as veterinary hospital and referral center counts, MRI procedure mix by key indications (for example, neurology and musculoskeletal), typical scan volumes per installed unit, replacement cycles, and average selling price movement by field strength and configuration.
The total is corroborated with selective bottom-up approximations, including a supplier roll-up for a sample of regions, channel checks on unit shipments, and sanity checks using sampled ASP times volume math. This supports adjustments where public reporting is thin. For forecasting, we used scenario analysis around three items that tend to swing outcomes: capital budget sentiment in clinics, adoption of helium-free systems, and access to trained imaging staff. The final curve was then aligned to what interviewees described as the most likely path by region.
Data Validation & Update Cycle
Outputs were validated through repeated variance checks across regions, and outliers were traced back to the specific input that drove them, such as a price assumption or an unusually high utilization rate. If a mismatch persisted after desk checks, the team re-contacted respondents to confirm whether the issue came from timing, currency conversion, or a one-off procurement cycle.
Before sign-off, the model goes through multi-step analyst reviews, where assumptions, math links, and year-over-year movement are checked against independent signals such as clinic expansion, equipment replacement patterns, and broader veterinary imaging growth. The report is refreshed annually, with interim updates when material events occur, and a fresh pre-delivery pass so clients receive the most current view.
Mordor Intelligence's Veterinary Mri Market Size Versus Other Published Estimates
Published values for veterinary MRI can differ because firms do not always count the same revenue streams, and they may use different base years and forecast windows. Currency timing and what is treated as equipment-only versus a broader solution set can also move the number by a noticeable margin.
Service revenue from imaging procedures is one common add-on in some publications, but it sits outside Mordor Intelligence's scope, which is limited to MRI systems plus related software and consumables. This scope difference tends to widen the spread when service-heavy regions are emphasized. Another driver is year selection, since some sources anchor on 2024 or 2025 estimates, while others use different replacement-cycle assumptions that can pull demand forward or push it out.
Benchmark comparison
| Source | Market Size | Gaps in Research Methodology |
|---|---|---|
| Mordor Intelligence | USD 0.28 B (2026) | |
| Global Consultancy A | USD 0.25 B (2025) | Uses a different base year and forecast frame, and its solution basket is often interpreted to include a wider set of services, which can shift value even if device volumes are similar. |
| Industry Publisher B | USD 0.20 B (2024) | Focuses mainly on MRI machines as equipment revenue, which can undercount software and consumables tied to MRI utilization, and it also relies on a longer replacement-cycle view in some regions. |
Looking across the table, most of the gap can be explained by what is counted (equipment-only versus equipment plus adjacencies) and by the chosen anchor year. By keeping inputs tied to observable clinic adoption, system pricing bands, and realistic utilization ranges, our estimate stays traceable and can be rechecked when any one assumption changes.


Key Questions Answered in the Report
What is the current Global Veterinary MRI Market size?
The veterinary MRI market was valued at USD 276.39 million in 2026 and is projected to reach USD 404.57 million by 2031 at an 7.92% CAGR.
Who are the key players in Global Veterinary MRI Market?
Esaote SpA, Bruker Corporation, Mediso Ltd., MR Solutions and Imotek International Ltd are the major companies operating in the Global Veterinary MRI Market.
Which is the fastest growing region in Global Veterinary MRI Market?
Asia Pacific is estimated to grow at the highest CAGR over the forecast period (2026-2031).
Which region has the biggest share in Global Veterinary MRI Market?
North America leads with 44.15% of global revenue, supported by strong insurance coverage and early adoption of helium-free technology.
Page last updated on:


 Your data is secure and never sold or shared.


