
Veterinary Drugs Market Size and Share
Market Overview
| Study Period | 2020 - 2031 |
|---|---|
| Market Size (2026) | USD 34.72 Billion |
| Market Size (2031) | USD 48.31 Billion |
| Growth Rate (2026 - 2031) | 6.83 % |
| Fastest Growing Market | Asia Pacific |
| Largest Market | North America |
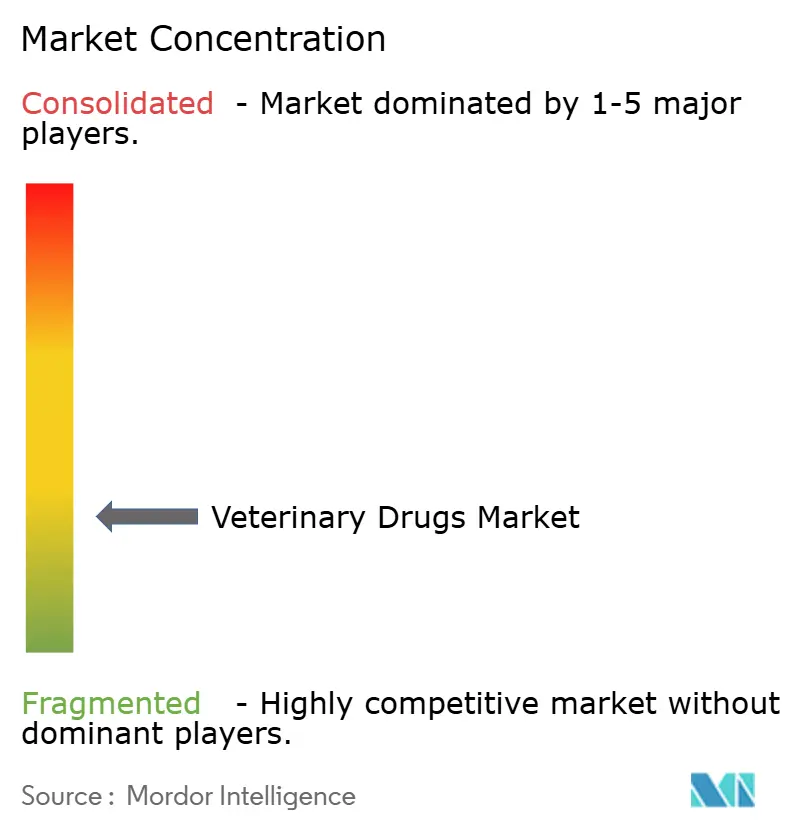
| Market Concentration | Low |
Major Players *Disclaimer: Major Players sorted in no particular order Image © Mordor Intelligence. Reuse requires attribution under CC BY 4.0. | |
Veterinary Drugs Market Analysis by Mordor Intelligence
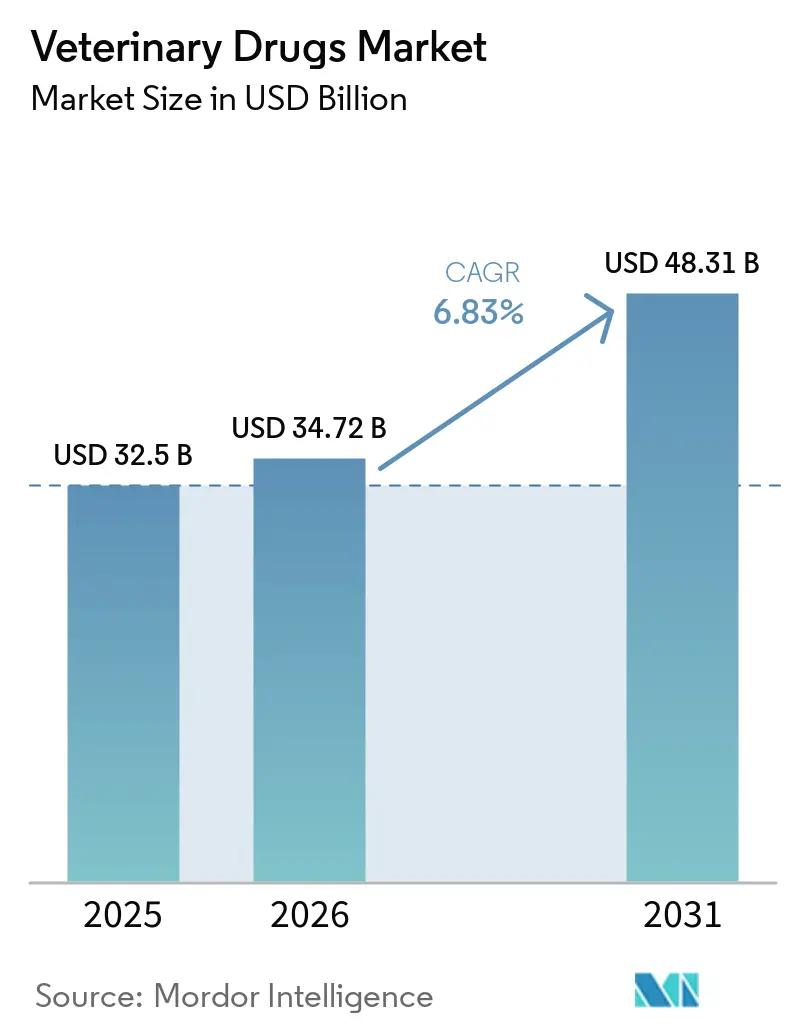
The veterinary drugs market size was valued at USD 32.5 billion in 2025 and estimated to grow from USD 34.72 billion in 2026 to reach USD 48.31 billion by 2031, at a CAGR of 6.83% during the forecast period (2026-2031). Sustained disease outbreaks in both food-animal and pet populations are lifting demand for rapid-response vaccines and specialty therapeutics, while regulatory agencies approved 24 new animal drugs in 2024, including several mRNA platforms that shorten development timelines[1]. Heightened surveillance by the World Organisation for Animal Health logged a 12% rise in global disease notifications in 2024, steering procurement budgets toward preventive biologics and broad-spectrum anti-infectives. Producers are also adopting long-acting injectables that cut labor costs on large feedlots and dairies, helping parenteral products gain traction despite oral formulations retaining a majority share. Meanwhile, climate-linked parasite expansion is inflating R&D budgets for next-generation parasiticides, encouraging manufacturers to collaborate with academic consortia on novel modes of action.
Key Report Takeaways
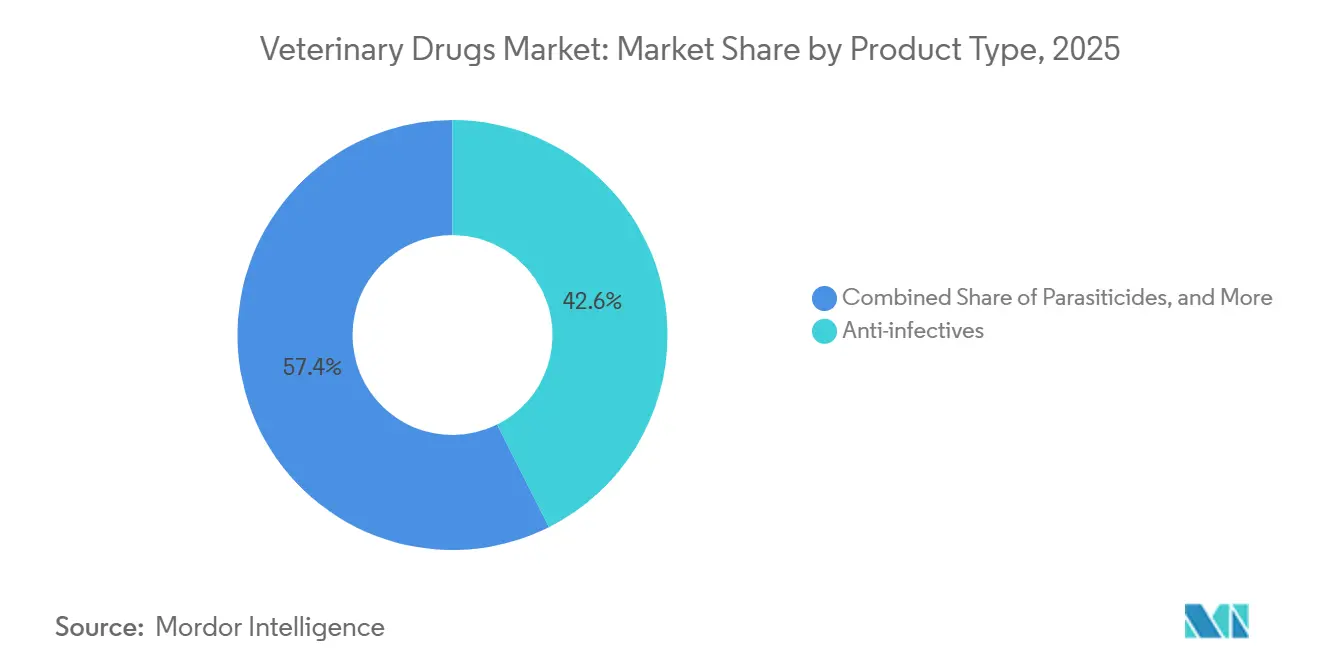
- By product type, anti-infectives captured 42.55% of the veterinary drugs market share in 2025, whereas vaccines are projected to expand at an 8.25% CAGR through 2031.
- By route of administration, oral formulations led with a 53.53% revenue share in 2025, while parenteral delivery is forecast to advance at a 7.75% CAGR between 2026 and 2031.
- By animal type, livestock accounted for 62.15% of 2025 revenue, but companion-animal therapeutics are on track to grow at a 7.82% CAGR to 2031.
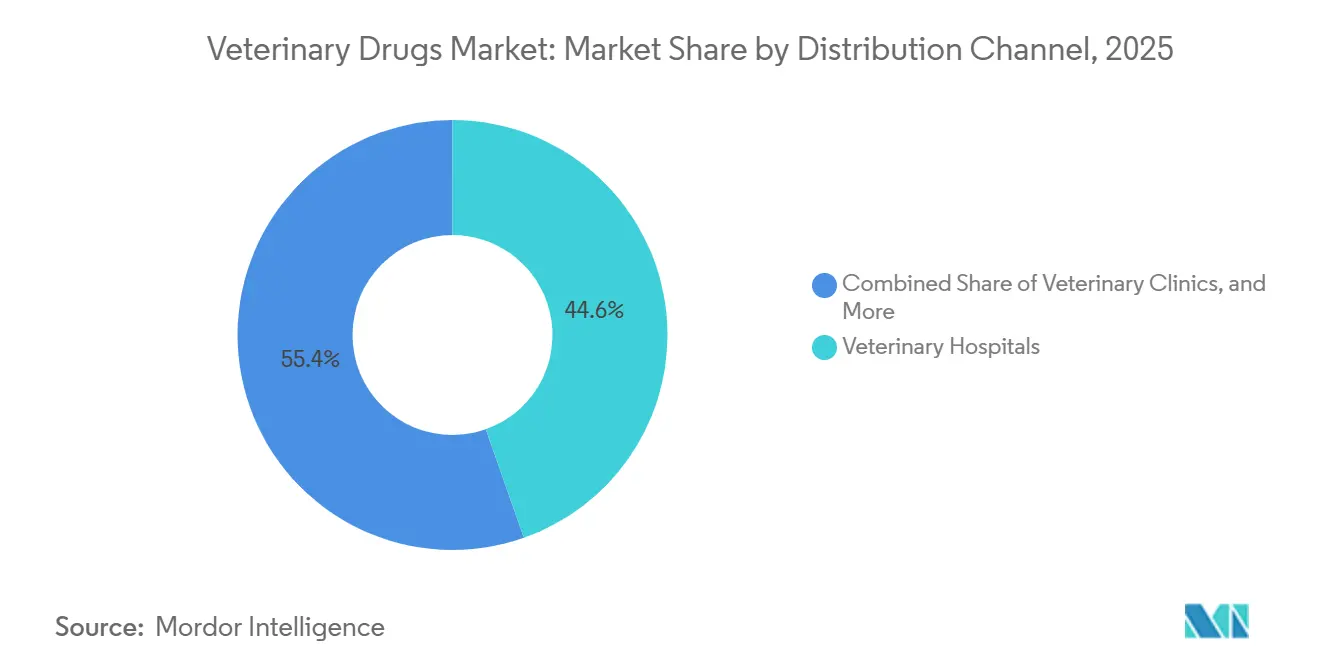
- By distribution channel, veterinary hospitals dominated with a 44.65% share in 2025, whereas online retail is expected to post an 8.32% CAGR over the same horizon.
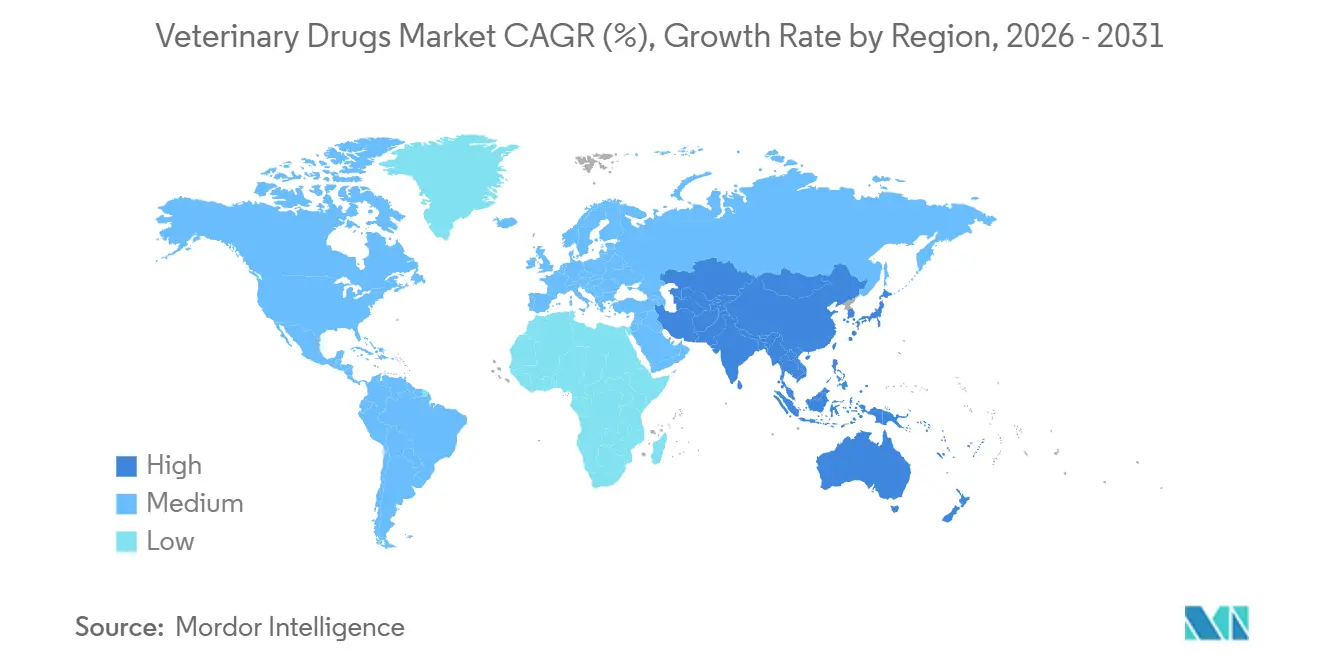
- By geography, North America accounted for 38.55% of global sales in 2025, yet Asia-Pacific is poised to deliver a 7.22% CAGR through 2031 as livestock intensification accelerates in China, India, and Southeast Asia.
Note: Market size and forecast figures in this report are generated using Mordor Intelligence’s proprietary estimation framework, updated with the latest available data and insights as of 2026.
Market Trends and Insights
Drivers Impact Analysis of Veterinary Drugs Market*
| Driver | (~) % Impact on CAGR Forecast | Geographic Relevance | Impact Timeline |
|---|---|---|---|
| Rise in Prevalence of Infectious Diseases in Pets & Livestock | +1.4% | Global, with acute pressure in APAC and Sub-Saharan Africa | Short term (≤ 2 years) |
| Growing Demand for Animal-Sourced Protein | +1.2% | APAC core, spill-over to MEA and South America | Medium term (2-4 years) |
| Advances in Biologics & Novel Drug Delivery Platforms | +1.0% | North America & EU, early adoption in urban APAC markets | Medium term (2-4 years) |
| Pet-Humanization Boosting Preventive Care Spend | +0.9% | North America, EU, and affluent APAC urban centers | Long term (≥ 4 years) |
| Long-Acting Injectable & Precision-Dosing Technologies | +0.7% | Global, with fastest uptake in North America and EU livestock operations | Medium term (2-4 years) |
| AI-Driven Disease Surveillance Accelerating Demand Spikes | +0.5% | North America and EU, pilot deployments in China and Australia | Long term (≥ 4 years) |
| Source: Mordor Intelligence | |||
Rise in Prevalence of Infectious Diseases in Pets & Livestock
Soaring case counts of African swine fever, highly pathogenic avian influenza, and lumpy skin disease are reshuffling procurement priorities for the veterinary drugs market[2]. Emergency culls of 18 million U.S. poultry during 1H 2025 created a scramble for autogenous vaccines that match regional viral strains. Canine parvovirus variants that slip past legacy epitopes now oblige polyvalent boosters, which favors firms able to keep broad strain libraries. Rapid tech-transfer capability from research to fermentation gives suppliers an edge when regulators fast-track conditional licenses. Together, more frequent outbreaks and compressed response windows amplify product pull-through for broad-spectrum anti-infectives and customized biologics across the global veterinary drugs market.
Growing Demand for Animal-Sourced Protein
Projected meat output of 366 million t by 2030 is tightening the linkage between herd health and national food security[3]. China’s pig herd recovery to 440 million head in 2024 reignited demand for vaccines, growth promoters, and prescription antibiotics under veterinary oversight, sustaining baseline volumes for the veterinary drugs market. India’s push to reach 300 million t of milk by 2028 widens the addressable market for mastitis therapies and reproductive hormones. Aquaculture hotspots in Vietnam and Indonesia now rely on medicated feeds to curb gill disease, illustrating how aquatic species are becoming a material revenue stream. Rising protein consumption, therefore, guarantees steady unit volumes even as stewardship rules restrain per-animal antibiotic intensity.
Advances in Biologics & Novel Drug-Delivery Platforms
Monoclonal antibodies for canine dermatology and osteoarthritis generated USD 420 million in 2024 revenue, validating premium pricing in the veterinary drugs market. FDA guidance on cell and gene therapies opened a route for autologous stem-cell treatments in equine injuries, expanding indications that previously lacked pharmacologic options. Recombinant cytokines under late-stage trials aim to treat bovine respiratory disease without prophylactic antibiotics, aligning with residue-reduction policy goals. Long-acting injectables that use poly(lactic-co-glycolic acid) microspheres extend dosing from weekly to quarterly, cutting labor hours on large dairies. Collectively, platform biologics and sustained-release carriers enhance therapeutic precision and diversify revenue away from commoditized small-molecule categories.
Pet-Humanization Boosting Preventive-Care Spend
Seventy-two percent of U.S. dog owners purchased at least one elective preventive-care service in 2024, a trend that supports the adoption of premium formularies in the veterinary drugs market. Companion-animal insurance policies climbed to 4.8 million by mid-2025, cushioning out-of-pocket shocks and normalizing high-value prescriptions. Tele-consultations surpassed 9.2 million in 2024, channeling electronic scripts directly to online pharmacies that can stock niche biologics without shelf-life risk. Portable PCR and immunoassay devices now deliver in-clinic results in minutes, accelerating evidence-based prescribing and boosting compliance. These behavioral shifts keep discretionary therapeutics on a growth path, even as macroeconomic cycles pressure household incomes.
Restraints Impact Analysis of Veterinary Drugs Market*
| Restraint | (~) % Impact on CAGR Forecast | Geographic Relevance | Impact Timeline |
|---|---|---|---|
| Heightened Antimicrobial-Residue Regulations Raising Costs | -0.7% | Global, with strictest enforcement in EU and North America | Short term (≤ 2 years) |
| Climate-Driven Parasite Resistance Escalating R&D Burden | -0.5% | Global, most acute in tropical and subtropical zones | Long term (≥ 4 years) |
| Global Shortage of Veterinarians | -0.4% | North America, EU, and rural areas across all regions | Medium term (2-4 years) |
| Proliferation of Counterfeit Medicines | -0.3% | APAC, MEA, and South America markets with weak enforcement | Short term (≤ 2 years) |
| Source: Mordor Intelligence | |||
Heightened Antimicrobial-Residue Regulations Raising Costs
EU sales of veterinary antimicrobials fell 23% between 2021 and 2024 after prophylactic bans and e-prescription mandates, directly trimming volume growth for traditional anti-infectives[4]. FDA Guidance #263 removed over-the-counter channels in 2024, forcing livestock operators to absorb additional veterinary consultation and record-keeping expenses. Compliance adds USD 12–18 per head in beef feedlots, squeezing margins in commodity chains where antibiotic-free premiums remain volatile. Drug makers must now fund residual trials and global surveillance programs, which are extending regulatory timelines. As margins thin, capital shifts toward alternatives like bacteriophages and immune-priming vaccines, slowing reinvestment in new small-molecule classes.
Climate-Driven Parasite Resistance Escalating R&D Burden
Ivermectin-resistant nematodes now prevail in 68% of sampled sheep flocks across Australia, New Zealand, and South Africa, proving that chemical rotation alone cannot halt resistance. Tick vectors, such as the Lone Star tick, are forecast to establish year-round populations in 14 additional states by 2030, raising the cost of year-round parasiticide regimens. Developing novel modes of action costs above USD 100 million per compound and can span a decade, straining R&D budgets. As efficacy windows shorten, producers must layer management tactics, such as rotational grazing, strategic deworming, and targeted selective treatment, to dampen immediate drug volumes. Elevated development risk therefore drags on the long-run growth profile of the global veterinary drugs market.
*Our forecasts treat driver/restraint impacts as directional, not additive. The impact forecasts reflect baseline growth, mix effects, and variable interactions.
Veterinary Drugs Market Segment Analysis
By Product Type:
Prevention Accelerates Revenue DiversificationVaccines are on track to expand at an 8.25% CAGR, outpacing every other therapeutic class and reshaping demand patterns inside the veterinary drugs market. Anti-infectives still held 42.55% of 2025 revenue, the highest single-category veterinary drugs market share, but growth now levels off as stewardship policies restrict prophylactic use. Parasiticides remain indispensable for both livestock and pets, yet mounting resistance obliges more frequent product rotation, which lifts unit volume but compresses margins. Anti-inflammatory drugs support surgical and chronic pain protocols, while reproductive hormones boost conception rates in beef and dairy herds, anchoring ancillary demand. Nutritional supplements and anesthetics create smaller but recurring revenue streams that support the clinic workflow.
Advances in platform biologics are repositioning vaccines beyond core viral targets into chronic disease management, as evidenced by a monoclonal antibody for canine dermatitis that generated USD 420 million in 2024 sales. Combination products such as antibiotic-NSAID injectables bundle convenience for veterinarians who face dosing-compliance constraints on large farms. As first-in-class molecules mature, biosimilar entrants are expected to temper pricing power after 2028, especially in the Asia-Pacific generics corridor. Overall, diversification toward prevention secures longer product life cycles and stabilizes the veterinary drugs market against antimicrobial-policy shocks.

By Route of Administration:
Long-Acting Injectables Gain MomentumOral products captured 53.53% of 2025 revenue, the highest contribution to the veterinary drugs market size for any delivery format, by leveraging ease of mass medication in feed or treats. Tablets, chews, and soluble premixes set the convenience benchmark, yet palatability issues and variable gut absorption cap bioavailability in some molecules. Parenteral formulations are advancing at a 7.75% CAGR as long-acting microsphere-based injectables push dosing intervals from weekly to quarterly, cutting labor costs on intensive livestock systems. Topical spot-ons dominate ectoparasite control for cats and dogs, supplying targeted dermal delivery with low systemic exposure.
Pour-on insecticides remain popular in extensive grazing regions but are now subject to environmental reviews related to runoff in the EU. Intramammary tubes for bovine mastitis and intravaginal hormone devices fill niche but play essential roles in dairy management. An emerging micro-needle patch for small-ruminant vaccines passed Phase II trials in 2025, hinting at future label expansion that will clip market share from conventional syringes. Route innovation, therefore, acts as a latent growth lever that multiplies existing molecule value across the veterinary drugs market.
By Animal Type:
Pets Outpace Food-Animal GrowthLivestock still supplied 62.15% of global revenue in 2025, but companion animal pharmaceuticals are forecast to register a 7.82% CAGR through 2031, surpassing the overall veterinary drugs market trajectory. Dogs account for the largest pet sub-segment, with chronic diseases such as diabetes and osteoarthritis driving repeat scripts for insulin and anti-NGF monoclonal antibodies. Feline pharmacology advances more slowly because limited glucuronidation limits safe drug options, though targeted biotherapeutics are now entering late-stage trials.
Equine owners justify premium therapies—joint biologics and gastric ulcer drugs due to high individual animal value, but total volume remains niche. Aquaculture, the fastest-rising livestock niche, increases demand for water-soluble antibiotics and vaccines that minimize handling stress in high-density net pens. Minor-species (rabbits, ferrets, exotic birds) rely heavily on extra-label use, yet the FDA’s minor-use pathway introduced in 2024 could unlock tailored approvals by 2027. Species diversification, therefore, balances cyclical swings and widens the installed customer base within the veterinary drugs market.
By Distribution Channel:
Digital Dispensing Rewrites AccessVeterinary hospitals retained 44.65% of 2025 revenue, anchoring the prescription-generation node for controlled injectables and specialty biologics. Yet online pharmacies are expanding at a 8.32% CAGR as owners embrace auto-ship subscriptions that improve refill compliance and transparency of prices. Independent clinics feel dual pressure: they must honor prescription-transfer rules issued in 2024 while competing against e-commerce on dispensing margins.
Farm-supply stores still dominate over-the-counter dewormers and vaccines for backyard flocks, but larger producers increasingly negotiate direct-volume contracts with manufacturers to secure supply. Tele-consult platforms now integrate e-prescribe APIs, enabling just-in-time fulfillment from centralized warehouses that carry deep SKU breadth without shelf-life risk. Geographic dispersion favors omnichannel hybrids, in which clinics partner with e-commerce portals to share fulfillment fees. Distribution flexibility, therefore, remains pivotal to winning incremental wallet share in the veterinary drugs market.
Geography Analysis
North America Veterinary Drugs Market
North America accounted for 38.55% of global revenue in 2025, with robust pet insurance adoption and intensive feedlot systems driving steady biologics uptake. The United States spearheads innovation, averaging 24 FDA veterinary drug approvals per year since 2024, which sustains premium pricing for early-cycle products. Canada benefits from regulatory harmonization and proximity to U.S. manufacturers, whereas Mexico’s generics expansion preserves regional cost competitiveness.
APAC Veterinary Drugs Market
Asia-Pacific is projected to clock a 7.22% CAGR, surpassing the global veterinary drugs market size growth rate, fueled by China’s aggressive livestock vaccination drives and India’s formalization of veterinary pharmaceutical manufacturing. Japan commands high per-pet spending and pet insurance penetration above 15%, stabilizing premium-therapy sales. Australia’s stringent residue controls underpin demand for on-label antibiotics and vaccine programs aligned with export certification schemes.
EMEA and South America Veterinary Drugs Market
Europe maintains a mature regulatory framework that enables centralized product launches, yet national reimbursement differences fragment uptake. Germany and the United Kingdom anchor EU sales, while Spain’s large swine sector consumes disproportionate volumes of respiratory-disease vaccines. The Middle East and Africa remain under-penetrated because of counterfeit risk and limited cold chain, although Gulf countries invest in modern dairy and poultry complexes that specify vetted suppliers. South America’s export-oriented beef and poultry chains depend on traceability-compliant therapeutics, with Brazil shipping 2.1 million t of beef in 2024 under strict residue surveillance.
Regulatory Landscape
Veterinary drug regulation remains anchored in stringent safety, efficacy, and residue-control requirements that affect development timelines and post-market obligations across major regions. In the European Union, Regulation (EU) 2019/6 governs authorization, manufacturing, distribution, and pharmacovigilance for veterinary medicinal products, and market access is increasingly tied to structured transparency tools such as the Union Product Database (UPD), which centralizes authorized products across the EU/EEA.
In the United States, the FDA Center for Veterinary Medicine (CVM) oversees new animal drugs and generics under user-fee frameworks (ADUFA/AGDUFA), with FY 2026 fee rates applying from October 1, 2025, through September 30, 2026. Cross-jurisdiction development alignment is supported through the EMA-FDA Parallel Scientific Advice program, which helps sponsors discuss data packages with both agencies and reduce duplicative work. The FDA also continued routine rulemaking updates in February 2026 to incorporate approval, withdrawal, and sponsorship changes that occurred during Q3 2025.
Competitive Landscape
The global veterinary drugs market features a moderately concentrated competitive structure, where the five largest manufacturers hold a majority share while still competing with hundreds of regional formulators serving price-sensitive niches. Multinational leaders Zoetis, Elanco, Boehringer Ingelheim, Merck Animal Health, and Ceva Santé Animale anchor their advantage in integrated discovery pipelines, multi-species portfolios, and worldwide distribution footprints that shorten launch curves. Second-tier companies, including Vetoquinol and Virbac, focus on dermatology, parasitology, and companion-animal nutrition to secure differentiated channels that escape direct price competition with broad-spectrum anti-infectives. The rise of biosimilars is already compressing margins for first-generation monoclonal antibodies in Europe, where patent cliffs start in 2028, and local manufacturers can file abbreviated dossiers under the EMA’s streamlined biologics path.
Strategic innovation now gravitates toward biologics and precision-dosing technologies that reduce total antimicrobial use without sacrificing productivity. In 2024, Zoetis unveiled a single-shot, mRNA-based swine vaccine that can be re-sequenced within eight weeks when field strains shift, demonstrating platform agility that small manufacturers struggle to replicate. Elanco allocated 38% of its USD 680 million R&D budget to next-generation biologics, including recombinant cytokines for bovine respiratory disease and a Phase III monoclonal antibody for canine osteoarthritis that targets nerve growth factor pathways. Boehringer Ingelheim continues to extend its long-acting cattle parasiticide line by combining macrocyclic lactone bases with proprietary microsphere carriers that stretch efficacy to 120 days, trimming labor inputs on large feedlots.
Mergers, licensing agreements, and venture investments illustrate rising capital intensity. Ceva’s 2025 acquisition of the Swedish biotech SVAx, which owns a bacteriophage library for salmonella control in poultry, positions the firm to capitalize on antibiotic-reduction mandates in the EU and North America. Merck Animal Health’s minority stake in Aquabyte, an AI-based fish-health monitoring platform, integrates real-time biometric feeds with prescription triggers, inching the market toward outcome-based contracting models. Meanwhile, Asian generic makers in India and China are scaling U.S. FDA-approved facilities that churn out florfenicol and tylosin at cost points 15-20% below Western averages, intensifying price erosion in commodity molecules. Across all tiers, supply-chain authenticity remains a reputational differentiator, and firms invest heavily in serialization and blockchain pilots that certify origin and cold-chain integrity for high-value biologics.
Veterinary Drugs Industry Leaders
-
Merck Animal Health
-
Ceva Santé Animale
-
Zoetis Inc.
-
Elanco Animal Health
-
Boehringer Ingelheim International GmbH
- *Disclaimer: Major Players sorted in no particular order
Veterinary Drugs Market Companies Covered in this Report
- Bayer Animal Health
- Bimeda Holdings
- Boehringer Ingelheim
- Ceva Santé Animale
- Chanelle Pharma
- Dechra Pharmaceuticals
- Elanco
- Huvepharma
- IDEXX
- Intas Pharmaceuticals
- Merck
- Norbrook Laboratories
- PetIQ
- Phibro Animal Health
- Vetoquinol
- Virbac
- Zoetis
Market Opportunities and Future Outlook
Preventive platforms and faster-response biologics create whitespace where disease notifications and rapid strain shifts compress time-to-market. The FDA cited 24 new animal drug approvals in 2024, and the report highlights mRNA platforms that shorten development timelines. This supports opportunities for manufacturers that can update antigens quickly and scale batch release for livestock programs, and it keeps autogenous and region-specific vaccines in focus as a manufacturing-led route to supply emergent field strains.
A second opportunity area centers on premium companion-animal therapeutics and diagnostics-enabled prescribing, supported by measurable behavior shifts in developed markets. In the United States, 72% of dog owners purchased at least one elective preventive-care service in 2024, companion-animal insurance reached 4.8 million policies by mid-2025, and tele-consultations exceeded 9.2 million in 2024. Together, these trends expand access, improve refill compliance, and make specialty products easier to dispense through hospital-linked and online channels. At the same time, antimicrobial stewardship continues to redirect R&D and portfolio mix toward vaccines, immunomodulators, and non-antibiotic modalities, particularly as EU antimicrobial sales fell 23% between 2021 and 2024 under tighter controls and e-prescription mandates.
Recent Industry Developments in Veterinary Drugs Market
- July 2026: Zoetis announced a definitive agreement to acquire VitalRADS, a veterinary teleradiology services platform. The agreement expands Zoetis capabilities around remote diagnostics and specialist interpretation, reinforcing the diagnostics and digital-services layer that increasingly influences prescribing and treatment pathways.
- June 2026: Merck Animal Health announced a definitive agreement to acquire TARGAN, a developer of poultry biodevice technologies, including automated chick sex-sorting and vaccine ocular spray systems. Adding device-based automation broadens Merck Animal Health's poultry portfolio beyond pharmaceuticals and supports integrated health and productivity workflows at hatchery and farm levels.
- December 2025: Elanco announced a USD 400 million investment in U.S. manufacturing and R&D operations, including expansion tied to a Kansas monoclonal antibody facility. The spending supports scale-up and supply resilience for higher-value biologics, aligning capacity with the growing role of monoclonal antibodies and other advanced therapeutics in companion and livestock indications.
Veterinary Drugs Market Report Scope and Research Methodology
Market Definition and Coverage
For this study, the veterinary drugs market is defined as revenues generated from medicines and biologics used to prevent, manage, or treat diseases in animals across the major care settings and distribution channels.
Scope exclusions: We exclude veterinary services, diagnostic tests, and nutrition-only products that are not regulated or sold as animal drugs.
Segments Covered in This Report
- By Product Type
- Anti-infectives
- Parasiticides
- Vaccines
- Anti-inflammatory
- Hormones
- Other Product Types
- By Route of Administration
- Oral
- Parenteral
- Topical
- Other Route of Administration
- By Animal Type
- Livestock
- Cattle
- Poultry
- Swine
- Sheep & Goats
- Aquaculture
- Companion Animals
- Dogs
- Cats
- Horses
- Other Pets
- Livestock
- By Distribution Channel
- Veterinary Hospitals
- Veterinary Clinics
- Pharmacies
- Online Retail
- Other Distribution Channels
- By Geography
- North America
- United States
- Canada
- Mexico
- Europe
- Germany
- United Kingdom
- France
- Italy
- Spain
- Rest of Europe
- Asia-Pacific
- China
- India
- Japan
- Australia
- South Korea
- Rest of Asia-Pacific
- Middle East and Africa
- GCC
- South Africa
- Rest of Middle East and Africa
- South America
- Brazil
- Argentina
- Rest of South America
- North America
Data Sources, Market Sizing, and Validation
Desk Research
Desk research is used to build the starting structure for the model and to keep assumptions tied to observable animal health demand. We review public sources such as US FDA Center for Veterinary Medicine updates, European Medicines Agency veterinary medicines information, WOAH disease situation reports, and livestock and animal population statistics from sources such as FAOSTAT.
To make regional splits and product mix more realistic, we also rely on sources such as national agriculture ministries and where relevant, customs and trade statistics, peer-reviewed veterinary pharmacology and epidemiology journals, and company annual reports and investor presentations. For cross-checking market participation and timelines, we selectively use paid subscriptions for company financials and intelligence, news and financials, and patent databases. The sources listed here are illustrative, and many other public references were used for data collection, validation, and clarification.
Primary Interviews and Surveys
Primary work focuses on validating how products are actually adopted and purchased across companion animals and livestock, and how this changes by region and care setting. We speak with a mix of manufacturers, distributors, veterinary clinics and hospitals, and experienced veterinarians, and then use follow-ups to confirm pricing logic, route-of-administration mix, and the pace of new product uptake across APAC, EMEA, and the Americas.
Distribution of primary research fieldwork respondents
| Company type | Respondent position | Region |
|---|---|---|
| Top tier: 27% | CXOs: 13% | APAC: 42% |
| Mid tier: 58% | Functional/Unit leaders: 34% | EMEA: 31% |
| Smaller Players: 15% | Managers: 53% | Americas: 27% |
Market-Sizing & Forecasting
Sizing starts with a top-down build that reconstructs demand from the treated animal pool and care intensity, and then it is translated into spend using pricing and product mix. For example, country-level animal populations and production volumes are combined with disease incidence and prevention practices to estimate likely treatment volumes across major therapeutic classes.
Those totals are then stress-tested with selective bottom-up approximations, such as sampled average selling price by route of administration (oral, parenteral, topical), distributor and channel markups, and roll-ups from a tracked set of visible suppliers in key countries. Where data gaps appear, we use proxy variables, such as veterinary visit rates, vaccination and deworming schedules, and regulatory approval activity that signals product availability, and then we recheck assumptions with primary respondents.
For forecasting, we use multivariate regression supported by scenario checks, since growth is linked to a few repeatable drivers. Inputs typically include companion animal ownership trends, livestock herd and flock trends, shifts in preventive care, antimicrobial stewardship policies that change class mix, and inflation-adjusted pricing movement by route and channel. The forecast is adjusted when expert feedback indicates faster uptake of long-acting formulations or slower adoption due to regulatory or reimbursement changes.
Data Validation & Update Cycle
Outputs are validated through triangulation across independent signals, and variances are investigated before figures are finalized. We compare implied per-animal spend and per-visit drug intensity against regional benchmarks, then review outliers at the country and product-class level to confirm that no category is double counted.
Before sign-off, the model is reviewed in steps, including unit checks, FX and inflation checks, and consistency checks between historical trends and forecast drivers. Reports are refreshed annually, and interim updates are triggered when material events occur, such as major regulatory approvals, large outbreaks affecting treatment patterns, or sharp currency moves. Right before delivery, a fresh analyst pass is completed so clients receive an updated view based on the latest available information.
Mordor Intelligence's Veterinary Drugs Market Size Measured Against Other Published Estimates
Published market sizes for veterinary drugs often differ because each publisher draws the scope line differently and uses its own mix of demand indicators and pricing logic. Differences also show up due to base year choice, currency conversion timing, and how quickly assumptions are refreshed after new approvals and policy shifts.
Some public estimates bundle medicated feed additives and broader animal health products into the total, and that naturally pushes the number up. In Mordor Intelligence sizing, the total is kept to veterinary drugs as defined in the coverage, and adjacent categories are not added unless they are clearly sold and regulated as animal drugs in the counted channels.
Benchmark comparison
| Source | Market Size | Gaps in Research Methodology |
|---|---|---|
| Mordor Intelligence | USD 34.72 B (2026) | |
| Market Analytics Publisher A | USD 53.10 B (2024) | The scope is broader by including medicated feed additives alongside pharmaceuticals and biologics, and the earlier base year can also amplify the total when nominal pricing is elevated. |
| Industry Publisher B | USD 30.54 B (2025) | The figure appears narrower due to base-year framing and category interpretation that can undercount biologics or certain channels when definitions focus mainly on therapeutic drug classes and standard dispensing routes. |
The spread across the three values is mostly explained by what gets counted inside the market and when the market is measured. By keeping inputs tied to treated animal demand, route and channel mix, and repeatable price checks, we aim to deliver a practical number that can be traced back to clear assumptions and updated in a consistent way.
Key Questions Answered in the Report
What is the projected value of global veterinary drug sales by 2031?
The market is forecast to reach USD 48.31 billion by 2031.
Which therapeutic class is growing fastest?
Vaccines are advancing at an 8.25% CAGR, outpacing all other categories.
Why are long-acting injectables attracting interest?
They cut labor costs by stretching dosing intervals from weekly to quarterly while maintaining therapeutic coverage.
Which region is expected to log the highest growth rate?
Asia-Pacific is poised for a 7.22% CAGR through 2031, propelled by livestock intensification and rising pet ownership.
How are residue regulations influencing product strategy?
Stewardship rules reduce prophylactic antibiotic volumes, pushing R&D investment toward biologics, bacteriophages, and immunomodulators.
What share do online pharmacies currently command?
Although veterinary hospitals remain dominant, online retail channels are expanding at an 8.32% CAGR and rapidly gaining share.