
Market Overview
| Study Period | 2021 - 2031 |
|---|---|
| Forecast Data Period | 2026 - 2031 |
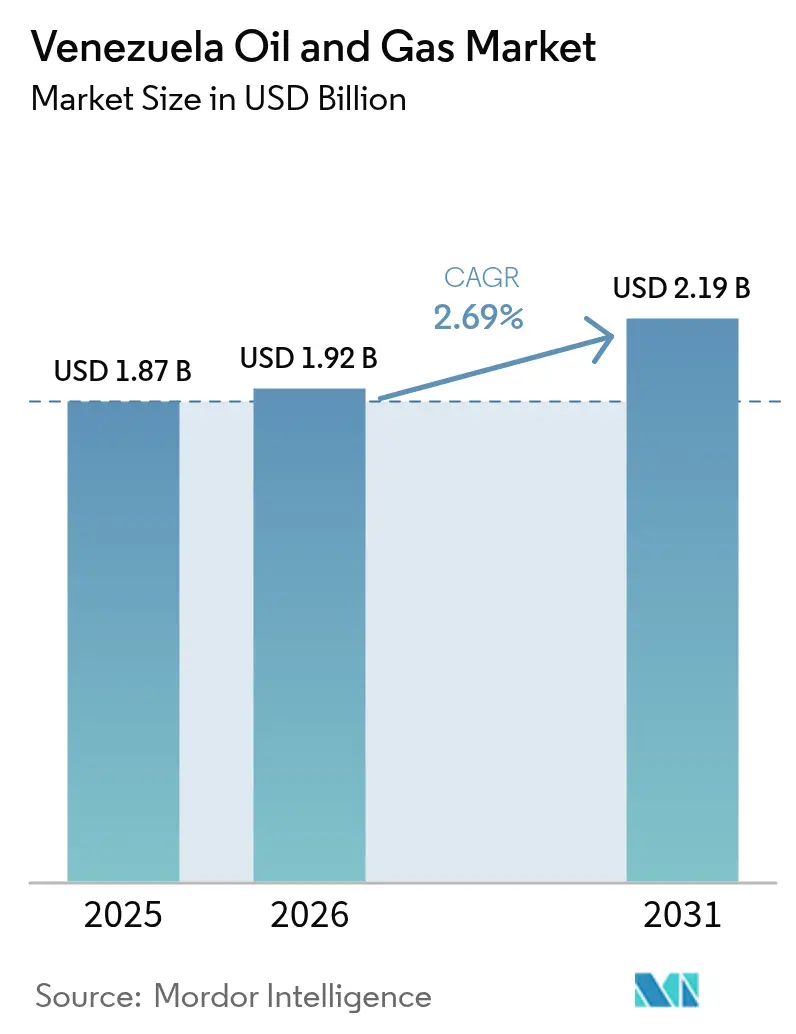
| Base Year Market Size (2025) | USD 1.87 Billion |
| Market Size (2026) | USD 1.92 Billion |
| Market Size (2031) | USD 2.19 Billion |
| Growth Rate (2026 - 2031) | 2.69 % |
| Market Concentration | High |
Major Players *Disclaimer: Major Players sorted in no particular order Image © Mordor Intelligence. Reuse requires attribution under CC BY 4.0. | |
Venezuela Oil And Gas Market Analysis by Mordor Intelligence
The Venezuela Oil And Gas Market size was valued at USD 1.87 billion in 2025 and estimated to grow from USD 1.92 billion in 2026 to reach USD 2.19 billion by 2031, at a CAGR of 2.69% during the forecast period (2026-2031).
Modest growth reflects the friction between one of the world’s largest hydrocarbon endowments and persistent capital, infrastructure, and policy hurdles. Production exceeded 1 million barrels per day in January 2025 for the first time since 2019; however, recurring facility outages and sanction-driven financing gaps have kept output well below historical peaks. Offshore gas discoveries, heavy-crude price spreads that favor Merey barrels, and conditional U.S. licence windows underpin incremental upside, while chronic under-investment and diluent shortages curb operational reliability. International joint ventures now prioritize low-cost, high-impact workovers and enhanced oil recovery pilots over greenfield megaprojects, a strategy that maximizes near-term barrels while mitigating sanction risk. The Venezuela oil and gas market, therefore, pivots on selective partnership access, evolving U.S. policy, and the speed of infrastructure rehabilitation.
Key Report Takeaways
- By sector, upstream led with an 82.35% share of the Venezuelan oil and gas market in 2025, while midstream recorded the highest projected CAGR of 3.02% through 2031.
- By location, onshore captured 87.10% of the Venezuelan oil and gas market size in 2025; offshore is expected to expand at a 4.86% CAGR between 2026 and 2031.
- By service, construction commanded 59.72% of the Venezuela oil and gas market size in 2025, whereas maintenance and turnaround is forecast to grow at 4.21% CAGR over the same horizon.
Note: Market size and forecast figures in this report are generated using Mordor Intelligence’s proprietary estimation framework, updated with the latest available data and insights as of 2026.
Market Trends and Insights
Drivers Impact Analysis of Venezuela Oil And Gas Market*
| Driver | (~) % Impact on CAGR Forecast | Geographic Relevance | Impact Timeline |
|---|---|---|---|
| Vast proven extra-heavy & offshore reserves | +0.8% | Global, with primary focus on Orinoco Belt and Caribbean offshore | Long term (≥ 4 years) |
| Conditional US-licence windows & selective sanction relief | +0.6% | Global, with direct impact on North America and EU partnerships | Medium term (2-4 years) |
| High global heavy-crude price differentials | +0.4% | Global, with strongest impact on APAC and North American refiners | Short term (≤ 2 years) |
| New BP-NGC/Shell offshore gas licences (Cocuina-Manakin, Dragon) | +0.3% | Caribbean region, with spillover to Trinidad & Tobago and regional gas markets | Medium term (2-4 years) |
| CCS-enabled EOR pilots to boost Orinoco recovery factors | +0.2% | National, with early gains in Anzoátegui, Monagas, and Bolívar states | Long term (≥ 4 years) |
| Productive-participation contracts opening sector to non-state capital | +0.5% | Global, with primary interest from APAC, EU, and select Middle Eastern investors | Medium term (2-4 years) |
| Source: Mordor Intelligence | |||
Vast Proven Extra-Heavy & Offshore Reserves
An estimated 300 billion barrels of proven crude oil and 196 trillion cubic feet of natural gas underpin long-term supply potential.[1] Development remains concentrated in the Orinoco Belt, where API gravity averages 7-10 degrees and steam-assisted gravity drainage trials lift recovery factors by up to 10 percentage points. Renewed interest in the Querecual Formation could extend play fairways toward Trinidad, Guyana, and Suriname, opening multi-asset portfolios for integrated majors.
Conditional U.S.-Licence Windows & Selective Sanction Relief
After General Licence 44 lapsed in April 2024, Washington adopted case-by-case authorizations that privilege incumbents such as Chevron, Schlumberger, and Baker Hughes.[2] Licensed operators export crude directly to the U.S. Gulf Coast, swap diluent cargoes, and repatriate debt payments, providing a competitive moat. New entrants face protracted compliance vetting and political linkage to Venezuelan electoral milestones, which lengthen deal cycles and deter Asian upstream bidders.
High Global Heavy-Crude Price Differentials
The Merey-Brent discount widened to USD 22 per barrel in March 2025 but narrowed to USD 15 once OPEC+ cut medium-sour output, enhancing netbacks for Venezuelan cargoes at coker-equipped refineries in Texas, Shandong, and Gujarat. The structural spread mitigates spot price volatility; during market tightness, discounts compress more quickly than benchmark gains, thereby cushioning revenue.
New BP-NGC / Shell Offshore Gas Licences (Cocuina-Manakin, Dragon)
Shell’s Dragon and BP-NGC’s Cocuina-Manakin aim for a combined plateau of 850 million cubic feet per day by 2028, enough to displace diesel-fired power and re-inject gas for heavy-oil lifting. Both operators demand multi-year U.S. waivers before sanctioning final investment decisions, underscoring licence risk as a gating item for Venezuelan offshore expansion.
Restraints Impact Analysis of Venezuela Oil And Gas Market*
| Restraint | (~) % Impact on CAGR Forecast | Geographic Relevance | Impact Timeline |
|---|---|---|---|
| Re-tightening US sanctions & secondary tariffs on buyers | -0.7% | Global, with strongest impact on North America and EU market access | Short term (≤ 2 years) |
| Chronic under-investment & ageing infrastructure | -0.4% | National, with critical gaps in Zulia, Anzoátegui, and offshore facilities | Long term (≥ 4 years) |
| Diluent shortages for heavy-oil upgrading | -0.3% | National, with acute impact on Orinoco Belt operations and export terminals | Medium term (2-4 years) |
| Skilled-workforce flight & technical brain drain | -0.2% | National, with spillover effects limiting technology transfer partnerships | Long term (≥ 4 years) |
| Source: Mordor Intelligence | |||
Re-tightening U.S. Sanctions & Secondary Tariffs on Buyers
Washington reinstated crude-sales restrictions in mid-2024, compelling traders to re-flag tankers and reroute cargoes through Asia. Shipping insurers now demand premium surcharges of 30-40% for Venezuelan liftings, crowding out smaller refiners. Secondary enforcement chills European spot purchases despite refinery demand for heavy feedstock.
Chronic Under-Investment & Ageing Infrastructure
The average age of field equipment has surpassed 32 years, compared to a global mean of 18 years, driving recurrent fires at the José Antonio Anzoátegui upgraders and three pipeline ruptures along the Eastern Duct in 2024-2025.[3] Capital expenditure cuts of 15% in PDVSA’s 2025 budget exacerbate deferred maintenance backlogs.
*Our forecasts treat driver/restraint impacts as directional, not additive. The impact forecasts reflect baseline growth, mix effects, and variable interactions.
Venezuela Oil And Gas Market Segment Analysis
By Sector:
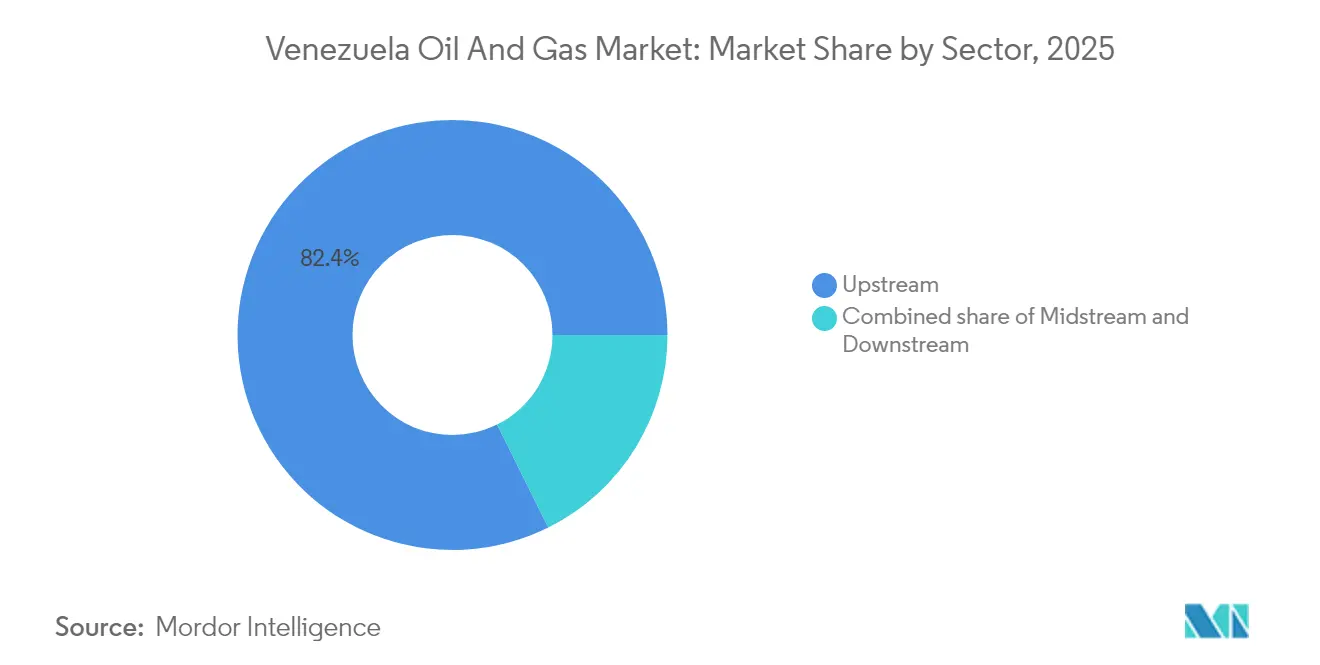
Upstream Dominance Drives Market StructureThe upstream segment held an 82.35% market share in Venezuela's oil and gas market in 2025, accounting for USD 1.54 billion within the overall market size, and is projected to grow at a 2.86% CAGR through 2031. Cost-effective work-overs, sand-control programs, and CCS-assisted steam cycles underpin incremental barrel additions that offset natural declines. Midstream pipelines handle approximately 1.1 million barrels per day of liquids, but average 68% utilization due to leak-related downtime. Downstream refining averaged 134,000 barrels per day in 2024, far below the 1.3 million barrels per day nameplate capacity, underscoring deferred turnarounds and catalyst shortages.
International partners anchor upstream gains. Chevron's four ventures pumped 200,000 barrels per day in 2025, Repsol's mixed asset produced 20,000 barrels of oil and 40 million cubic feet of gas per day, while Eni's Junín-5 maintained 50,000 barrels per day despite upgrader constraints. Midstream spending prioritizes leak detection and fiber-optic monitoring to cut spill incidents by 30% before 2028. Downstream upgrades focus on vacuum distillation and delayed coking revamps to improve product yields and comply with the IMO 2020 sulfur rules, but financing gaps persist, given USD 3.6 billion rehabilitation cost estimates.

By Location:
Onshore Operations Anchor Current ActivityOnshore fields captured 87.10% Venezuela's oil and gas market share in 2025 and produced 930,000 barrels per day of liquids, whereas offshore output stood at 130,000 barrels per day. The onshore dominance results from legacy surface networks, available rigs, and shorter drilling lead times. However, offshore shows the highest growth, with a 4.86% CAGR forecast that could raise gas supply to 1.2 billion cubic feet per day by 2031.
The Orinoco Belt's four strategic blocks—Boyacá, Junín, Ayacucho, and Carabobo—drive onshore momentum via steam-generation plants and dilution facilities. Meanwhile, the Plataforma Deltana and Blanquilla-Tortuga offshore areas remain lightly explored, with only six wells having been drilled since 2015. New 2D seismic, covering 50,000 kilometers, was completed in April 2025 and has promoted licensing interest from Shell, Equinor, and Woodside Energy. Cross-border gas evacuation to Trinidad's Atlantic LNG offers early monetization, lowering break-even costs to USD 3.10 per MMBtu compared to USD 4.60 for stand-alone Venezuelan LNG.
By Service:
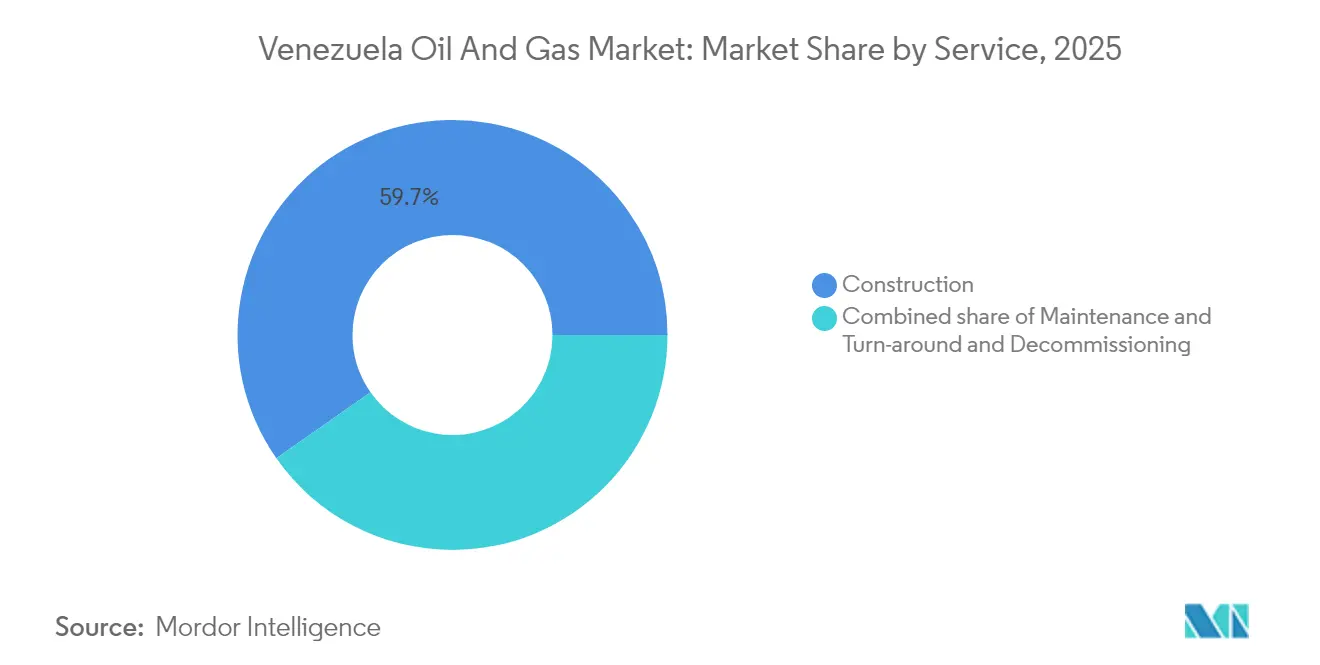
Construction Leads Infrastructure RehabilitationConstruction represented 59.72% of the 2025 service value pool, equating to USD 1.12 billion within the Venezuela oil and gas market size. Scope centers on well-pad expansions, upgrader flare-gas recovery units, and pipeline sleeve replacements. Maintenance and turnaround services are projected to grow at the fastest rate of 4.21% CAGR through 2031, driven by mandatory integrity checks following the Muscar gas complex fire.
Schlumberger, Baker Hughes, Halliburton, and Weatherford continue under General Licence 8M, executing coiled-tubing stimulations, ESP retrofits, and digital twins for surface facilities. Predictive analytics trim unscheduled downtime 12% year-on-year in pilot assets, highlighting a pivot from reactive to preventive maintenance. Decommissioning remains nascent but could unlock USD 140 million annual spend after 2028 as mature Maracaibo wells reach economic limit.
Geography Analysis
Eastern Venezuela hosts 74% of proven reserves and 65% of active wells, yet relies on 1,200-kilometer pipelines that experienced three spill events in 2024. The region’s 2026 output averages 730,000 barrels per day and is expected to rise to 810,000 barrels per day by 2031, contingent upon stable diluent flows. Western Zulia contributes 200,000 barrels per day but declines at a rate of 6% annually, despite implementing water-flood programs, underscoring its maturity.
Caribbean offshore acreage emerges as a growth pole following Shell’s 30-year Dragon field licence and BP-NGC’s Cocuina-Manakin deal that straddles the maritime boundary with Trinidad. First gas is slated for 2026, feeding Trinidad’s Atlantic LNG Train 1 and freeing 120 MW of Venezuelan power currently generated on diesel. Upstream risk is lower relative to Orinoco heavy oil because offshore gas benefits from lighter reservoirs, lower lifting costs, and regional LNG demand.
Trade flows have re-oriented eastward. In 2024, China absorbed 68% of crude exports, India 13%, and the U.S. 23% under Chevron’s licence shipments. Longer voyages raise freight costs, but firm Asian demand for heavy feed consolidates baseline export volumes. Spain and Italy marginally resume offtake under EU humanitarian exemptions, receiving 4% of barrels. Meanwhile, Caribbean neighbors import Venezuelan LPG and naphtha swaps, anchoring regional integration prospects.
Regulatory Landscape
Venezuela's hydrocarbons sector is regulated by the Ministry with competence in hydrocarbons matters. It sets sector policy and provides fiscal and technical oversight across exploration, production, refining, and commercialization, while PDVSA retains statutory control over upstream acreage. A major regulatory reset was enacted in 2026 through the Ley de Reforma de la Ley Organica de Hidrocarburos, published in Gaceta Oficial No. 6.978 on January 29, 2026, followed by the Reglamento de la Ley Organica de Hidrocarburos issued under Decree No. 5.381 and published in Gaceta Oficial No. 7.052 on July 7, 2026.
The 2026 regulations update technical, operational, and fiscal rules, replacing legacy regulations dating to 1943 and 1969. They also add compliance requirements around measurement and official fiscal metering, and introduce technology-oriented obligations such as systems for monitoring and controlling GHG emissions (including flaring and venting) and energy-efficiency standards. These changes affect project design, reporting, and the scope of service work executed by joint ventures and contractors.
Competitive Landscape
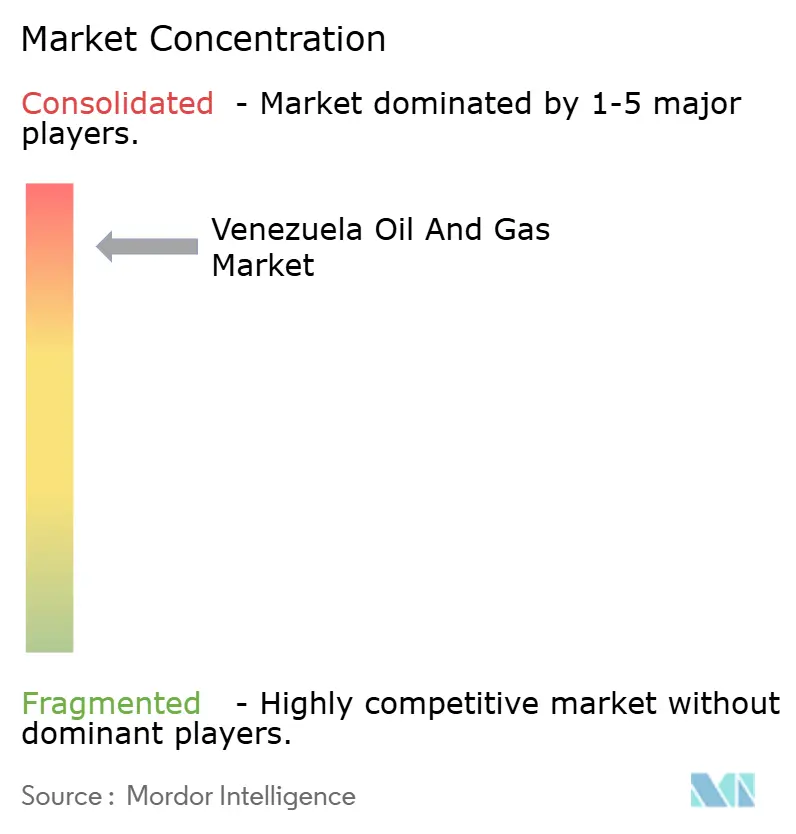
PDVSA retains statutory control of upstream acreage; however, operational leadership is increasingly driven by joint ventures. Chevron features in four core projects, controlling 40% of 2024 JV volumes. Spanish firm Repsol holds 11% JV share, while Italy’s Eni manages 8%. Collectively, the top four entities account for 68% of the output, reflecting a high concentration.
Recent strategic moves include Chevron and PDVSA’s bid for a 15-year Petropiar extension, which requires a USD 2.39 billion capital expenditure to increase production by 40,000 barrels per day. Shell is negotiating a 25-year gas marketing agreement linked to Dragon, contingent upon U.S. license renewal beyond the current one-year term. Meanwhile, CNPC mothballed Sinovensa Phase 4 after sanctions disrupted equipment imports, demonstrating how compliance risk shapes competitive positioning.
Technology adoption emphasizes steam-assisted gravity drainage and polymer-augmented water floods. Halliburton pilots digital well surveillance and fiber-optic pipeline monitoring under cyber-isolation architectures that satisfy U.S. export-control rules. Smaller independents seek productive-participation contracts under the Anti-Blockade Law, offering tariff-free importation of modular upgrading skids in exchange for rapid-cycle field restarts.
Venezuela Oil And Gas Industry Leaders
-
Petróleos de Venezuela S.A
-
Chevron Corporation
-
NK Rosneft PAO
-
China National Petroleum Corporation
-
Eni SpA
- *Disclaimer: Major Players sorted in no particular order
Venezuela Oil And Gas Market Companies Covered in this Report
- Petróleos de Venezuela S.A. (PDVSA)
- Chevron Corp.
- TotalEnergies SE
- NK Rosneft PAO
- Repsol SA
- Eni SpA
- China National Petroleum Corp. (CNPC)
- China Petroleum & Chemical Corp. (Sinopec)
- ONGC Videsh Ltd.
- BP plc
- Shell plc
- Maurel & Prom
- Belorusneft
- Schlumberger NV
- Baker Hughes Co.
- Weatherford Intl.
- Halliburton Co.
- Reliance Industries Ltd.
- NGC (Trinidad & Tobago)
- Gazprom PJSC
Market Opportunities and Future Outlook
Near-term whitespace is concentrated in unlocking incremental barrels and improving reliability from existing onshore heavy-oil assets. Joint ventures have shifted toward workovers, enhanced oil recovery pilots, and targeted debottlenecking rather than greenfield megaprojects. In 2026, Chevron's asset swap with PDVSA illustrates this positioning, as it increased Chevron's stake in Petroindependencia to 49% and secured development rights linked to Ayacucho 8, while relinquishing positions in offshore Plataforma Deltana blocks.
A second opportunity track is capability and data modernization to improve recovery and reduce unplanned downtime. Government programs and vendor commitments support this direction, including the June 2026 inauguration of a Hydrocarbons Technology and Data Management Center to centralize geoscientific information and deploy AI for production efficiency, and an MoU in June 2026 between SLB and PDVSA focused on digital transformation, AI-enabled workflows, and workforce development. On the market-access side, the July 2026 publication of the Hydrocarbons Law regulation, alongside reported national crude oil output of 1.203 million barrels per day, provides a clearer operating context for structured partnerships and service demand tied to measurement, emissions monitoring, and integrity management across pipelines, upgraders, and mature fields.
Recent Industry Developments in Venezuela Oil And Gas Market
- April 2026: Chevron agreed an asset swap with PDVSA that increased its stake in Petroindependencia to 49% and secured rights for Petropiar to develop the Ayacucho 8 area in the Orinoco Oil Belt. The transaction also involved Chevron surrendering interests in offshore Plataforma Deltana Blocks 21 and 32 and a non-operated interest in Petroindependiente. The reshuffling concentrates Chevron's Venezuela exposure on heavy-oil ventures where brownfield investment and debottlenecking can translate into nearer-term volumes under licensing constraints.
- May 2025: Chevron and European partners lobbied to preserve their stakes and operating continuity in Venezuela joint ventures amid shifting US sanctions and licensing conditions. The developments reinforced the importance of compliant structures for financing, liftings, and service execution, shaping how operators plan work programs and contract with oilfield service providers. Policy sensitivity continues to determine which projects advance versus those deferred or redesigned.
- June 2024: Venezuela's National Assembly began deliberating a proposal to extend a contract between PDVSA and Chevron potentially through 2047. The discussion pointed to the state's interest in longer-duration frameworks to sustain investment and operations, which is especially relevant for heavy-oil developments that depend on sustained maintenance, diluent logistics, and upgrader reliability. The contract-extension debate also affected counterparties' planning for capital deployment and service procurement cycles.
Venezuela Oil And Gas Market Report Scope and Research Methodology
Market Definition and Coverage
This market is sized as the value of oil and gas industry activity in Venezuela across upstream, midstream, and downstream, including the key service work linked to these assets (construction, maintenance and turn-around, and decommissioning).
Scope exclusions: This sizing does not treat unrelated power generation, mining, or other non-hydrocarbon energy activity as part of the market.
Segments Covered in This Report
- By Sector
- Upstream
- Midstream
- Downstream
- By Location
- Onshore
- Offshore
- By Service
- Construction
- Maintenance and Turn-around
- Decommissioning
Data Sources, Market Sizing, and Validation
Desk Research
Desk research was used to build the first version of the model and to lock down the boundaries of what is counted for Venezuela. We relied on public energy balances and petroleum statistics such as those released by OPEC, the US EIA, and IEA summaries, and then cross-checked them with customs and trade flows from UN Comtrade style datasets where coverage was available.
To keep assumptions grounded, we also reviewed official releases and regulatory signals from government and central bank publications, alongside technical references such as peer-reviewed petroleum engineering papers and relevant patent databases for activity cues. Company filings, investor presentations, and reputable press reporting were then used to time major project moves, maintenance cycles, and facility changes, supported by paid subscriptions for company financials and another for shipment-level import and export checks. The sources listed here are illustrative only, and many additional public documents were reviewed to collect, validate, and clarify inputs.
Primary Interviews and Surveys
Our primary research uses expert interviews and surveys with CXOs, functional/unit leaders, and managers involved in Venezuelan production, processing, logistics, services, and regulation. These discussions test secondary volumes, price assumptions, project timing, policy effects, and gaps in public reporting. Survey feedback helps us triangulate the model and settle the final estimate.
Distribution of primary research fieldwork respondents
| Company type | Respondent position |
|---|---|
| Top tier: 28% | CXOs: 17% |
| Mid tier: 47% | Functional/Unit leaders: 31% |
| Smaller Players: 25% | Managers: 52% |
Market-Sizing & Forecasting
Sizing starts from a top-down reconstruction that uses Venezuela production and processing signals as the demand pool, then applies activity-to-spend ratios reflecting upstream, midstream, and downstream realities. The totals are subsequently corroborated using selective bottom-up approximations, such as sampled project and service pricing, indicative volumes by activity type, and channel checks on what work is actually being executed.
Inputs that materially shape the model include crude and gas production levels, onshore versus offshore activity mix, refinery utilization and turnaround patterns, pipeline and terminal throughput indicators, and the timing of field redevelopment or decommissioning work. Where direct spend data was missing, gaps were handled using proxy variables such as activity counts, utilization bands, and range-based unit costs, which were tightened using interview feedback.
For forecasting, scenario analysis was applied around the sanctions environment, access to diluents and imports, and operational continuity, then a smoothing step was used to avoid unrealistic year-to-year jumps. The final outlook was adjusted only after experts confirmed the direction and likely pace of changes in production, maintenance intensity, and project execution.
Data Validation & Update Cycle
Model outputs are checked against independent signals, including production trends, utilization markers, and trade flow changes that would typically show up if the market was expanding or shrinking faster than expected. When a variance looks large, the assumptions are revisited, and targeted follow-ups are triggered with industry contacts to confirm whether the change is real or driven by data timing.
Before sign-off, the workbook goes through multi-step reviews that recheck calculations, unit conversions, and scope alignment, and then the narrative is aligned to the validated numbers. Reports are refreshed annually, and interim updates are made when material events occur, followed by a final pre-delivery scan so the latest available information is reflected.
Mordor Intelligence's Venezuela Oil and Gas Market Size Measured Against Other Published Estimates
Published market sizes for Venezuela oil and gas can look far apart because not everyone counts the same activities, and even the same label can mask different boundaries. Differences usually come from what gets included beyond core oil and gas operations, the year and currency timing used, and how production and utilization signals are translated into spend.
Production trends, onshore versus offshore splits, and refinery utilization checks are the evidence points that keep Mordor Intelligence's estimate tied to in-country upstream, midstream, and downstream activity plus defined service work, instead of being inflated by crude export value or broader energy revenue totals.
Benchmark comparison
| Source | Market Size | Gaps in Research Methodology |
|---|---|---|
| Mordor Intelligence | USD 1.87 B (2025) | |
| Global Consultancy A | USD 18.70 B (2026) | This figure appears to treat the market closer to sector revenue scale, which can fold in the value of produced and exported hydrocarbons and other integrated activities, rather than separating asset activity and defined service spend inside Venezuela. |
| Industry Publisher B | USD 17.50 B (2024) | This number aligns more with reported oil sales abroad, which behaves like a trade and pricing measure and can swing with crude prices and lifting volumes, instead of tracking domestic operational activity and service intensity. |
The spread in the table is mainly explained by whether the estimate is built from operational activity signals or from oil sales and broader revenue measures. By anchoring the model to production, utilization, and activity-linked service work, the final market size stays easier to reproduce and to track year over year using clear inputs.
Key Questions Answered in the Report
What is the current value of the Venezuela oil and gas market?
It stands at USD 1.92 billion in 2026 and is projected to grow to USD 2.19 billion by 2031.
How fast is Venezuelan offshore gas expected to grow?
Offshore activities are forecast to register a 4.86% CAGR through 2031, supported by the Dragon and Cocuina-Manakin projects.
Which segment holds the largest share of sector spending?
Upstream activities command 82.35% of 2025 spending, underscoring the dominance of extraction over mid- and downstream operations.
How significant are U.S. sanctions to investment decisions?
Sanctions shape licence availability; firms with active OFAC authorizations enjoy preferential access, while newcomers face extended compliance reviews.
What role does heavy-crude pricing play in Venezuela’s exports?
Merey barrels typically trade USD 15-22 below Brent, yet the discount narrows in tight markets, offering a natural hedge against price swings.
Which service segment is growing the fastest?
Maintenance and turnaround services lead with a projected 4.21% CAGR as operators prioritize reliability and safety upgrades.