
Variable Rate Technology Market Size and Share
Market Overview
| Study Period | 2021 - 2031 |
|---|---|
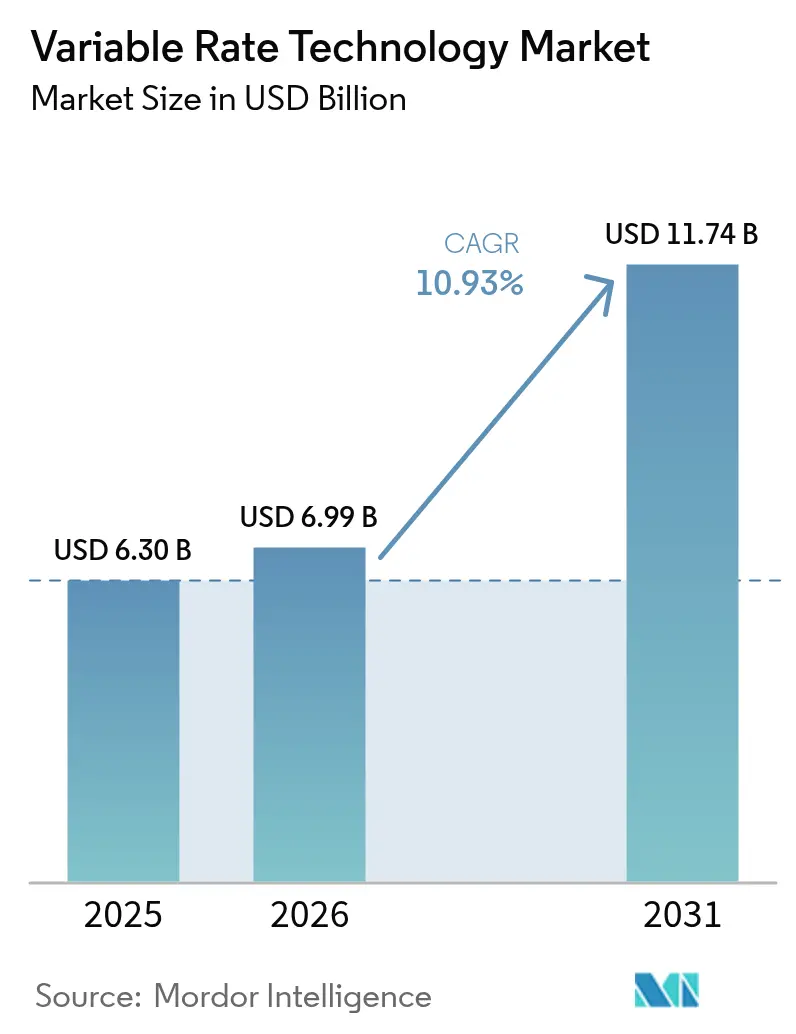
| Market Size (2026) | USD 6.99 Billion |
| Market Size (2031) | USD 11.74 Billion |
| Growth Rate (2026 - 2031) | 10.93 % |
| Fastest Growing Market | Asia Pacific |
| Largest Market | North America |
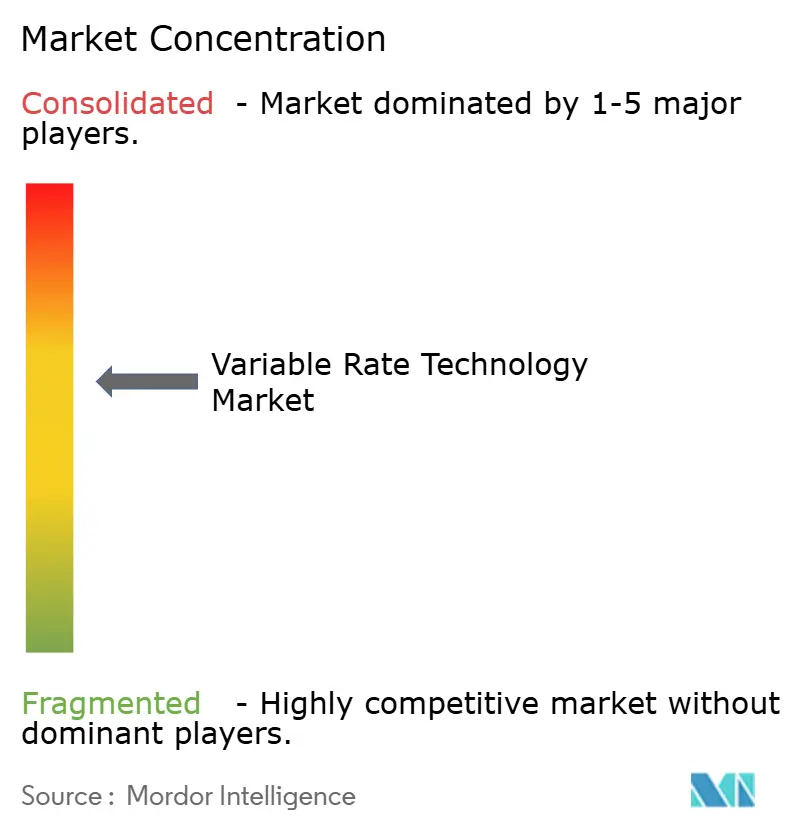
| Market Concentration | Medium |
Major Players *Disclaimer: Major Players sorted in no particular order Image © Mordor Intelligence. Reuse requires attribution under CC BY 4.0. | |
Variable Rate Technology Market Analysis by Mordor Intelligence
Variable Rate Technology Market size in 2026 is estimated at USD 6.99 billion, growing from 2025 value of USD 6.30 billion with 2031 projections showing USD 11.74 billion, growing at 10.93% CAGR over 2026-2031. Rising pressure to produce more food with fewer resources, combined with regulatory scrutiny over fertilizer and pesticide use, positions the variable rate technology market as a pivotal enabler of precision input management. Wider farm digitalization, embedded on-equipment AI, and favorable subsidy programs strengthen technology appeal, while consolidation among equipment makers accelerates platform innovation. North America remains the revenue anchor, yet Asia-Pacific contributes the most incremental growth as modernization schemes expand. Hardware sales still dominate value creation, but service-centric business models scale quickly, signaling an industry shift toward outcome-based offerings.
Key Report Takeaways
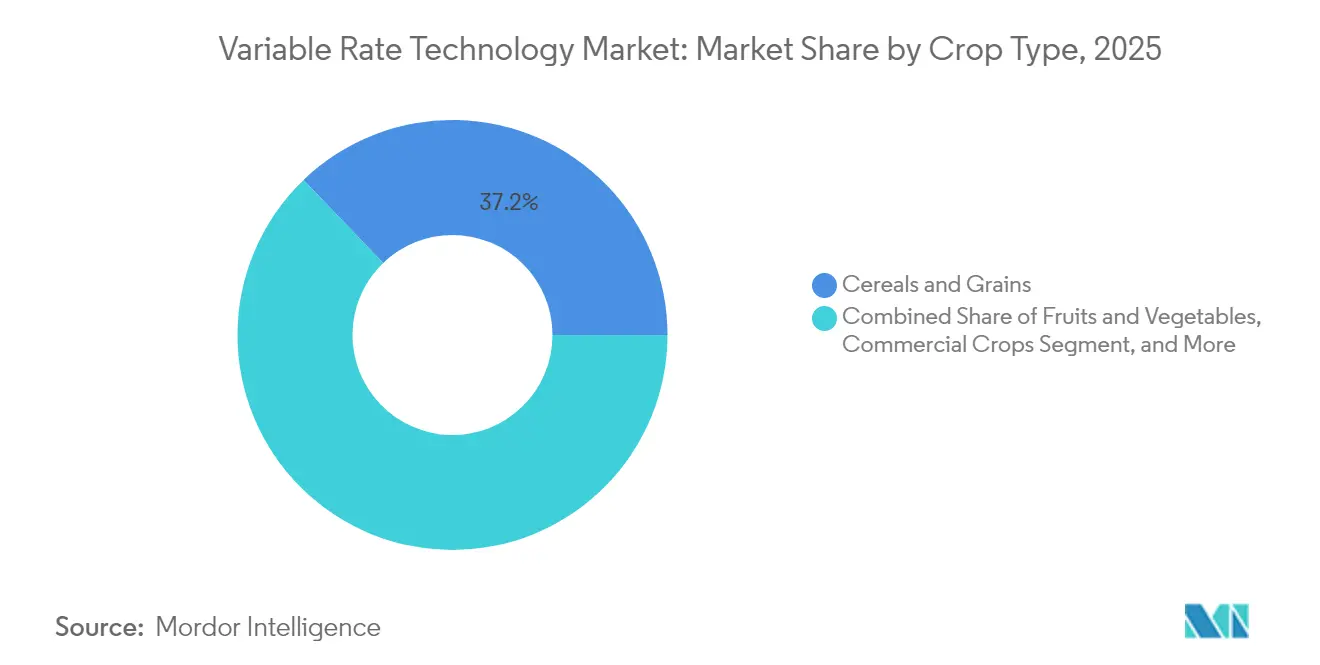
- By crop type, cereals and grains held 37.18% of the variable rate technology market share in 2025; commercial crops are forecast to grow at 14.27% CAGR through 2031.
- By application, fertilizers led with 31.25% revenue share in 2025, while variable-rate irrigation is set to expand at a 16.55% CAGR to 2031.
- By offering, hardware commanded a 55.62% share of the variable rate technology market size in 2025, whereas services are advancing at a 15.86% CAGR through 2031.
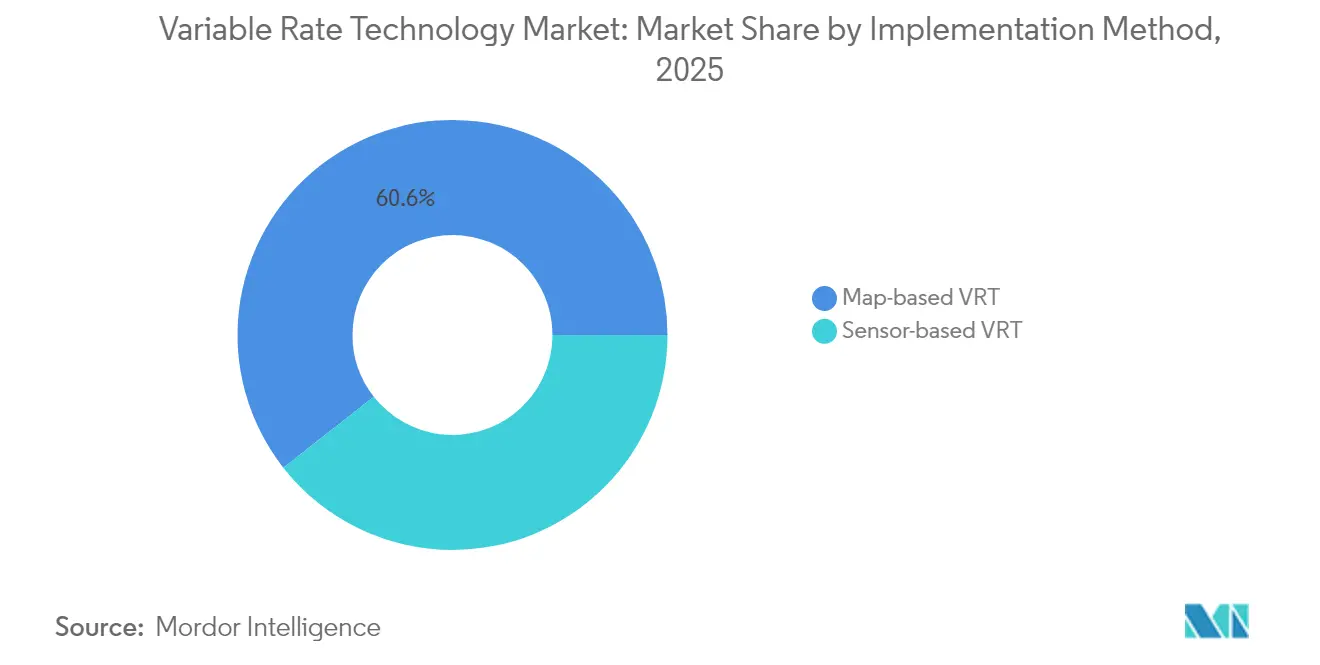
- By implementation method, map-based systems captured a 60.58% share in 2025, while sensor-based approaches are poised for 14.12% CAGR growth.
- By farm size, medium farms accounted for 46.92% of 2025 adoption, yet small farms are projected to rise at 14.73% CAGR through 2031.
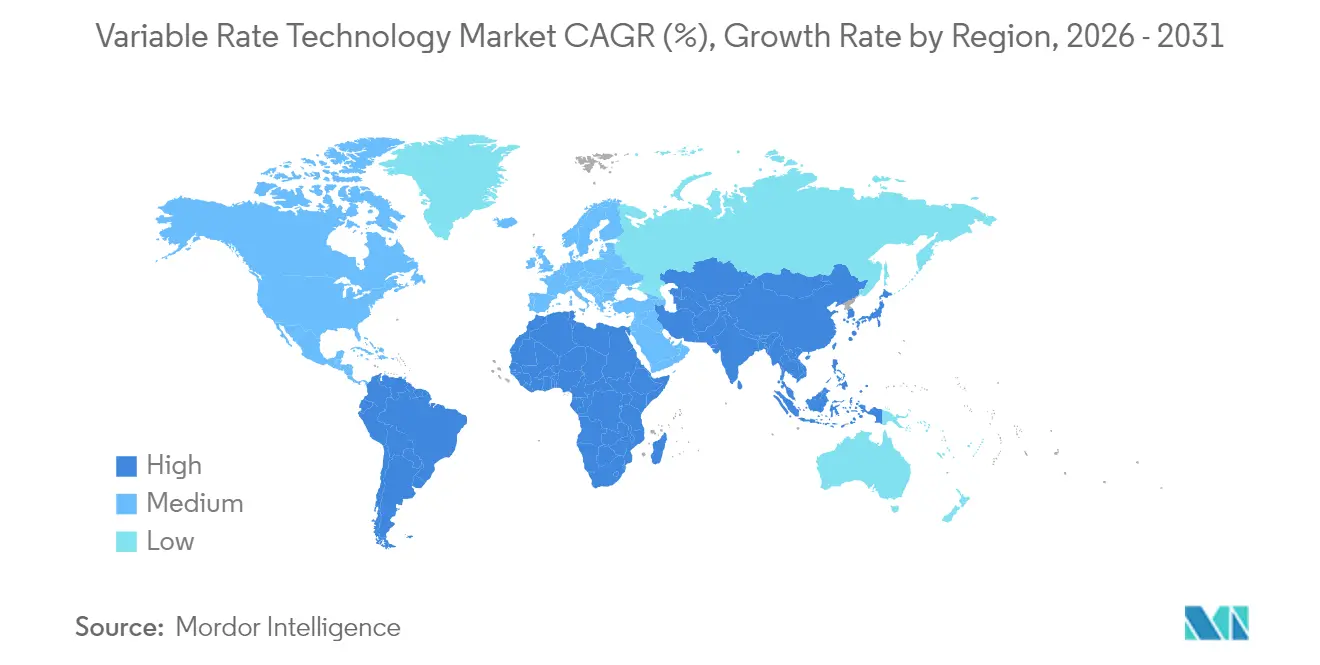
- By geography, North America held 38.62% of the variable rate technology market share in 2025, while Asia-Pacific records the fastest projected growth at 13.65% CAGR through 2031.
Note: Market size and forecast figures in this report are generated using Mordor Intelligence’s proprietary estimation framework, updated with the latest available data and insights as of 2026.
Market Trends and Insights
Drivers Impact Analysis of Variable Rate Technology Market*
| Driver | (~) % Impact on CAGR Forecast | Geographic Relevance | Impact Timeline |
|---|---|---|---|
| Rapid digitalization of farms | +2.8% | Global, led by North America and Europe | Medium term (2-4 years) |
| Government subsidies and incentive schemes | +2.1% | EU, North America, Asia-Pacific | Short term (≤ 2 years) |
| Rising agricultural labor shortage | +1.9% | North America, Europe, Australia | Long term (≥ 4 years) |
| Satellite NB-IoT-enabled sub-acre prescriptions | +1.6% | Global, accelerating in remote areas | Medium term (2-4 years) |
| Carbon credit monetization demanding input traceability | +1.4% | North America, EU expanding to Asia-Pacific | Long term (≥ 4 years) |
| On-equipment AI chips for offline VRT analytics | +1.2% | Global, first on premium equipment segments | Medium term (2-4 years) |
| Source: Mordor Intelligence | |||
Rapid Digitalization of Farms
Sixty-one percent of United States farms already rely on precision hardware that feeds real-time agronomic data into cloud platforms.[1]DLL Group, “Global Ag Equipment Trends 2025,” dllgroup.com Equipment makers allocate multibillion-dollar budgets to autonomous solutions that lower labor needs and refine application accuracy, illustrated by John Deere’s decade-long USD 20 billion domestic manufacturing plan. European policy likewise prioritizes an upcoming digital strategy for agriculture, ensuring sustained funding for connected devices. Closed feedback loops created by AI-driven algorithms continuously adjust prescriptions, moving the variable rate technology market beyond static maps toward self-learning systems. Yet a widening digital divide between large and small farms threatens equitable technology uptake.
Government Subsidies and Incentive Schemes
Policymakers use grants, rebates, and eco-schemes to underwrite adoption costs. The USDA Climate-Smart Commodities initiative channels USD 3.1 billion into projects that necessitate granular production data and, by extension, precision input tools.[2]United States Department of Agriculture, “Climate-Smart Commodities,” usda.gov Australia’s On-Farm Connectivity Program covers half the cost of smart irrigation devices, while India’s Digital Agriculture Mission earmarks INR 6,000 crore (USD 722.89 million) for connected infrastructure. Europe’s Common Agricultural Policy directs at least 25% of direct payments toward eco-schemes that reward variable-rate fertilization. These subsidies lower entry barriers, especially for mid-size farms whose cash flows were once restricted by high-tech spending.
Rising Agricultural Labor Shortage
Persistent worker deficits lift automation from a discretionary upgrade to an operational necessity. Field-level robotics now pairs with rate controllers so one operator can supervise multiple machines while maintaining optimal input levels. Satellite broadband arrangements such as John Deere-Starlink furnish the always-on connectivity required for uncrewed operations. The resulting service demand helps explain the double-digit growth projected for variable-rate technology market services.
Satellite NB-IoT–Enabled Sub-Acre Prescriptions
Partnerships between space and telecom firms deliver a narrowband spectrum to remote croplands, removing a historic bottleneck for real-time prescriptions. OQ Technology and Deutsche Telekom now market a 5G IoT service tailored for rural sensors that updates moisture, nutrient, and stress metrics every few minutes. Active satellite IoT connections in farming are on track to double by 2029, directly expanding the addressable variable rate technology market.
Restraints Impact Analysis of Variable Rate Technology Market*
| Restraint | (~) % Impact on CAGR Forecast | Geographic Relevance | Impact Timeline |
|---|---|---|---|
| High capital expenditure of VRT-ready machinery | -2.3% | Global, most acute for small and medium farms | Short term (≤ 2 years) |
| Patchy rural connectivity infrastructure | -1.8% | Emerging markets, rural North America, remote EU regions | Medium term (2-4 years) |
| Data ownership and sharing ambiguities | -1.2% | Europe, North America | Medium term (2-4 years) |
| Shortage of VRT skilled agronomic service providers | -1.0% | Asia-Pacific, Africa, parts of Eastern Europe | Long term (≥ 4 years) |
| Source: Mordor Intelligence | |||
High Capital Expenditure of VRT-Ready Machinery
Profitability breakeven often starts at economic farm sizes above EUR 100,000 (USD 114,923.51), leaving smaller operations priced out of equipment purchases. Lenders such as AgDirect offer sector-specific loans, yet collateral hurdles persist for family farms with thin balance sheets. As a workaround, equipment-as-a-service contracts spread costs across acres serviced rather than units owned.
Patchy Rural Connectivity Infrastructure
Only one-quarter of United States farms connect machines to the cloud because broadband gaps linger despite federal grants. Manufacturers, therefore, integrate satellite receivers, and CNH Industrial now bundles Intelsat coverage with Raven application controls. Edge computing solutions mitigate dead zones but curb benefits tied to multi-farm data pooling.
*Our forecasts treat driver/restraint impacts as directional, not additive. The impact forecasts reflect baseline growth, mix effects, and variable interactions.
Variable Rate Technology Market Segment Analysis
By Crop Type:
Commercial crops outpace staplesIn 2025, cereals and grains represented 37.18% of revenues, cementing their role as the foundation of the variable rate technology market. These broad-acre crops benefit from decades of prescription mapping that fine-tunes nitrogen, phosphorus, and seeding density across large tracts. Commercial crops such as cotton, tobacco, and specialty fibers deliver the fastest gains with a 14.27% CAGR outlook, as higher margins justify premium sensors and on-equipment AI. Variable rate technology market size for commercial crops is anticipated to climb in tandem with quality-linked pricing schemes that reward precise micronaire or leaf grade. Continuous monitoring of plant stress via multispectral cameras feeds real-time models that initiate potassium or foliar-feed interventions within minutes. This responsiveness helps producers capture contract bonuses and reduce grade-related downgrades. Cereals will keep anchoring installed base volumes, yet specialty segments set the pace for advanced feature uptake.
Second-generation soil spectroscopy now measures nutrient release curves that underpin fertilizer micro-dosing in oilseed and pulse rotations. Adoption is especially strong in Brazil and India, where protein and oil content directly influence farm-gate prices. The variable rate technology market further penetrates orchard and vineyard operations as fruit exporters demand tighter Brix and color tolerances. Providers bundle sap analysis and irrigation rate control into subscription services so smaller acreage fruit farms can access high-end analytics without outright equipment purchases.


By Application:
Irrigation leads accelerationFertilizers held a 31.25% market share in 2025 because nitrogen efficiency improvements deliver quick paybacks in most climatic zones. Variable-rate irrigation is poised for a 16.55% CAGR by 2031, reflecting escalating water scarcity and regulatory caps on seasonal withdrawals. In California trials, precision pivots cut water use by 25% with no yield penalty, validating the economics for almond and pistachio groves. The variable rate technology market size for irrigation equipment is forecast to add USD 1.07 billion in incremental sales by 2031, buoyed by subsidy programs that reimburse low-pressure nozzle retrofits. Crop-protection spraying follows close behind as computer-vision weed identification slashes herbicide volumes by up to 80%. Added to these gains, yield monitoring applications complete the data feedback loop that refines future prescriptions and anchors subscription renewals for analytics software.
Integration of wireless soil probes with cloud dashboards enables irrigation decisions that account for evapotranspiration forecasts and future rainfall probability. This predictive capability extends pump life and trims energy demand, reinforcing the resource-efficiency value proposition. Fertilizer applications now leverage real-time tissue testing via portable lab kits that sync to rate controllers, converting static maps into season-long dynamic schedules. Product innovation in biological crop-protection inputs further amplifies the need for precise micro-dosing that hinges on sensor-driven variable rate algorithms.
By Offering:
Services unlock recurring revenueHardware retained a 55.62% share in 2025 through steady combine and sprayer sales, yet the services arm of the variable rate technology market is climbing at 15.86% CAGR as growers favor guaranteed outcomes over asset ownership. Dealers now provide agronomic audits, data cleansing, prescription generation, and in-season monitoring under per-acre contracts. This pivot stabilizes cash flow for manufacturers and reduces decision complexity for farmers. Integrated dashboards blend weather, soil, and machine health data so agronomists can adjust rates remotely, shrinking labor demands on farm staff. Variable rate technology industry participants increasingly offer tiered service bundles that include hardware maintenance, over-the-air software updates, and regulatory reporting modules.
Software layers supply the connective tissue across mixed fleets, demonstrated by AGCO’s Fuse platform and the newly formed PTx Trimble joint venture that focuses on retrofit solutions. This open-architecture push broadens addressable acres because older equipment can now access modern rate control without full tractor replacements. Service contracts also address data privacy fears by stipulating ownership clauses and encryption standards, reassuring growers who previously hesitated to share field analytics.
By Implementation Method:
Sensors narrow the gapMap-based VRT workflows accounted for 60.58% of deployments in 2025, a legacy of yield mapping and soil sampling practices that dominated the first precision agriculture wave. Sensor-based VRT systems are catching up fast at 14.12% CAGR as multispectral cameras, chlorophyll meters, and soil probes fall in price. Field-mounted optics read canopy reflectance to gauge nitrogen status, feeding immediate side-dress commands to rate controllers.
Hybrid approaches merge historical yield maps with real-time sensor data, improving prescription accuracy in variable weather years. The variable rate technology market, therefore, transitions from static planning toward autonomous adjustment powered by machine-learning inference within implementations. Edge computing chips now process high-resolution video streams locally, eliminating latency even when cellular networks fail. As connectivity expands, cloud synchronization allows cross-field benchmarking that refines algorithms for future seasons.
By Farm Size:
Democratization acceleratesMedium farms between 200 and 1,000 hectares owned 46.92% of the installed systems in 2025 because their scale justifies capital spending while still allowing owner-operator control. Yet the highest growth lies with smaller farms under 200 hectares, which will expand adoption at 14.73% CAGR as cooperative models and financing tools mature.
Variable rate technology market share growth in this tier is supported by equipment rental pools, dealer-managed custom applications, and smartphone dashboards that reduce technical complexity. Large enterprises remain technology pioneers, integrating autonomous tractors, drone fleets, and AI-driven supply chain traceability to defend thin commodity margins. Regulators now recognize smallholder inclusion as critical for national sustainability targets, prompting grant programs that offset setup costs and sponsor precision-ag apprenticeships.
Geography Analysis
North America Variable Rate Technology Market
North America generated 38.62% of 2025 revenue for the variable rate technology market. Strong machinery penetration, supportive financing, and USDA climate-smart procurement rules anchor demand. Subsidy frameworks reward documented nutrient reductions, spurring the adoption of smart implements that capture nozzle-level logs. Rural broadband lags in parts of the Midwest and Prairie provinces, yet satellite link rollouts promise coverage boosts by 2026. Ohio State trials show a 6% yield lift when VR nitrogen intersects with drone stand counts, proof points that validate ongoing investment. Dealer ecosystems supply certified technicians who maintain fleets and interpret data, underscoring the service growth narrative.
APAC Variable Rate Technology Market
Asia-Pacific is the fastest climber, tracking a 13.65% CAGR to 2031 as governments attach digital farming clauses to modernization spending. China’s latest Five-Year Plan promotes low-carbon, high-efficiency agriculture that dovetails with targeted input delivery. India’s Aadhaar-linked Farmer Registry simplifies subsidy disbursement for sensor kits, while Japan’s Food and Agriculture Ministry co-funds paddy-specific variable rate seeding trials. The region’s small-plot structure sparks creative solutions, including shared-service drones operated by village entrepreneurs. Water scarcity across Australia and Northern China accelerates variable-rate irrigation uptake, driving cross-border knowledge transfer and hardware imports.
Europe Variable Rate Technology Market
Europe embeds variable rate technology adoption within sweeping climate policy. The Common Agricultural Policy for 2023-27 allocates EUR 269.5 billion (USD 312.4 billion), nearly half aimed at climate objectives that include reduced fertilizer leaching and pesticide drift. Each member state must earmark at least 25% of direct payments for eco-schemes, many of which list precision application as a qualifying practice. Countries such as the Netherlands fund digitization grants that reimburse up to 40% of sensor installations, hastening implementation. Data sovereignty rules raise compliance costs as platforms adapt to General Data Protection Regulation obligations. Nonetheless, consortium projects like Germany’s 5G Testbed Agriculture expedite confidence in secure connectivity, and Pan-European carbon initiatives depend on traceable input data generated by rate controllers.

Regulatory Landscape
Regulation affecting variable rate technology (VRT) is tightening around two themes: sustainability reporting tied to public programs and the safety, conformity, and data governance requirements that come with connected, automated implements. In the United States, USDA technical guidelines published in January 2025 for climate-smart agriculture crops used as biofuel feedstocks explicitly recognize practices such as variable-rate application as a pathway to reduce emissions. That emphasis reinforces the role of VRT-generated prescription records and as-applied records in program compliance. Separately, a federal legislative push toward interoperability has taken shape through the introduction of S. 507 in July 2025, which promotes voluntary consensus standards for precision agriculture, including VRT and interconnectivity across platforms.
In Europe, machinery and mobile equipment frameworks shape how VRT controllers, sensors, and AI-enabled features are designed and certified. The EU Machinery Regulation (EU) 2023/1230 sets health and safety requirements for machinery, with phased application and ongoing alignment through harmonised standards. Regulation (EU) 2025/14 establishes procedures for EU type-approval and market surveillance of non-road mobile machinery circulating on public roads, affecting road transit of equipped sprayers, spreaders, and tractors. Safety and automation standards also continue to mature, including ISO 18497-1:2024, which provides design principles for partially automated and autonomous agricultural machinery, while proposed 2026 Colorado legislation also references field prescriptions and variable-rate maps in relation to agricultural data ownership and monetization.
Competitive Landscape
The variable rate technology market exhibits moderate concentration, with five leaders holding a 62% share. Deere & Company secures 22% through integrated hardware, AI vision, and cloud analytics that run across its Operations Center. It's See & Spray Premium identifies weeds in green-on-green settings and instantly modulates herbicide flow, cutting chemical spending while creating verifiable compliance logs. AGCO commands 15.5% after launching the PTx Trimble venture that supplies retrofit rate control to mixed fleets, opening new revenue from aging tractors.
CNH Industrial leverages Raven Industries’ controllers plus Intelsat connectivity to cement its 12% position. Variable-rate irrigation specialists Valmont and Lindsay round out the top tier, owning 7% and 5.5%, respectively, through Valley and FieldNET smart pivots. Strategic themes revolve around vertical integration, platform openness, and autonomous capability. Deere’s acquisition of Sentera adds drone imagery that feeds smart-spraying algorithms, while CNH’s business plan doubles Precision Tech's revenue share by 2030 through sensor-rich implements.
Start-ups such as EarthOptics and Pattern Ag merge to provide soil-digital-twin subscriptions that challenge equipment-centric incumbents. Manufacturers also execute partnership playbooks: John Deere aligns with Starlink for broadband, AGCO dealers merge to enlarge service footprints, and Phytech teams with Rivulis and Netafim to blend plant sensors with irrigation. Competitive intensity rises, yet scale advantages in Research and Development and distribution still favor established players, keeping market concentration moderate.
Variable Rate Technology Industry Leaders
Deere & Company
AGCO Corporation
CNH Industrial N.V.
Lindsay Corporation
Valmont Industries, Inc.
- *Disclaimer: Major Players sorted in no particular order
Variable Rate Technology Market Companies Covered in this Report
- Deere & Company
- AGCO Corporation
- CNH Industrial N.V.
- Valmont Industries, Inc.
- Lindsay Corporation
- EarthOptics
- Hexagon AB
- CropX Technologies
- TeeJet Technologies (Spraying Systems)
- DJI
- DroneDeploy
- The Climate Corporation (Bayer AG)
- EOS Data Analytics,Inc
- SoilOptix
- Frontier Agriculture Ltd

Market Opportunities and Future Outlook
Interoperability that reduces manual data handling between agronomy platforms and machine execution is a near-term whitespace, as it lowers adoption friction for both map-based and sensor-based VRT across mixed fleets. A concrete example is the February 2026 announcement of tighter integration between Bayer FieldView prescriptions and the John Deere Operations Center to generate automated Work Plans. That linkage supports faster prescription-to-application workflows and broadens the practical addressable base for VRT services tied to documentation. It also fits the report's shift toward outcome-based services, where prescriptions, monitoring, and compliance logs are treated as recurring-contract outputs rather than standalone files moved via removable media.
Equipment and input-application roadmaps are also concentrating on real-time automation and multi-product control, which creates demand opportunities for higher-value rate controllers, sensors, and software capable of executing multiple variable-rate layers in one pass. In February 2026, John Deere introduced Model Year 2027 planter upgrades, including ExactShot-ExactRate dual-product fertilizer architecture and FurrowVision automation, reinforcing the need for controllers and sensing stacks that can deliver low-latency, on-equipment decisioning. At the same time, adoption programs in other geographies are opening space for training-led rollouts and dealer-enabled service bundles, including Yanmar opening the Yanmar Solution Experience Center in Bang Nam Priao, Thailand in May 2026 with partners Chia Tai Company Limited and XAG Co., Ltd. The center supports hands-on validation of variable-rate use cases beyond broad-acre North America.
Recent Industry Developments in Variable Rate Technology Market
- July 2026: Daedong announced an expansion of its AI agriculture platform for autonomous operations and management services, paired with logistics and supply-chain upgrades at its Tacoma, Washington warehouse. The announcement expands the service layer around connected equipment, supporting more consistent deployment and support for precision and variable-rate capabilities across customer fleets.
- November 2025: CNH Industrial outlined its 2030 strategy, including a plan to increase the contribution of precision technology sales within its agricultural business. The strategy direction points to continued investment in VRT-relevant controllers, sensing, and digital platforms as part of an integrated OEM stack rather than as add-on components.
- February 2024: CNH Industrial took a minority stake in Bem Agro, a Brazilian AI drone imaging company, to expand agronomic mapping and precision field operations. The added aerial imagery and analytics supports prescription and scouting workflows that underpin VRT, particularly for crop-protection and fertilizer applications that depend on high-resolution field variability data.


Variable Rate Technology Market Report Scope and Research Methodology
Market Definition and Coverage
The Variable Rate Technology (VRT) market covers tools used in agriculture that automatically change the application rate of inputs across a field using prescription maps or real time sensing, together with the related software and connected services needed to run those systems.
Scope exclusions: We exclude generic farm management software without rate control functionality and revenue earned only by custom contracting service operators.
Segments Covered in This Report
- By Crop Type
- Cereals and Grains
- Fruits and Vegetables
- Oilseeds and Pulses
- Commercial Crops
- By Application
- Fertilizers
- Crop-protection Chemicals
- Soil Sensing
- Yield Monitoring
- Irrigation
- Others (variable-rate seeding/planting, variable-rate lime and soil-amendment application)
- By Offering
- Hardware
- Software
- Services
- By Implementation Method
- Map-based VRT
- Sensor-based VRT
- By Farm Size
- Large Farms (greater than 1,000 ha)
- Medium Farms (200-1,000 ha)
- Small Farms (less than 200 ha)
- By Geography
- North America
- United States
- Canada
- Mexico
- Rest of North America
- Europe
- Germany
- France
- United Kingdom
- Italy
- Spain
- Russia
- Rest of Europe
- Asia-Pacific
- China
- Japan
- India
- South Korea
- Australia
- Rest of Asia-Pacific
- Middle East
- Turkey
- Saudi Arabia
- United Arab Emirates
- Rest of Middle East
- Africa
- South Africa
- Egypt
- Nigeria
- Rest of Africa
- North America
Data Sources, Market Sizing, and Validation
Desk Research
Desk work started with building a clean view of how VRT is adopted and how it is typically sold, since the same system can be sold as a factory fit option, a retrofit kit, or as a software subscription. We used public sources such as USDA and NASS surveys, FAOSTAT crop and land use data, Eurostat agriculture statistics, and national agriculture ministries for mechanization and input use indicators, which later helped anchor demand pools.
To keep the pricing and shipment assumptions realistic, we also reviewed sources such as customs trade statistics for key equipment categories, peer reviewed agronomy and precision agriculture journals, and websites of relevant farming and precision agriculture associations. Alongside these, company filings, investor presentations, and credible press were used to confirm product positioning, channel models, and typical bundle structures. We also used paid subscriptions for company financials and intelligence, plus patent databases to understand the pace of product launches. These desk research sources are illustrative only, and we relied on many other public and internal references for cross checks and clarification.
Primary Interviews and Surveys
Primary inputs were gathered through expert interviews and structured surveys with manufacturers, software providers, distributors, farm managers, and agronomy advisors who influence VRT purchase and usage decisions. Because this is a global market, we ensured discussions covered major row crop regions across APAC, EMEA, and the Americas, and then used that feedback to fill gaps on attach rates, typical system configurations, and service renewals that are hard to see from public sources alone.
Distribution of primary research fieldwork respondents
| Company type | Respondent position | Region |
|---|---|---|
| Top tier: 25% | CXOs: 19% | APAC: 47% |
| Mid tier: 56% | Functional/Unit leaders: 28% | EMEA: 35% |
| Smaller Players: 19% | Managers: 53% | Americas: 18% |
Market-Sizing & Forecasting
The market size was built using top-down logic, where acreage under key crops and mechanization levels were translated into an addressable equipment base, and then filtered by VRT adoption and upgrade cycles. Results were corroborated with selective bottom-up approximations, such as sampled ASP times estimated unit volumes for VRT controllers, sensors, and software subscriptions, followed by channel checks to adjust for bundling and discounting.
Inputs used in the model included crop acreage trends, precision agriculture penetration by farm size, replacement cycles for rate controllers and related hardware, the split between map based and sensor based use, and typical annual software or service fees tied to VRT enablement. Forecasting relied on scenario analysis supported by primary expert views on farm economics, input price pressure, and policy signals on nutrient efficiency, and then the final outlook was converted into a central case after stress testing adoption and ASP progression. Where bottom-up detail was missing for smaller regions, we used proxy adoption curves from similar cropping systems and corrected them using interview feedback on local channel maturity.
Data Validation & Update Cycle
Model outputs were checked against independent signals, including observed precision agriculture adoption patterns, equipment replacement timing, and the consistency of implied spend per treated acre. Outliers were flagged when growth rates, regional splits, or implied pricing moved outside plausible bounds, and those items were reviewed again through follow-up expert touchpoints.
Before sign-off, the estimates went through multi step analyst reviews that compared final totals to alternative calculations and to the story reflected in public statistics and company disclosures. The report is refreshed annually, and interim updates are made when material events occur, such as major regulation changes, sharp shifts in farm input economics, or meaningful technology launches. Right before delivery, a final data pass is done so clients receive the latest updated view.
Mordor Intelligence's Variable Rate Technology Market Size Measured Against Other Published Estimates
Published VRT market values often do not match because the boundaries of what is counted can shift, and the time period selected for the current year is not always the same. Differences also show up when one estimate leans more on vendor revenue narratives, and another leans more on adoption signals from farms and channels.
A few gap drivers matter most in this market, especially whether generic farm software is counted even when it cannot execute variable rate control, and whether custom application contractor revenue is added on top of technology sales. The other common gaps come from how fast adoption is assumed to rise in developing farm regions, how software renewals are treated when bundled with equipment, and how currency conversion timing is handled for multi region totals.
Benchmark comparison
| Source | Market Size | Gaps in Research Methodology |
|---|---|---|
| Mordor Intelligence | USD 6.99 B (2026) | |
| Industry Research Publisher A | USD 6.10 B (2025) | Uses an earlier base year and appears to apply a faster long range adoption curve, which can lift the total if software renewals and hardware upgrades are assumed to accelerate together. |
| Industry Research Publisher B | USD 5.44 B (2024) | Starts from a lower current year and may be counting a narrower technology bundle, which can reduce the total if map and sensor based systems, plus enabling software, are not consistently captured across regions. |
Adoption indicators like treated acreage share, equipment replacement cadence, and observed bundle pricing were the checks that kept Mordor Intelligence tied to a defined rate control demand pool, rather than a broader precision agriculture spend bucket. When readers align the scope to true rate control capability and apply consistent currency timing, the spread across published numbers becomes easier to explain and easier to reproduce with clear steps.


Key Questions Answered in the Report
What is the current size of the variable rate technology market?
The market is valued at USD 6.99 billion in 2026 and is forecast to reach USD 11.74 billion by 2031.
Which segment will grow the fastest through 2031?
Variable-rate irrigation is projected to post a 16.55% CAGR, the highest among all application areas.
Why are services expanding faster than hardware sales?
Farmers increasingly prefer outcome-based contracts that bundle analytics, custom application, and equipment maintenance, pushing services to a 15.86% CAGR.
How are governments supporting adoption?
Programs such as the USDA Climate-Smart Commodities initiative and EU eco-schemes provide grants and direct payments that offset technology investment costs. Programs such as the USDA Climate-Smart Commodities initiative and EU eco-schemes provide grants and direct payments that offset technology investment costs.
Page last updated on:


 Your data is secure and never sold or shared.


