
Vapor Recovery Units Market Size and Share
Market Overview
| Study Period | 2021 - 2031 |
|---|---|
| Market Size (2026) | USD 1.01 Billion |
| Market Size (2031) | USD 1.42 Billion |
| Growth Rate (2026 - 2031) | 6.98 % |
| Fastest Growing Market | Asia Pacific |
| Largest Market | North America |
| Market Concentration | Medium |
Major Players *Disclaimer: Major Players sorted in no particular order Image © Mordor Intelligence. Reuse requires attribution under CC BY 4.0. | |
Vapor Recovery Units Market Analysis by Mordor Intelligence
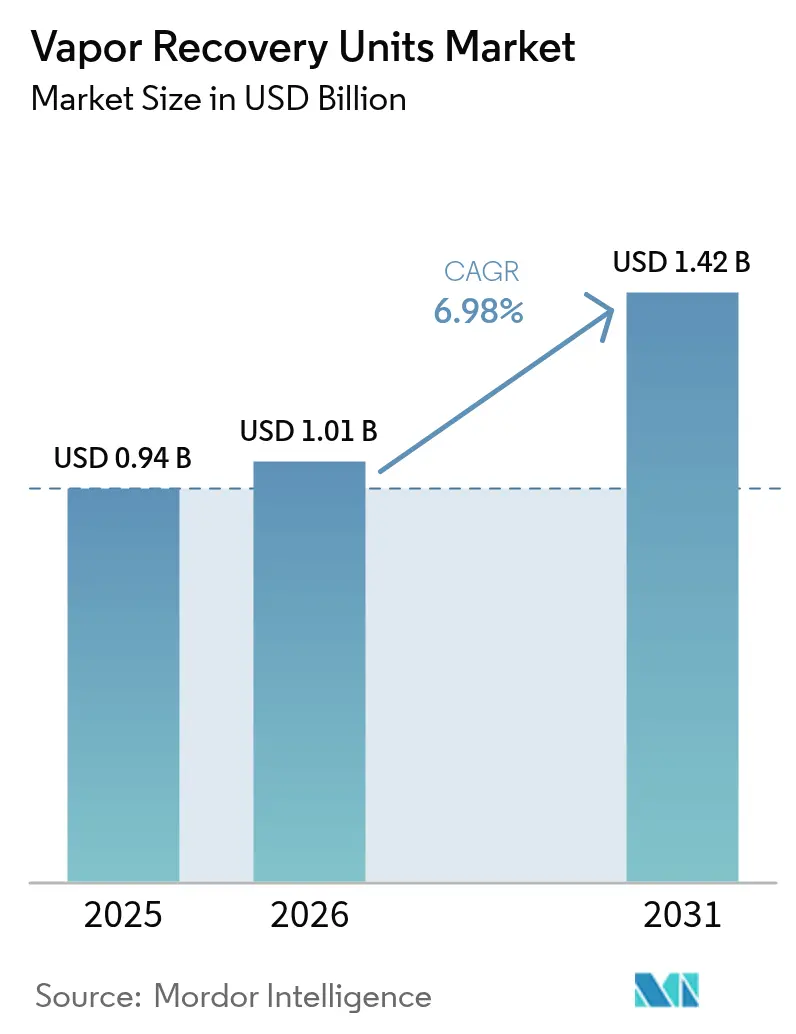
Vapor Recovery Units Market size in 2026 is estimated at USD 1.01 billion, growing from 2025 value of USD 0.94 billion with 2031 projections showing USD 1.42 billion, growing at 6.98% CAGR over 2026-2031.
Heightened enforcement of the United States Environmental Protection Agency’s new methane rule, combined with the escalating Methane Waste Emissions Charge, is placing a clear economic value on capturing previously vented vapors. Uptake is propelled by zero-routine-flaring commitments, real-time monitoring innovations, and premium pricing for high-BTU recovered gas streams. At the same time, rapid breakthroughs in membrane science are shortening payback timelines and reducing life-cycle costs for operators that must meet increasingly stringent leak-detection and repair thresholds. Competitive activity is increasingly defined by digital twin deployments that trim downtime and modular offerings aimed at shallow-decline wells where capital discipline is tight.
Key Report Takeaways
- By product type, compression-based units held 45.55% of the vapor recovery units market share in 2025, while membrane separation units are forecasted to post the fastest growth rate of 8.34% from 2025 to 2031.
- By process technology, adsorption captured 41.12% of the vapor recovery units market size in 2025; membrane separation is projected to advance at a 12.15% CAGR to 2031.
- By flow-rate capacity, the 200-500 Mscfd band is poised for the quickest 7.12% CAGR, overtaking the 50-200 Mscfd segment, which led with a 38.62% share in 2025.
- By installation site, onshore projects accounted for 87.65% of the 2025 spend, whereas offshore deployments are growing at an 7.74% CAGR amid a rebound in FPSO investments.
- By application, storage tanks generated 37.85% of revenue in 2025; flaring-gas recovery is set to climb at a 7.36% CAGR through 2031.
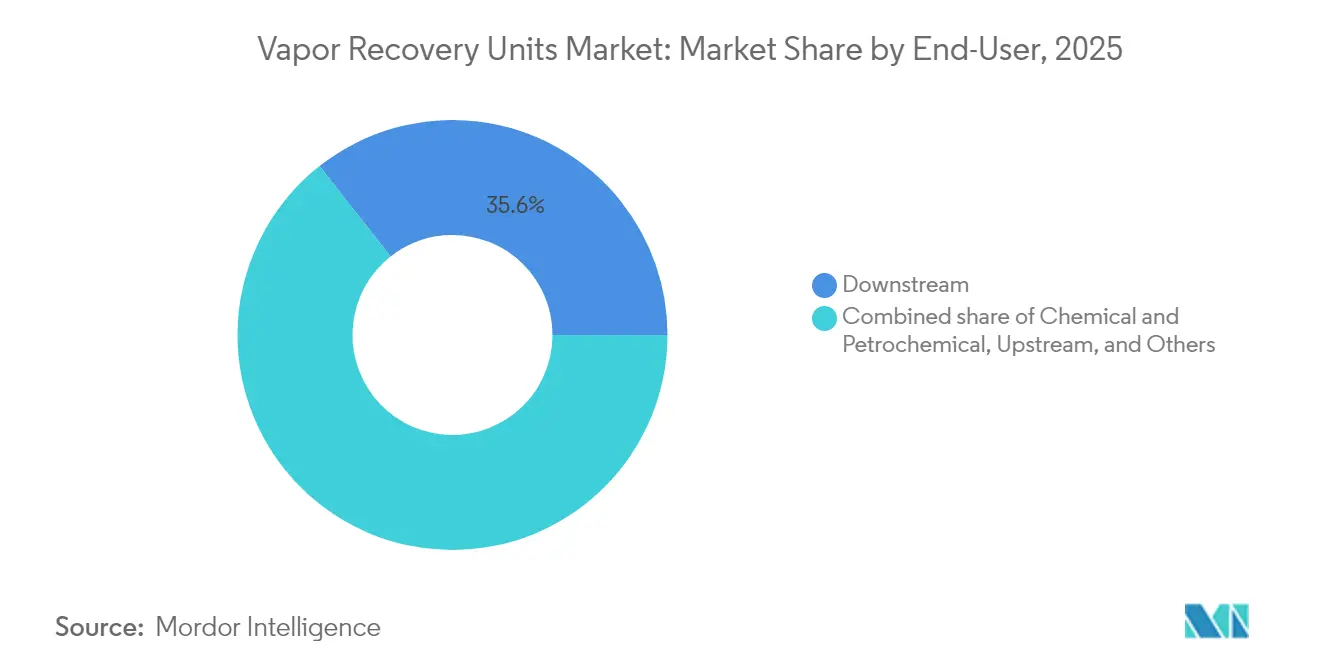
- By end-user, downstream facilities retained a 35.62% share in 2025; however, chemical and petrochemical plants are forecasted to record a 7.28% CAGR through 2031.
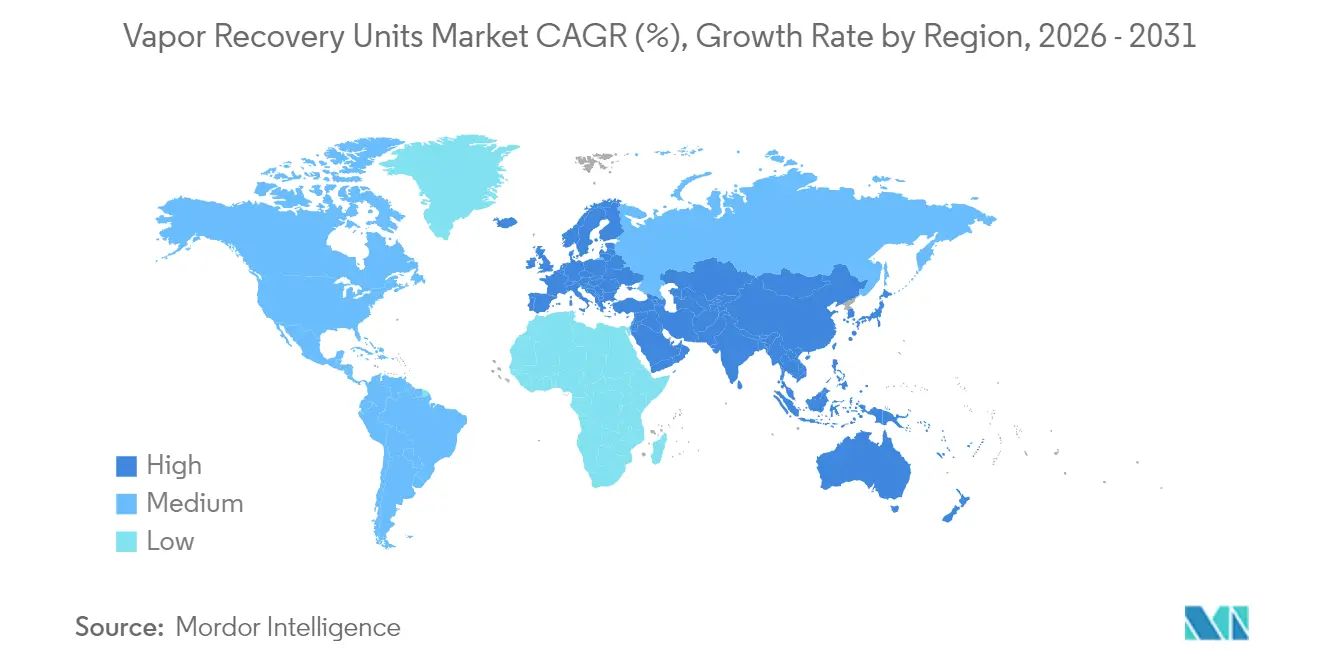
- By geography, North America accounted for 38.25% of the vapor recovery units market share in 2025; the Asia-Pacific region is projected to expand at an 8.07% CAGR through 2031.
Note: Market size and forecast figures in this report are generated using Mordor Intelligence’s proprietary estimation framework, updated with the latest available data and insights as of 2026.
Market Trends and Insights
Drivers Impact Analysis of Vapor Recovery Units Market*
| Driver | (~) % Impact on CAGR Forecast | Geographic Relevance | Impact Timeline | |
|---|---|---|---|---|
| Tightening methane-fee & LDAR regulations | +2.1% | Global, with North America & Europe leading | Short term (≤ 2 years) | |
| Economic pay-back from recovered rich gas | +1.8% | Global, particularly North America shale regions | Medium term (2-4 years) | |
| Stricter gasoline terminal vapor rules (Asia) | +1.2% | APAC core, spill-over to MEA | Medium term (2-4 years) | |
| Up-stream zero-routine flaring targets | +0.9% | Global, with Middle East & Africa focus | Long term (≥ 4 years) | |
| Digital-twin uptime optimisation | +0.7% | Global, with early adoption in North America & Europe | Medium term (2-4 years) | |
| Voluntary crude carbon-intensity scoring | +0.5% | Global, with emphasis on ESG-focused regions | Long te | |
| Source: Mordor Intelligence | ||||
Tightening Methane-Fee & LDAR Regulations
The EPA rule mandating 95% reductions for new and modified oil and gas sources took effect on May 7, 2024, and is reinforced by a Super Emitter Program that obliges operators to remediate plumes exceeding 100 kg/h within prescribed time windows. Canada’s analogous framework, effective March 26, 2025, will apply to 434 petroleum facilities and reduce 488,000 tonnes of VOCs through 2045.(1) Coupled with a Methane Waste Emissions Charge that rises from USD 900 per ton in 2024 to USD 1,500 per ton by 2026, these measures make prompt vapor capture financially rational even at marginal wells. Third-party satellite, drone, and OGI surveillance heightens non-compliance risk, thereby accelerating demand for vapor recovery units.(2)
Economic Pay-Back from Recovered Rich Gas
Recovered vapors typically exceed pipeline-quality BTU specifications and often contain monetizable NGL fractions, delivering project revenues of USD 132,000 against installed costs of USD 100,000 with nine-month payouts in shale plays. Field studies indicate that 94.9% of methane losses at gas-processing facilities can be abated profitably, collectively valued at USD 8.4 million annually. Rising spot gas prices, escalating carbon penalties, and attractive liquids credits are forging a triple dividend that fortifies the vapor recovery units market.
Stricter Gasoline Terminal Vapor Rules (Asia)
China’s oil and gas methane output expanded eightfold between 1990 and 2022, prompting the development of a national action plan centered on high-frequency monitoring and the implementation of best-available controls. South Korea’s Clean Air Conservation Act now directs real-time benzene tracking at terminals handling volatile cargoes, pushing operators to adopt high-efficiency VRUs that meet 550 ppmv TOC limits for new facilities. The alignment of regional rules with MARPOL Annex VI for marine loading is opening routes for global suppliers, underpinning Asia-Pacific’s outsize 8.4% CAGR within the vapor recovery units market.
Up-Stream Zero-Routine Flaring Targets
The World Bank and IOC's pledges to eliminate routine flaring by 2030 translate into field-level retrofits, where flare-gas recovery yields internal rates of return above 20% compared with vent-and-burn practices. Offshore FPSOs sanctioned in 2024 integrate variable-speed compression, ejector boosters, and CO₂ capture as baseline utilities, demonstrating that near-zero-flaring designs are commercially viable.
Restraints Impact Analysis of Vapor Recovery Units Market*
| Restraint | (~) % Impact on CAGR Forecast | Geographic Relevance | Impact Timeline |
|---|---|---|---|
| High CAPEX for compression skids | -1.4% | Global, particularly affecting marginal operations | Short term (≤ 2 years) |
| Corrosive sour-gas service issues | -0.8% | Regional, concentrated in sour gas production areas | Medium term (2-4 years) |
| Off-grid power constraints at shale pads | -0.6% | North America shale regions, remote offshore locations | Short term (≤ 2 years) |
| Cheap flaring credits in carbon markets | -0.4% | Global, with regional variations in carbon pricing | Medium term (2-4 years) |
| Source: Mordor Intelligence | |||
High CAPEX for Compression Skids
Compression-dominant systems, which account for nearly half of 2024 revenue, require upfront expenditures exceeding USD 100,000 per site, a hurdle that could shut in up to 300,000 US marginal wells producing 15 bbl/day or less.(3) Vendors ease the burden through rental fleets and lease-to-own structures, while ejector-based packages eliminate the need for rotating machinery, thereby curtailing capex and maintenance.
Corrosive Sour-Gas Service Issues
H₂S-rich streams mandate stainless alloys, special elastomers, and upgraded seals, inflating the total cost of ownership relative to sweet-gas duty. Membrane elements are prone to accelerated degradation in sour service unless protected by new chemistries, such as polyimide-graphene blends. Adsorption beds, on the other hand, require frequent carbon change-outs. Research on resilient materials is underway, but adoption in highly sour fields remains tentative, tempering the growth of vapor recovery units in those locales.
*Our forecasts treat driver/restraint impacts as directional, not additive. The impact forecasts reflect baseline growth, mix effects, and variable interactions.
Vapor Recovery Units Market Segment Analysis
By Product Type:
Compression Dominance Meets Membrane InnovationCompression packages accounted for 45.55% of 2025 sales in the vapor recovery units market, reflecting reliability across tank, pipeline, and terminal sites. Membrane VRUs, however, are growing at an 8.34% CAGR and benefit from fuel-free operation and compact footprints that allow skid mounting on congested pads. The vapor recovery units market size for membrane systems is projected to reach USD 281 million by 2031, driven by graphene-enhanced modules that reduce energy consumption by more than 50%. Ejector/Venturi units are carving a niche at low-pressure remote leases where pneumatic power is readily available, and cryogenic VRUs thrive in NGL-rich plays that justify deeper cooling cycles.
Continued materials progress, ranging from mixed-matrix membranes to scroll compressors with variable-frequency drives, has narrowed OPEX gaps against legacy compression. Digital twin models optimize set points in real-time, extending component life and reducing unplanned downtime by up to 30%. These technology inflections shift customer evaluations toward life-cycle economics over first cost, accelerating membrane traction within the vapor recovery units market.
By Process Technology:
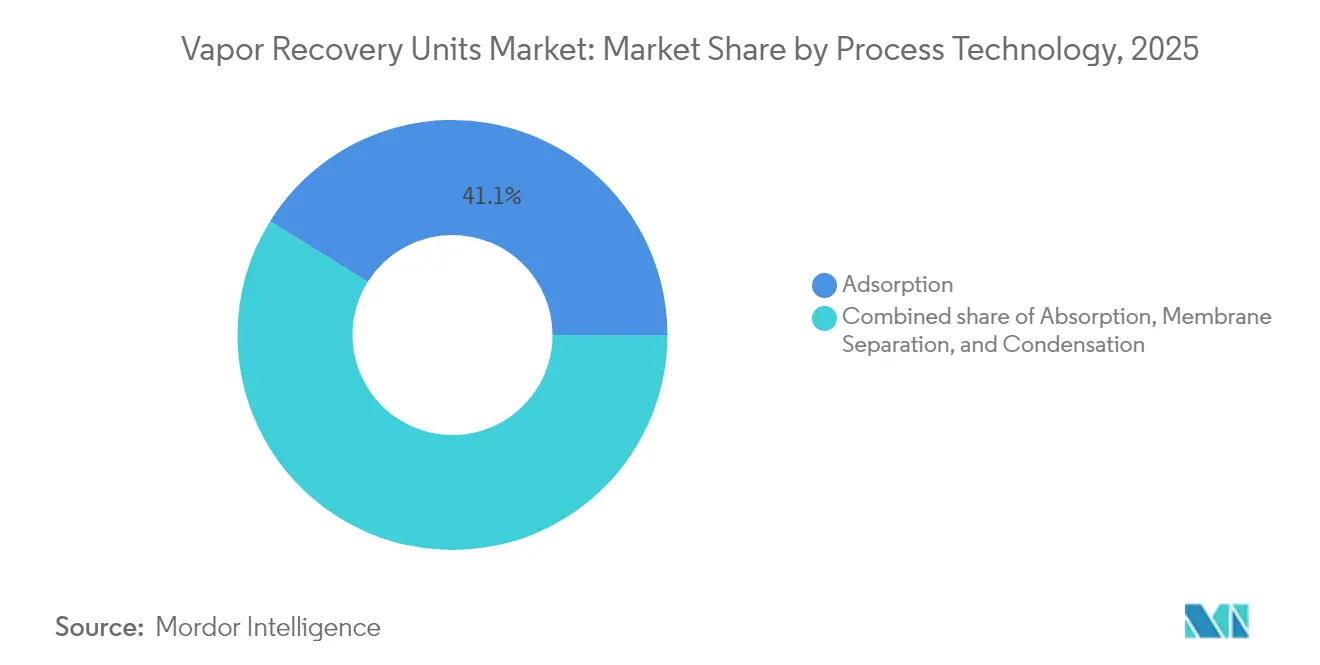
Adsorption Leadership Under Membrane PressureActivated-carbon adsorption accounted for 41.12% of 2025 revenue, thanks to near-unity recovery efficiencies that meet 95% VOC rules. The vapor recovery units market share for membrane separation remains lower today but is climbing fastest at a 12.15% CAGR, driven by polymer-of-intrinsic-microporosity films that post permeabilities above 10,000 GPU. Absorption towers remain relevant in benzene-rich service, while condensation units thrive where phase-change economics make chilling more attractive.
Operators weigh the energy draw against the complexity of maintenance. Adsorption demands periodic carbon regeneration, whereas membranes avoid cycle downtime but must contend with fouling. Emerging AI-enabled monitors flag feed-quality excursions early, allowing operators to rotate skids rather than shut down, thereby boosting system uptime and further driving the growth of the vapor recovery units market.

By Flow-Rate Capacity:
Mid-Range Momentum Drives Market EvolutionUnits rated 50-200 Mscfd generated 38.62% of 2025 turnover as they match the production curves common to multi-well pads. Yet the 200-500 Mscfd class is forecast to show the strongest 7.12% CAGR, propelled by central processing hubs that pool vapors from satellite sites. Economies of scale drive the cost per recovered Mcf downward, thereby bolstering the market size for vapor recovery units in the mid-range systems segment. Below 50 Mscfd solutions pivot to modular designs, while above 500 Mscfd mega-VRUs serve LNG pre-treatment and large refinery projects.
Software-driven load balancing enables variable-speed compressors to track fluctuating feed rates without experiencing surge events, thereby enhancing fuel efficiency. Combined with predictive analytics, these features tighten the economic case at mid-scale, underpinning growth in this bandwidth of the vapor recovery units market.
By Installation Site:
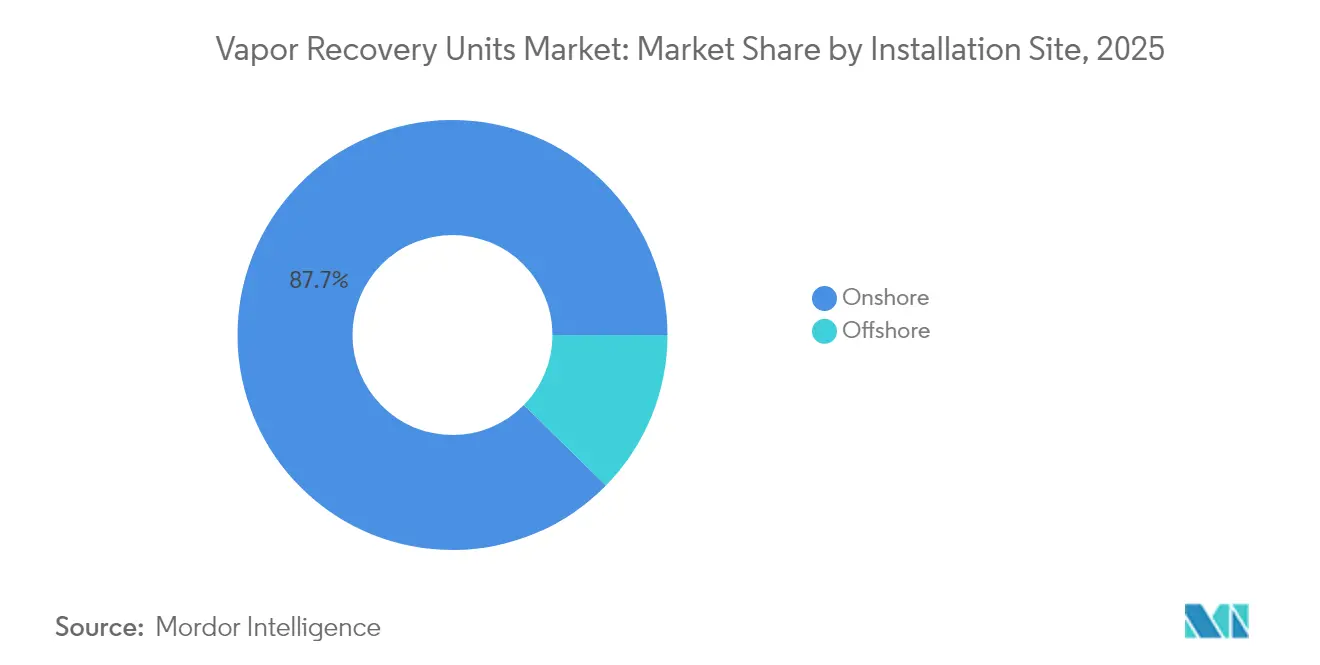
Onshore Stability Versus Offshore InnovationOnshore projects captured 87.65% of 2025 revenue due to mature pipeline grids and easier logistics. Offshore, however, is adding installations at an 7.74% CAGR as Brazil and Guyana sanction deepwater FPSOs equipped with zero-routine-flaring packages. The vapor recovery units market size for offshore applications is expected to exceed USD 163 million by 2031, driven by space-saving scroll compression modules and robust seawater-cooled membranes. Harsh service demands stainless housings, explosion-proof drives, and remote-access diagnostics, which raise ticket prices but also increase margins for specialized vendors.
Onshore operators focus on modularity and quick tie-ins to storage tank roofs, while offshore engineers seek integrated skid designs that combine vapor and fuel-gas conditioning. This bifurcation shapes R&D spending and regional procurement channels across the vapor recovery units market.
By Application:
Storage Tank Leadership Meets Flaring Recovery GrowthStorage tanks contributed 37.85% of 2025 revenue as EPA rules require 95% VOC control for vessels emitting more than 6 tons annually. Flaring-gas recovery is the fastest-growing sector, with a 7.36% CAGR; higher carbon fees render previously uneconomic flare streams profitable to capture. The vapor recovery units market size tied to flare capture could surpass USD 300 million by the end of the decade, as paybacks of under two years become commonplace in high-liquids formations.
Processing plants, loading racks, and gathering-line boosters round out demand. Continuous H₂S monitoring and auto-start blowers now couple with VRUs to prevent atmospheric bypass in upset conditions, smoothing compliance and reinforcing uptake across the vapor recovery units market.
By End-User:
Downstream Dominance Challenged by Chemical Sector ExpansionRefineries and terminals accounted for 35.62% of the 2025 spend, primarily driven by long-standing vapor balancing and gasoline loading mandates. Chemical and petrochemical complexes are experiencing a 7.28% CAGR, as synthetic organic chemical standards stipulate 95% capture, and as fenceline benzene monitoring triggers corrective action. Upstream shale plays generate significant growth upside, but budget-constrained independent operators still tend to gravitate toward rental programs. Emerging segments, such as biofuels and pharmaceuticals, add incremental volume, thereby widening the user base of the vapor recovery units market.
Digital-twin adoption by multinational chemical firms enables a 65% reduction in solvent use under pollution-prevention alternatives, highlighting vapor recovery as a cost-effective compliance lever.
Geography Analysis
North America Vapor Recovery Units Market
North America led the vapor recovery units market with 38.25% share in 2025, powered by rigorous EPA mandates and prolific shale output that yields high-value condensate vapors. Canada’s 2025 VOC rule, covering 434 sites, reinforces a regulatory bulwark that sustains capital flows even as marginal wells wrestle with compliance economics. Robust service networks, abundant gas takeaway, and active digital-tech pilots keep the region at the center of innovation.
APAC Vapor Recovery Units Market
The Asia-Pacific region is the pace-setter, with an 8.07% CAGR projected to 2031. China’s methane surge to 4 Tg in 2022 has triggered nationwide monitoring schemes, while South Korea’s benzene controls and India’s clean-fuel policies are expanding the addressable demand. Regional integration into global supply chains means ports and terminals must match international standards, further enlarging the vapor recovery units market.
EMEA and South America Vapor Recovery Units Market
Europe maintains solid demand through decarbonization targets and refinery revamps, whereas the Middle East & Africa progress is anchored by zero-routine-flaring pledges from NOCs and by Sour-Gas VRU retrofits on giant onshore fields. South America’s FPSO wave amplifies offshore prospects, with Brazil alone accounting for the majority of floating production orders through 2028. Collectively, converging methane strategies spotlight vapor recovery as a universal mitigation lever.
Regulatory Landscape
Methane and VOC control requirements remain a central demand driver for vapor recovery units, especially where regulators mandate high capture rates and restrict venting and routine flaring. In the United States, EPA standards under 40 CFR Part 60 (Subpart OOOOb/OOOOc) require routing emissions to a process or using control devices that achieve at least 95% emission reduction for VOCs and GHGs at affected facilities, which positions VRUs as a recognized control approach. In April 2026, the EPA finalized technical amendments affecting associated-gas flaring provisions and vent-gas net heating value continuous monitoring requirements, which increases the need for instrumented, auditable vapor capture and control configurations.
Outside the United States, policy tightening is also raising the compliance floor for vapor handling. In the European Union, Regulation (EU) 2024/1787 entered into force in August 2024, introducing requirements such as zero-emitting equipment at new sites, a ban on routine flaring, and a 99% minimum destruction efficiency for flares, which improves the relative case for recovery solutions when beneficial use is feasible. In Canada, Environment and Climate Change Canada finalized Enhanced Methane Regulations (SOR/2025-280) in December 2025, strengthening leak detection and venting control requirements and setting out prescriptive and performance-based compliance pathways, with primary compliance dates beginning January 1, 2028. That timeline is already shaping near-term planning and retrofit scoping for vapor capture and monitoring upgrades across upstream facilities.
Competitive Landscape
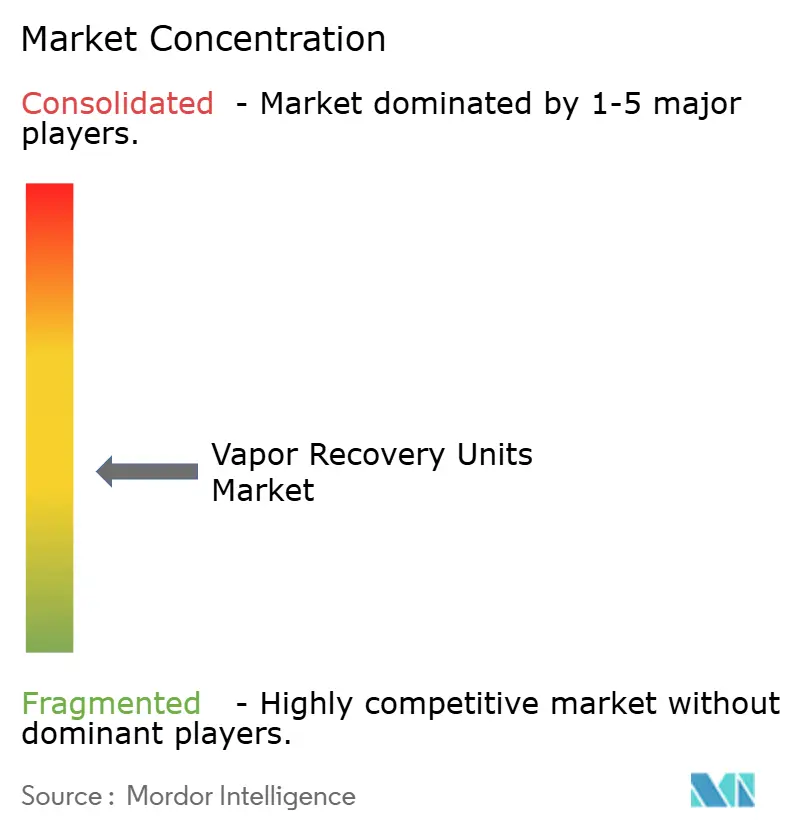
The vapor recovery units market is moderately fragmented, with a long tail of regional fabricators and a clutch of global brands specializing in combustion, vapor capture, and after-market services. John Zink Hamworthy, Zeeco, and Flogistix offer integrated packages that combine VRUs with vapor combustor or burner flare solutions, while membrane pure-plays specialize in energy-efficient separation niches. Digital twin platforms, often sourced from third-party software houses, are now bundled with hardware to ensure 10-30% reductions in downtime and maintenance spend.
Disruptive entrants such as ZEVAC leverage compressed-air drive systems to sidestep electrical infrastructure and permitting, offering ready-fit kits for Subpart OOOOb compliance. Membrane innovators commercialize graphene and mixed-matrix modules capable of achieving a 53-fold CO₂/N₂ selectivity, thereby slashing compression horsepower and redefining cost curves. As carbon pricing spreads, portfolio breadth, rapid-response service, and compliance advisory services become competitive assets within the vapor recovery units market.
Vapor Recovery Units Industry Leaders
-
John Zink Company
-
Zeeco
-
BORSIG Membrane Technology
-
Flogistix
-
Cimarron Energy Inc.
- *Disclaimer: Major Players sorted in no particular order
Vapor Recovery Units Market Companies Covered in this Report
- ALMA Carbovac
- BORSIG Membrane Technology
- John Zink Company
- Symex GmbH & Co. KG
- Aereon
- Hy-Bon Engineering
- Cool Sorption A/S
- VOCZero Ltd.
- Zeeco
- Flogistix
- Kappa GI
- Kilburn Engineering
- Cimarron Energy Inc.
- Forum Energy Technologies
- DNOW / Power Service
- Blackmer (PSG Dover)
- GARO (Atlas Copco)
- LeROI Gas Compressors
- PESCO
- Gardner Denver
- Linde Engineering
Market Opportunities and Future Outlook
Compliance-driven retrofits and monitoring-heavy operating practices are creating a clear opportunity to upgrade legacy tank batteries, terminals, and combustion-control trains toward closed-loop vapor recovery configurations that can document performance. Under EPA oil and natural gas air rules (Subpart OOOOb), routing emissions to a process via a VRU is identified as a best system of emission reduction. The April 2026 EPA technical changes on associated-gas flaring provisions and continuous monitoring requirements for vent gas from flares and enclosed combustion devices add value to VRU packages that pair recovery with data-logged sensing. As a result, demand is shifting toward turnkey systems that include automated bypass, pressure sensing, and variable frequency drive capability, aligning with the EPA Natural Gas STAR program’s description of VRU feature sets.
Beyond upstream tank vapor capture, adjacent applications are widening addressable demand where VOC capture is tied to operational permits and product-loss reduction. For example, aviation fuel storage and refueling operations have specific vapor-management needs, and recent product introductions in jet-fuel VRUs show continued commercial focus on that niche. Across end users, the near-term opportunity set centers on sites with a clear outlet for recovered gas or onsite fuel demand, where operators can justify equipment upgrades through combined compliance, product recovery, and reduced reliance on routine combustion.
Recent Industry Developments in Vapor Recovery Units Market
- May 2026: Zeeco completed an acquisition of an oil and gas technology firm to expand its vapor recovery and emissions control capabilities. The acquisition strengthens Zeeco’s ability to offer broader engineered solutions that bundle recovery with combustion and compliance equipment across oil and gas facilities.
- December 2025: Cimarron and Bell Supply formed a strategic partnership to supply a rental fleet of next-generation vapor recovery units manufactured by Cimarron’s HY-BON division. The rental-led model lowers adoption friction for operators facing tighter methane and VOC controls, while integrated machine-learning features support predictive maintenance and uptime in high-cycling field conditions.
- February 2025: Neyr Perse (MAPNA Group) commissioned a gasoline vapor recovery unit project for the National Iranian Oil Products Distribution Company, targeting recovery of vapors at storage sites in Mashhad, Tabriz, Arak, and Ahvaz. The commissioning indicates continued investment in downstream storage and distribution vapor controls in the Middle East, extending demand beyond upstream production use cases.
Vapor Recovery Units Market Report Scope and Research Methodology
Market Definition and Coverage
For this study, the vapor recovery units market covers packaged systems and engineered solutions that capture hydrocarbon vapors and route them for recovery or safe handling at oil and gas and industrial sites, where vapor losses and emissions control are key operating needs.
Scope exclusions: We exclude standalone flare systems, general HVAC ventilation equipment, and non-hydrocarbon industrial exhaust controls that do not recover fuel vapors.
Segments Covered in This Report
- By Product Type
- Compression-based VRU
- Ejector/Venturi VRU
- Membrane Separation VRU
- Condensation/Cryogenic VRU
- Absorption (Carbon) VRU
- By Process Technology
- Adsorption
- Absorption
- Condensation
- Membrane Separation
- By Flow-rate Capacity
- Below 50 Mscfd
- 50 to 200 Mscfd
- 200 to 500 Mscfd
- Above 500 Mscfd
- By Installation Site
- Onshore
- Offshore
- By Application
- Processing Plants
- Storage Tanks
- Loading and Unloading
- Pipelines and Gathering
- Flaring Gas Recovery
- By End-User
- Upstream Oil and Gas
- Downstream (Refining, Terminals)
- Chemical and Petrochemical
- Others (Biofuels, Pharma)
- By Geography
- North America
- United States
- Canada
- Mexico
- Europe
- Germany
- United Kingdom
- France
- Italy
- Russia
- Rest of Europe
- Asia-Pacific
- China
- India
- Japan
- South Korea
- ASEAN Countries
- Rest of Asia-Pacific
- South America
- Brazil
- Argentina
- Rest of South America
- Middle East and Africa
- Saudi Arabia
- United Arab Emirates
- South Africa
- Egypt
- Rest of Middle East and Africa
- North America
Data Sources, Market Sizing, and Validation
Desk Research
Desk work started with public rules and operating signals that explain where VRUs are used and why. We referred to sources such as the US EPA, the European Environment Agency, and UN Environment publications for emissions context, then cross-checked activity levels using EIA data, IEA publications, and refinery and chemical statistics shared by industry associations.
To keep the sizing grounded, we also reviewed company annual reports, investor decks, and press releases for project activity, product launches, and regional demand commentary. In addition, we used paid subscriptions for company financials and intelligence, patents, and global contracts and tenders, which helped track bidding intensity and technology focus over time. The sources named here are illustrative, and many other public and paid references were also used for data collection, validation, and research clarification.
Primary Interviews and Surveys
Primary work was used to validate where VRUs are being bought, which end sites are prioritized, and how pricing and lead times move across regions. We spoke with a mix of equipment suppliers, EPC participants, and end users across storage, downstream, and chemical operations, then reconciled differences through follow-up calls when assumptions did not line up.
Distribution of primary research fieldwork respondents
| Company type | Respondent position | Region |
|---|---|---|
| Top tier: 28% | CXOs: 21% | APAC: 41% |
| Mid tier: 51% | Functional/Unit leaders: 22% | EMEA: 36% |
| Smaller Players: 21% | Managers: 57% | Americas: 23% |
Market-Sizing & Forecasting
Sizing was built using a top-down and bottom-up blend, where emissions control needs and hydrocarbon handling activity were first translated into likely VRU demand pools by region, then checked against what suppliers and channels report as realistic shipments and project flow. Since VRUs are not purchased uniformly, we used installation intensity across storage tanks and downstream facilities, typical flow-rate capacity bands (for example, 50 to 200 Mscfd and 200 to 500 Mscfd), and an onshore versus offshore project mix to keep totals practical.
Key inputs included refinery throughput and utilization signals, crude and product storage additions, flaring and vapor control enforcement direction, average selling price movement by technology (such as adsorption, compression, and membrane separation), and the share of projects that choose skid-mounted packages versus engineered systems. Where bottom-up checks were incomplete, gaps were handled by using ranges from interview-led price and volume assumptions, then trimming outliers that did not fit the site and capacity mix.
For forecasting, we relied on scenario analysis supported by a light multivariate regression check, so the outlook stays connected to drivers like capacity additions, downstream project cycles, and tightening emissions requirements. Assumptions on technology mix shifts, especially the pace of membrane adoption and offshore growth, were reviewed with primary experts before finalizing the yearly build.
Data Validation & Update Cycle
Outputs were validated through multiple checks, including cross-verifying regional totals against independent activity indicators like refinery runs, storage build announcements, and typical VRU attach rates for tank and terminal upgrades. When a segment showed unusual jumps, we revisited the underlying price, capacity, or installation mix assumptions and then re-contacted interviewees if the variance could not be explained by policy or project timing.
A second analyst review was completed before sign-off, with focus on currency conversion consistency, year-on-year progression, and whether shares reconcile back to the total market. Reports are refreshed annually, and interim updates are done when material events occur, such as major regulatory actions, supply constraints, or demand shocks. Before delivery, we run a final freshness pass so clients receive the latest updated view.
Mordor Intelligence's Vapor Recovery Units Market Size Measured Against Other Published Estimates
Published market sizes for vapor recovery units can differ even when they appear to track the same equipment, because the scope and counting rules are not always aligned. Differences usually come from whether the estimate is anchored to installed demand at oil and gas and downstream sites, how capacity bands are treated, and whether adjacent systems are grouped into the same total.
In our work, numbers shift mainly when storage tank vapor control is counted alongside downstream and chemical applications, and when technology-specific pricing (adsorption, compression, and membrane separation) is carried forward instead of using a single blended ASP. Another driver is refresh cadence, since a newer cut can incorporate recently awarded terminal and refinery projects sooner, which is how the 2026 total is kept tight to current activity in Mordor Intelligence.
Benchmark comparison
| Source | Market Size | Gaps in Research Methodology |
|---|---|---|
| Mordor Intelligence | USD 1.01 B (2026) | |
| Industry Association A | USD 0.92 B (2026) | Often reflects a narrower counted base tied mainly to tank and terminal vapor control, with limited capture of downstream and chemical site demand, and conservative replacement-cycle assumptions. |
| Global Consultancy B | USD 1.18 B (2026) | Commonly folds in adjacent emissions control and recovery packages, and may apply a higher blended ASP progression without separating adsorption, compression, and membrane pricing paths. |
The table shows that the biggest swings come from what is included around recovery and control equipment, and from how price is carried forward across technologies and capacity sizes. By tying totals back to application mix (such as storage tanks) and realistic capacity bands, then re-checking the result with supplier and project signals, the final number stays traceable to clear inputs and repeatable steps.
Key Questions Answered in the Report
What is the global value of the vapor recovery units market in 2026?
The vapor recovery units market size is USD 1.01 billion in 2026.
How fast is the vapor recovery units market expected to grow?
It is forecast to post a 6.98% CAGR between 2026 and 2031.
Which region will expand the quickest?
Asia-Pacific is projected to record the fastest 8.07% CAGR through 2031.
Why are membrane VRUs gaining traction?
Membrane units cut energy use by more than 50% and avoid carbon-bed regeneration downtime, giving them the highest 8.34% CAGR among product types.
What regulatory driver is most significant in North America?
The EPA methane rule enforces 95% VOC and GHG reductions and couples with an escalating Waste Emissions Charge that rises to USD 1,500 t-¹ by 2026.
How do VRUs create economic returns?
A single installation can yield annual revenues of roughly USD 132,000 from recovered rich gas against typical capex of USD 100,000, delivering sub-one-year paybacks.