
Market Overview
| Study Period | 2021 - 2031 |
|---|---|
| Forecast Data Period | 2026 - 2031 |
| Base Year Market Size (2025) | 8.77 gigawatt |
| Market Volume (2026) | 10.5 gigawatt |
| Market Volume (2031) | 25.91 gigawatt |
| Growth Rate (2026 - 2031) | 19.78 % |
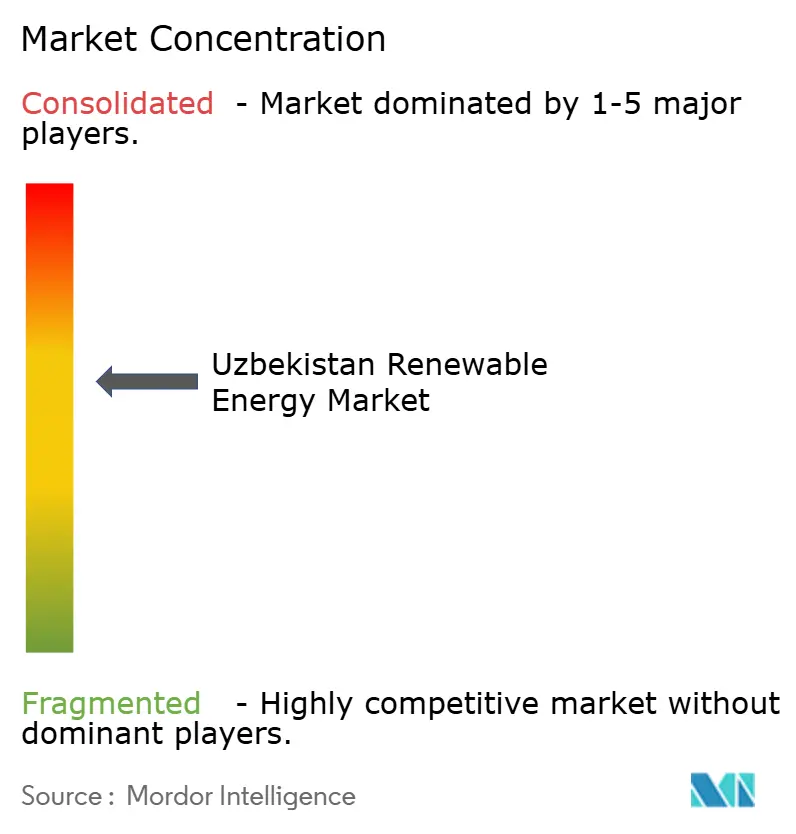
| Market Concentration | Medium |
Major Players *Disclaimer: Major Players sorted in no particular order Image © Mordor Intelligence. Reuse requires attribution under CC BY 4.0. | |
Uzbekistan Renewable Energy Market Analysis by Mordor Intelligence
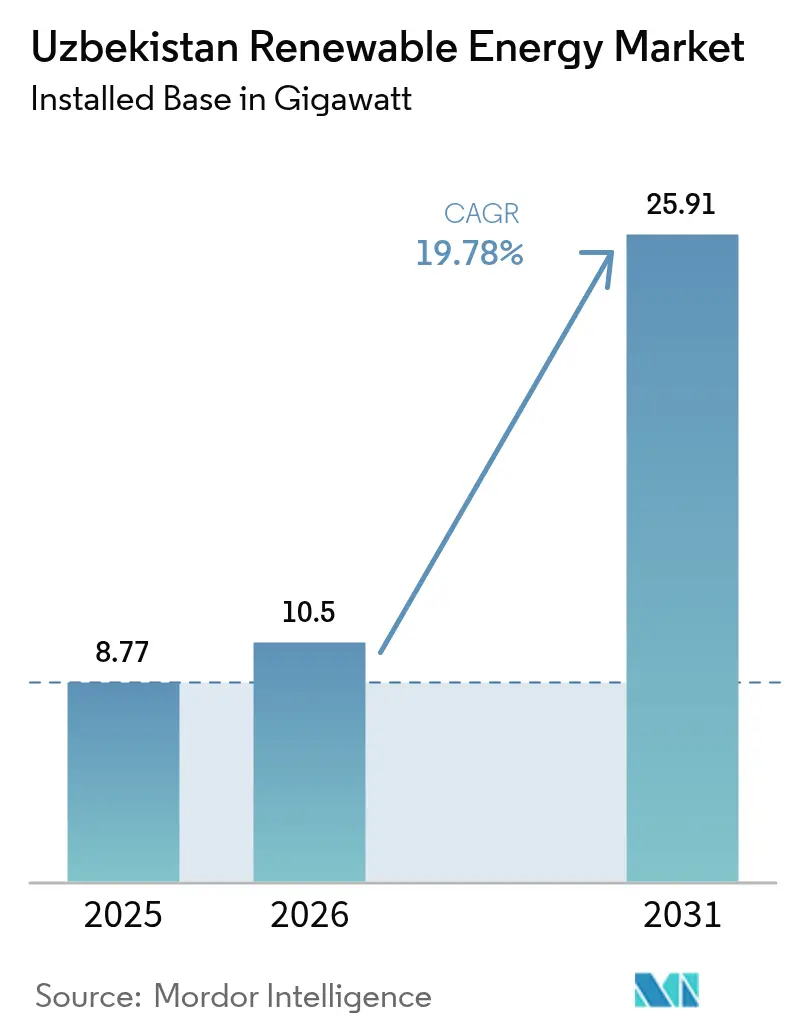
The Uzbekistan Renewable Energy Market size in terms of installed base is expected to grow from 8.77 gigawatt in 2025 to 10.5 gigawatt in 2026 and is forecast to reach 25.91 gigawatt by 2031 at 19.78% CAGR over 2026-2031.
The Uzbekistan renewable energy market is expanding due to the government's increased commitment to renewables, with a goal of 54% by 2030, the accelerated retirement of thermal plants that have been in service for more than 30 years, and the prioritization of multilateral-backed solar and wind projects. Competitive tariffs in early tenders fell below USD 0.03 per kWh, drawing Gulf and Chinese developers that supply capital, engines, and EPC services. Declining domestic gas production and rising export opportunities further tilt the new generation toward renewables. Grid modernization, battery-storage bundling, and corporate demand for I-REC-certified power provide added momentum.
Key Report Takeaways
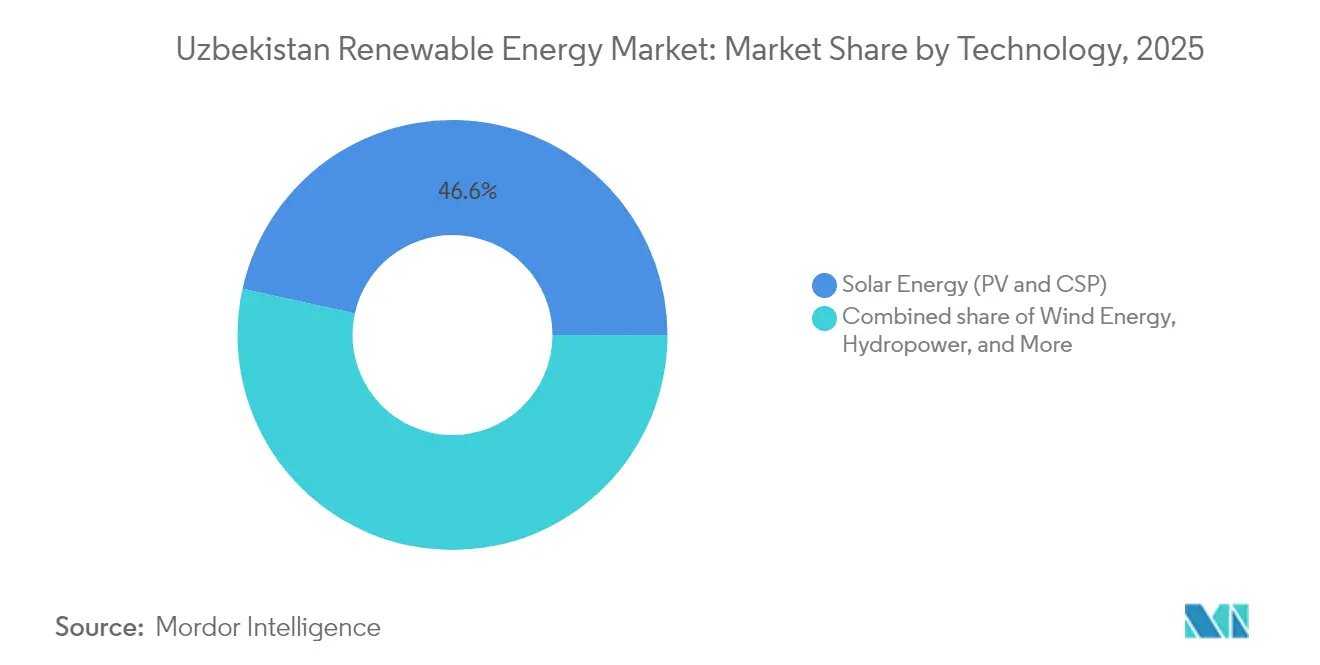
- By technology, solar energy led with 46.55% of the Uzbekistan renewable energy market share in 2025, while wind energy is projected to expand at a 36.96% CAGR through 2031.
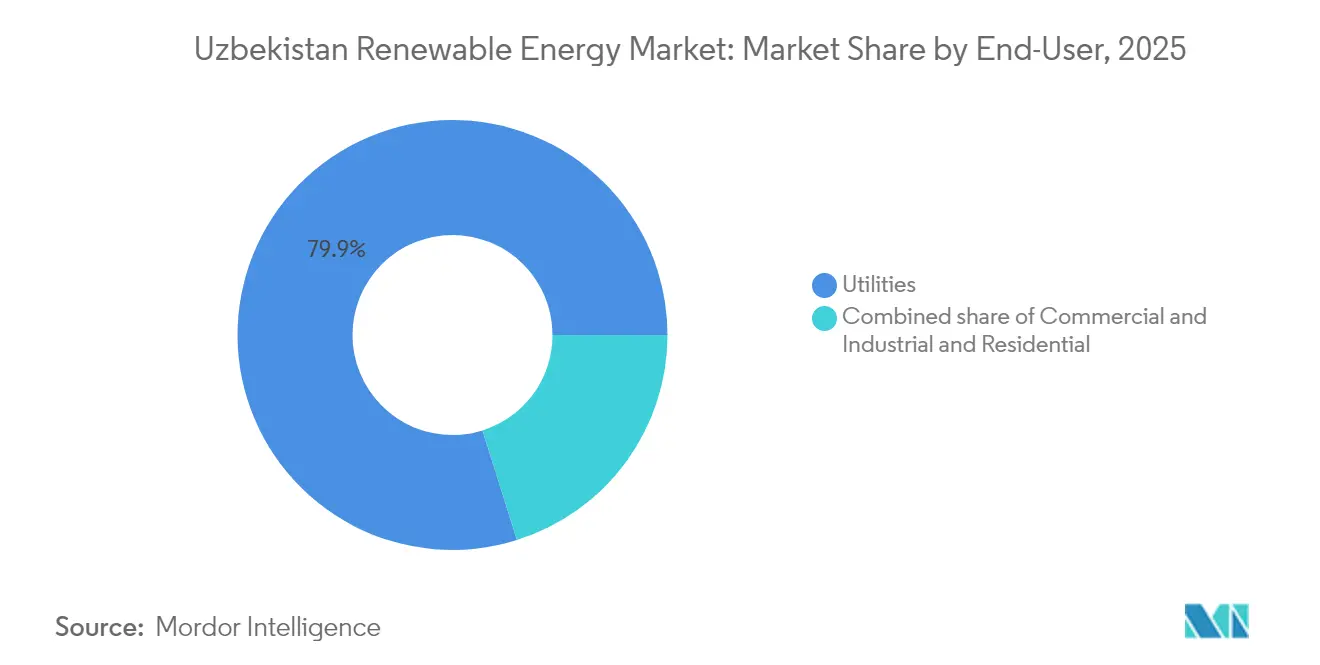
- By end-user, utilities accounted for an 79.85% share of the Uzbekistan renewable energy market in 2025, and they are forecasted to grow at a 21.83% CAGR through 2031.
Note: Market size and forecast figures in this report are generated using Mordor Intelligence’s proprietary estimation framework, updated with the latest available data and insights as of 2026.
Uzbekistan Renewable Energy Market Trends and Insights
Drivers Impact Analysis*
| Driver | (~) % Impact on CAGR Forecast | Geographic Relevance | Impact Timeline |
|---|---|---|---|
| Upcoming solar & wind tenders (2025-2029) | +4.2% | National, high in Bukhara, Navoi, Karakalpakstan, Samarkand | Short term (≤ 2 years) |
| Ambitious 25 GW renewable target by 2030 | +3.8% | National | Medium term (2-4 years) |
| Multilateral development-bank financing | +3.5% | National, priority in Jizzakh, Samarkand, Syrdarya | Medium term (2-4 years) |
| Grid-parity PPAs from textile exporters | +2.1% | Fergana Valley textile hubs | Medium term (2-4 years) |
| Cross-border green-hydrogen memoranda | +1.9% | Tashkent–Almaty corridor | Long term (≥ 4 years) |
| Declining domestic natural-gas production | +2.6% | National | Short term (≤ 2 years) |
| Source: Mordor Intelligence | |||
Upcoming Solar and Wind Tenders Drive Investment Acceleration
The structured pipeline for 22 solar and wind stations under construction, totalling 9 GW, clarifies project sequencing and improves supply-chain planning for developers, thus catalyzing the Uzbekistan power market. Winning bids such as Masdar’s 300 MW Kashkadarya plant at 3.0 cents per kWh underscore a trend toward record-low tariffs that reinforce grid-parity economics.(1) Tender rules now require storage blocks of 100-500 MWh, embedding resilience in project design and smoothing variable generation curves. Payment guarantees issued through the National Electric Grid of Uzbekistan cut counterparty risk, which in turn unlocks competitively priced project debt from global lenders.
Ambitious 25 GW Renewable Target Reshapes the Energy Mix
The 25 GW target redirects capital flow toward clean assets and demands an annual build-out of roughly 3.5 GW, a rate that has never been attempted in Central Asia before.(2)Implementation hinges on the Public-Private Partnership law of 2019 that secures long-term offtake and offers tax holidays, thereby lowering the hurdle rate for sponsors. Solar capacity will dominate at 12 GW, supported by wind (8 GW) and small hydro (5 GW), with each technology matched to region-specific resource endowments. Complementary plans to erect 2,700 km of transmission and modernise substations help accommodate energy flows from remote generation zones to urban load pockets.
Multilateral Development Bank Financing Unlocks the Project Pipeline
Annual commitments from the ADB, EBRD, and the World Bank exceed USD 2 billion and typically include risk-sharing structures, such as partial credit guarantees or political risk insurance. The Scaling Solar framework alone mobilised 1 GW of solar and 500 MW of wind between 2020 and 2024, proving the scalability of blended finance templates. Co-financing arrangements align currency baskets with power-purchase settlements, thereby limiting foreign exchange mismatch exposure for developers and the National Electric Grid of Uzbekistan.
Cross-Border Green-Hydrogen Memoranda Spur Export Ambitions
Agreements with Kazakhstan outline collaborative pathways for green hydrogen and associated ammonia exports, positioning western Uzbekistan as a synthetic-fuel bridge to Caspian Sea hubs.(3) Early studies highlight favorable wind speeds that can anchor co-located electrolyser complexes, complementing domestic demand growth while adding a new export revenue stream.
Restraints Impact Analysis*
| Restraint | (~) % Impact on CAGR Forecast | Geographic Relevance | Impact Timeline |
|---|---|---|---|
| Limited grid transmission capacity | -2.8% | National, acute in Bukhara, Navoi, Karakalpakstan | Short term (≤ 2 years) |
| Currency-convertibility & offtaker bankability risk | -1.9% | National | Medium term (2-4 years) |
| Slow land-lease approvals at provincial hokimiyats | -1.3% | Provincial, particularly in Samarkand, Fergana, Kashkadarya | Short term (≤ 2 years) |
| Lack of local technical workforce and supply chain capacity | -1.6% | National | Medium term (2-4 years) |
| Source: Mordor Intelligence | |||
Limited Grid Transmission Capacity Constrains Renewable Integration
Legacy grids were engineered for centralised thermal plants and now struggle to manage dispersed renewable inputs, creating curtailment risks in wind-rich Karakalpakstan. The Digitize to Decarbonize program, worth USD 125 million, introduces supervisory control systems that enhance dispatch flexibility. Construction of 944 km of new high-voltage lines and six substations is underway, yet commissioning delays could stall projects queued for connection. Real-time monitoring aims to reduce technical losses, currently pegged at 12-15% of generation, a prerequisite for the stable expansion of the Uzbekistan power market.
Currency Convertibility and Offtaker Bankability Create Investment Uncertainty
The som’s volatility, despite IMF Article VIII compliance, prompts lenders to demand hard-currency power-purchase contracts plus third-party guarantees. Planned bank-sector reforms intend to privatise 60% of state-owned banks by 2025 to deepen credit intermediation.(4) Meanwhile, development banks extend local-currency tranches and hedging instruments that cushion forex shocks, although transaction costs remain elevated relative to markets with stable currencies. Tariff reforms scheduled through 2026 aim for full cost recovery, thereby improving the balance sheet of the National Electric Grid and lifting its credit profile.
*Our forecasts treat driver/restraint impacts as directional, not additive. The impact forecasts reflect baseline growth, mix effects, and variable interactions.
Segment Analysis
By Technology: Wind Acceleration Outpaces Solar Maturity
Solar held 46.55% of installed capacity in 2025 and remains the core of the Uzbekistan renewable energy market. Tariffs below USD 0.03 per kWh and high irradiation of more than 1,800 kWh /m² sustain this position. Wind is climbing faster, with a projected 36.96% CAGR to 2031, anchored by the 521.7 MW Zarafshan project and other large farms where average speeds reach 7–8 m/s. Hydropower operates at 2,382 MW and is expanding to 3,000 micro-hydro stations, which will add 160 MW by 2026, extending clean power to mountain villages. Bioenergy moves from pilot to portfolio scale, with eight waste-to-energy plants set to handle 4.7 million t of refuse and supply 2.1 billion kWh each year. Geothermal studies are still in their early stages, and ocean energy is not relevant in Uzbekistan, which is landlocked.
Utility-scale wind investment below USD 1.3 million per MW, combined with improvements in rotor technology, lowers the levelized costs, helping the segment close the price gap with solar. Storage pairing of 1,800 MW in 2025 tenders further levels dispatch profiles between the two resources. Solar developers test agrivoltaic models that integrate crop production, which may unlock additional land in densely farmed regions. Hydropower rehabilitation and new micro-hydro plants cater to off-grid demand without extensive transmission build. Bioenergy supports municipal waste goals and serves as a substitute for gas in baseload supply, complementing variable wind and solar energy.

By End-User: Utilities Anchor Growth, C&I Demand Emerges
Utilities owned 79.85% of capacity in 2025. Long-term PPAs with dollar indexing and sovereign backing enable high leverage and a forecast 21.83% CAGR. ACWA Power and Masdar each control multi-gigawatt pipelines that integrate solar, wind, and storage, confirming utility leadership in the Uzbekistan renewable energy market size statistics. Commercial and industrial buyers are starting to sign virtual PPAs after Uzbekistan’s 2025 entry into the I-REC system, with textile exporters being the most active as they prepare for EU carbon rules. Data centers in Tashkent also plan to install on-site solar plus storage to hedge against rising tariffs.
True bilateral wheeling remains absent because NEGU remains the sole buyer, so C&I deals rely on financial settlement. Even so, grid-parity economics improve as business tariffs rose in 2023 and residential rates climbed in 2024. Residential uptake remains low despite a 1,000-sum/kWh subsidy, as paybacks exceed eight years and consumer loans are scarce. Battery-based EV charging hubs, such as Huawei’s 720 kW station in Tashkent, may create new retail demand pockets and showcase distributed models that bridge the utility and commercial and industrial (C&I) segments.
Geography Analysis
Karakalpakstan leads wind development thanks to sustained speeds above 7 m/s, hosting ACWA Power’s Kungrad cluster and Masdar’s Zarafshan project that collectively exceed 1 GW and supply households across multiple provinces. Samarkand and Jizzakh emerge as solar heartlands, combining high irradiation with short interconnection distances to main load centres; EBRD-backed 220 MW farms and China Datang’s 263 MW facility illustrate the region’s appeal. The Fergana Valley experiences robust demand growth tied to export-oriented textile production, prompting firms to adopt captive solar and storage solutions to secure competitively priced electricity.
Tashkent province remains the principal demand node and hosts the largest announced battery storage facilities, providing ancillary services that stabilise the national grid. Southern oblasts, such as Kashkadarya and Surkhandarya, attract international sponsors through land availability and government incentives, and they benefit from ADB-supported urban infrastructure programs that incorporate energy-efficient public buildings. Navoi and Bukhara diversify their energy sources with hybrid solar-wind schemes tailored to resource complementarity, thereby enhancing their year-round output profiles.
Western regions face acute network congestion, necessitating the installation of 500 kV lines to evacuate power eastward. Multilateral agencies co-finance these backbones and integrate digital control layers that optimise power flow. The Kazakhstan-Azerbaijan-Uzbekistan green energy corridor remains a strategic priority that could channel up to 20 GW of renewable surplus toward European markets, translating local capacity growth into cross-border revenue. Rural areas still face access deficits, so decentralized solar home systems and mini-grids, financed by the UNDP, expand their social impact while enlarging the addressable base of the Uzbekistan power market.
Regulatory Landscape
Uzbekistan renewable energy is governed by the Law on the Use of Renewable Energy Sources (No. ZRU-539, 2019) and subsequent amendments that define state support, grid connection principles, and the basis for private participation under the country’s PPP framework. In practice, utility-scale renewable tariffs are predominantly discovered through competitive tenders, which has supported bankable PPAs for solar and wind projects signed with the single-buyer system.
The Ministry of Energy acts as the primary state body for the sector, while the Agency for Development and Regulation of the Energy Market oversees electricity-market rules, compliance monitoring, and tariff methodology. Legal changes in 2024 introduced a formal framework for green energy certificates (Law No. ZRU-906), supporting certificate issuance and trading alongside power sales, and the Electric Power Industry law (No. ZRU-939, 2024) further codified market organization. In April 2026, Presidential Decree No. UP-70 set 2026 resource-saving and energy-efficiency targets and promoted the wider adoption of renewable energy technologies across economic and social sectors, reinforcing policy pull for compliant renewable installations.
Competitive Landscape
The sector exhibits moderate concentration, as JSC Uzbekgidroenergo retains control of legacy infrastructure and manages approximately 98% of current electricity needs; however, private capacity additions are diluting that dominance. ACWA Power pledges USD 15 billion and lines up multi-gigawatt solar-wind-storage ventures, while Masdar cements its foothold through competitively priced tenders, such as Zarafshan. Voltalia leverages hybrid clusters to capture value across day-night load cycles, underscoring an industry trend toward technology stacking.
White-space opportunities emerge in distributed generation for industrial estates, rural electrification packages, and ancillary-service storage systems. Chinese actors such as China Datang and PowerChina supply EPC expertise and tier-one modules, facilitated by diplomatic ties and cost advantages, thereby intensifying price competition. Technology differentiation centres on advanced battery chemistries and AI-enabled grid-management platforms that maximise renewable dispatchability. New entrants in the Uzbekistan power industry are targeting data analytics and predictive maintenance for wind farms, a niche that aligns with the rising operational complexity.
Policy consistency under the PPP framework ensures bankable cash flows that attract investors from Western, Gulf, and Asian regions alike. The financial close for a EUR 1.2 billion, 1.6 GW combined-cycle gas project illustrates ongoing fuel diversification and hedging against renewable intermittency. Meanwhile, state-led nuclear collaboration with France’s Orano on uranium mining seeks to secure future baseload options, adding another layer to the competitive mosaic.
Uzbekistan Renewable Energy Industry Leaders
-
JSC Uzbekgidroenergo
-
Masdar
-
Voltalia SA
-
TotalEnergies SE
-
ACWA Power
- *Disclaimer: Major Players sorted in no particular order
Market Opportunities and Future Outlook
Grid-forming and balancing capacity is emerging as a whitespace area as Uzbekistan moves from adding standalone solar and wind toward pairing variable generation with storage and dispatch solutions. Recent financings and project designs reflect this shift: in January 2026, ADB and Masdar signed a USD 30 million financing package for a 300 MW solar plant with a 75 MWh BESS in Guzar (Kashkadarya), and Voltalia began construction of the Artemisya hybrid cluster in Bukhara with a 100 MW/200 MWh BESS integrated into the buildout. This supports demand for BESS integrators, EMS and forecasting software, inverter suppliers, and EPCs with hybrid-plant delivery experience, alongside grid services that reduce curtailment risk in constrained regions.
Corporate and export-linked demand provides a second opportunity track through credible renewable attribute accounting. Uzbekistan’s entry into I-REC (2025) enables exporters to document green electricity use while the market remains dominated by the single-buyer structure. Bankable offtake and standardized procurement also keep international capital engaged, particularly where multilateral lenders and the National Electric Grid of Uzbekistan (NEGU) support project bankability. Cross-border green hydrogen and power-corridor workstreams referenced in national and multilateral programs further expand the addressable market for renewable-to-X studies, grid interconnection planning, and industrial-scale electrification, provided developers can align land, permitting, and grid access with the tender pipeline and transmission upgrade sequencing.
Recent Industry Developments
- June 2026: ACWA Power signed green financing agreements worth USD 533 million for the Tashkent Riverside project, covering a 200 MW solar plant coupled with a 500 MWh battery energy storage system. The deal reinforces the market shift toward hybrid renewable-plus-storage builds that address peak and flexibility needs alongside new generation additions.
- May 2026: ACWA Power signed a USD 116 million financing package with the Asian Development Bank to support construction of the 300 MW Bash 2 wind power plant in the Bukhara region. Development-bank funding tied to a specific wind asset strengthens the bankability template for large-scale wind under the single-buyer PPA structure and supports continued tender-led capacity additions.
- December 2024: Masdar inaugurated its 500 MW Zarafshan wind farm, supplying about 500,000 households and avoiding around 1.1 million tonnes of CO2 per year. Commissioning of a utility-scale wind flagship improved execution confidence for subsequent wind auctions and reinforced the role of international developers in Uzbekistan’s renewable buildout.
Research Methodology Framework and Report Scope
Market Definition and Coverage
This market covers renewable power capacity in Uzbekistan, measured as installed capacity connected to the grid or credibly contracted to be commissioned, and tracked by technology across utility-scale and distributed projects.
Scope exclusions: We exclude conventional thermal generation, standalone captive generators that do not export power, and short-term electricity trading values that do not reflect renewable capacity build-out.
Segmentation Overview
- By Technology
- Solar Energy (PV and CSP)
- Wind Energy (Onshore and Offshore)
- Hydropower (Small, Large, PSH)
- Bioenergy
- Geothermal
- Ocean Energy (Tidal and Wave)
- By End-User
- Utilities
- Commercial and Industrial
- Residential
Data Sources, Market Sizing, and Validation
Desk Research
Desk research begins with public records describing Uzbekistan's power system and the renewable build-out, then we consolidate them into one consistent year-by-year view. Sources reviewed include official energy and power sector releases (such as from Uzbekistan's Ministry of Energy), national statistics publications, grid or transmission operator updates, and international agency datasets such as IEA and IRENA.
We also used public project-level disclosures from development banks, tender and auction announcements, and environmental and permitting notices where available to confirm capacity, status, and planned commissioning dates. To complete the picture, company filings and investor presentations were checked alongside reputable press reporting, and selective paid subscriptions for company financials and intelligence plus a global contracts and tenders database were used to track awards and procurement milestones. These examples are not exhaustive, and many other sources were consulted for data collection, validation, and clarification.
Primary Interviews and Surveys
Interviews and surveys with developers, utilities, EPC advisers, equipment distributors, and energy managers in Uzbekistan help clarify operating capacity, commissioning timing, utilization, tender status, and gaps in public records. We recheck unusual responses and use the findings to adjust secondary totals and final assumptions.
Distribution of primary research fieldwork respondents
| Company type | Respondent position |
|---|---|
| Top tier: 27% | CXOs: 18% |
| Mid tier: 48% | Functional/Unit leaders: 30% |
| Smaller Players: 25% | Managers: 52% |
Market-Sizing & Forecasting
Sizing is built using a top-down capacity build approach where national targets, grid connection plans, and project award lists are converted into year-by-year installed capacity in GW. Results are then checked with selective bottom-up approximations, such as rolling up a sample of commissioned and contracted projects and comparing implied annual additions with what procurement timelines can support.
Key inputs include awarded and signed capacity by technology, expected construction and commissioning lags, grid interconnection readiness, likely curtailment and availability patterns, and the pace of tenders and auctions. When a project is announced but lacks a clear milestone trail, the gap is handled by applying conservative timing based on comparable projects, and then revisiting that timing during expert calls.
For forecasting, scenario analysis is used so slower or faster build-out can be reflected without forcing one straight-line outcome. The base case is anchored on visible awards and financing progress, followed by sensitivities around commissioning delays and the share of utility-scale versus distributed additions.
Data Validation & Update Cycle
Outputs are triangulated against independent signals, including publicly stated capacity targets, known project milestones, and implied annual additions that the grid can reasonably absorb. If a year shows a jump that does not match tender cadence or financing visibility, the drivers are rechecked and, when needed, clarifying follow-ups are triggered with industry contacts.
Before sign-off, the model and key assumptions go through multi-step analyst review, including variance checks across historical capacity additions and technology mix. Reports refresh annually, with interim updates when material events occur, such as major award rounds, cancellations, or policy changes. Right before delivery, an analyst performs a fresh pass so clients receive the latest updated view.
Mordor Intelligence's Uzbekistan Renewable Energy Market Size Compared Against Other Published Estimates
Published estimates for Uzbekistan renewables often diverge because the underlying measurement is not always the same, and the included demand pool can shift across publishers. In practice, differences show up when one view reports installed capacity in GW while another reports investment value in USD, and when early-stage announcements are blended with operational assets.
By checking tender-award maturity, grid-connection progress, and realistic commissioning timing, Mordor Intelligence keeps the 2025 total tied to capacity that is operating or credibly advancing, rather than counting aspirational targets as installed capacity. Gaps also come from how hydropower is treated versus solar and wind, how currency timing is applied in USD-based models, and how quickly assumptions are refreshed after award delays or contract changes.
Benchmark comparison
| Source | Market Size | Gaps in Research Methodology |
|---|---|---|
| Mordor Intelligence | USD 8.77 B (2025) | |
| Global Consultancy A | USD 2.95 B (2023) | Reported in USD value terms, which can blend equipment spend, EPC, and services, and it may not map cleanly to capacity additions tracked in GW for the same timeframe. |
| Industry Publisher B | USD 3.65 B (2025) | Uses installed base in GW but with a smaller 2025 base, which can reflect a tighter technology coverage set or stricter rules on whether contracted projects are counted before commissioning. |
Overall, the comparison shows that unit choice and project-stage counting rules are the main reasons totals diverge. When the scope is anchored to clear milestones and the year-by-year build path is validated with independent signals, the market size becomes easier to trace and repeat.
Key Questions Answered in the Report
How large was renewable capacity in Uzbekistan at the end of 2026?
Installed renewable capacity reached 10.5 GW.
What is the forecast growth rate for renewable power through 2031?
Capacity is projected to expand at a 19.78% CAGR from 2026 to 2031.
Which technology segment is expected to grow the fastest?
Wind energy is forecast to post a 36.96% CAGR, the fastest of all segments.
What share of capacity did utilities own in 2025?
Utilities controlled 79.85% of total renewable capacity.
Why are corporate PPAs becoming more common?
Uzbekistan joined the I-REC system in 2025, allowing exporters to document green power use for EU carbon compliance.
What is the main barrier to faster deployment?
Limited grid transmission capacity, especially in remote solar and wind zones, is the leading short-term bottleneck.