
Utility And Energy Analytics Market Size and Share
Market Overview
| Study Period | 2020 - 2031 |
|---|---|
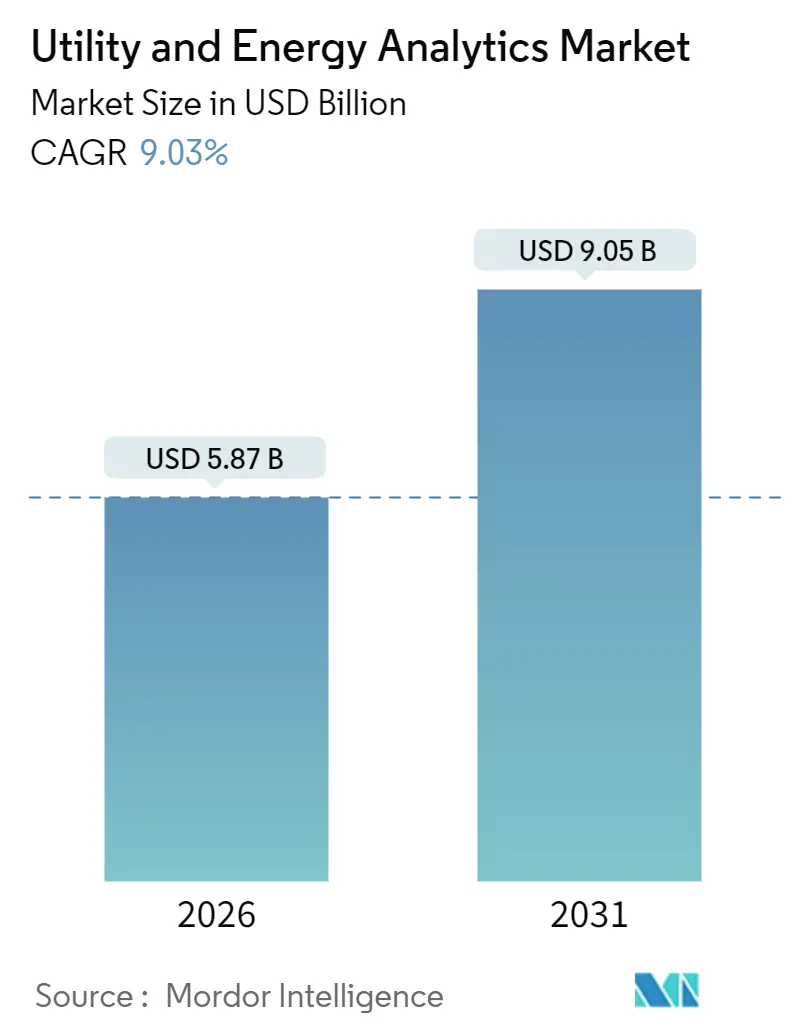
| Market Size (2026) | USD 5.87 Billion |
| Market Size (2031) | USD 9.05 Billion |
| Growth Rate (2026 - 2031) | 9.03 % |
| Fastest Growing Market | Asia Pacific |
| Largest Market | North America |
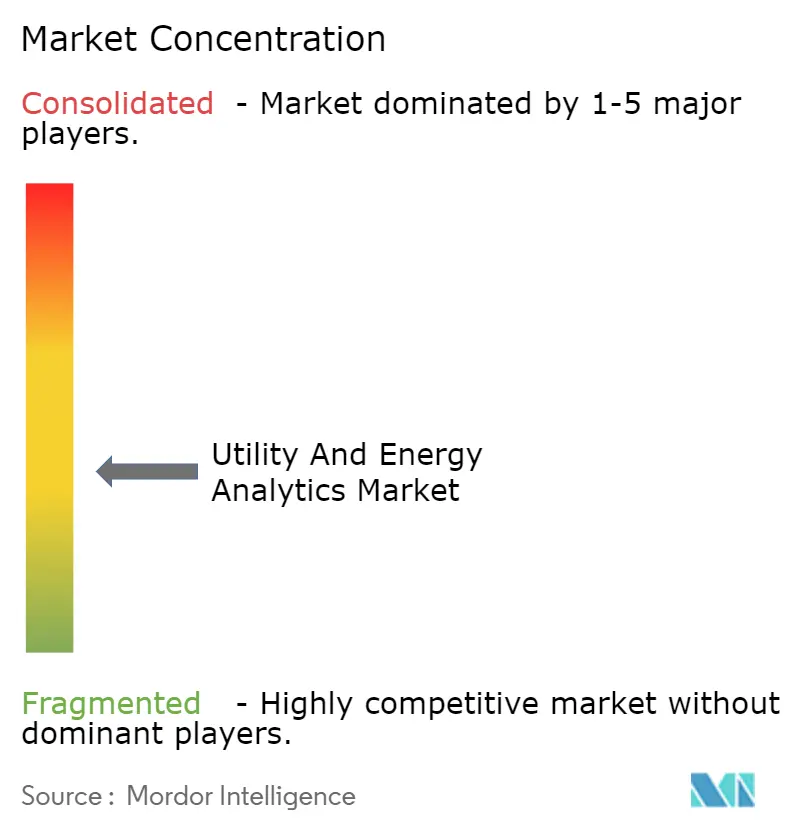
| Market Concentration | Medium |
Major Players *Disclaimer: Major Players sorted in no particular order Image © Mordor Intelligence. Reuse requires attribution under CC BY 4.0. | |
Utility And Energy Analytics Market Analysis by Mordor Intelligence
The utility and energy analytics market size is USD 5.87 billion in 2026 and is projected to reach USD 9.05 billion by 2031, reflecting a 9.03% CAGR. Accelerated renewable-portfolio mandates, surging data-center demand, and wholesale-price swings are prompting utilities to replace deterministic planning with predictive intelligence. Vendors are expanding hybrid deployments and edge architectures that pair on-premise control with cloud scalability, while utilities increasingly favor subscription models bundled with managed services. Implementation complexity is also pushing services revenue ahead of pure software licensing, and grid operators are monetizing demand response to defer capital-intensive transmission upgrades. Competitive intensity remains moderate as incumbents leverage installed bases and start-ups carve out niches in virtual power plant orchestration, condition-based maintenance, and transformer health scoring.
Key Report Takeaways
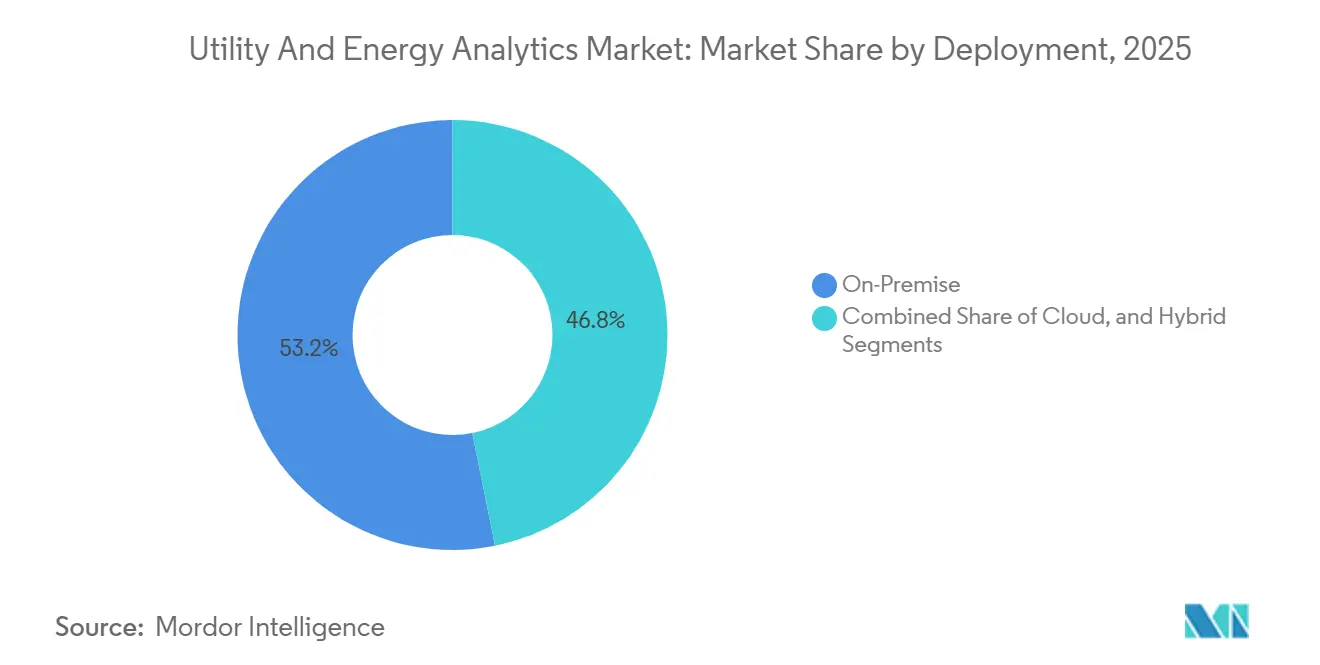
- By deployment, on-premise commanded 53.16% of the utility and energy analytics market share in 2025, while hybrid grew at a 13.07% CAGR through 2031.
- By component, software platforms captured 65.72% of 2025 revenue; services recorded the fastest 12.21% CAGR to 2031.
- By application, meter operations led with 31.56% of 2025 revenue; demand response expanded at a 13.86% CAGR to 2031.
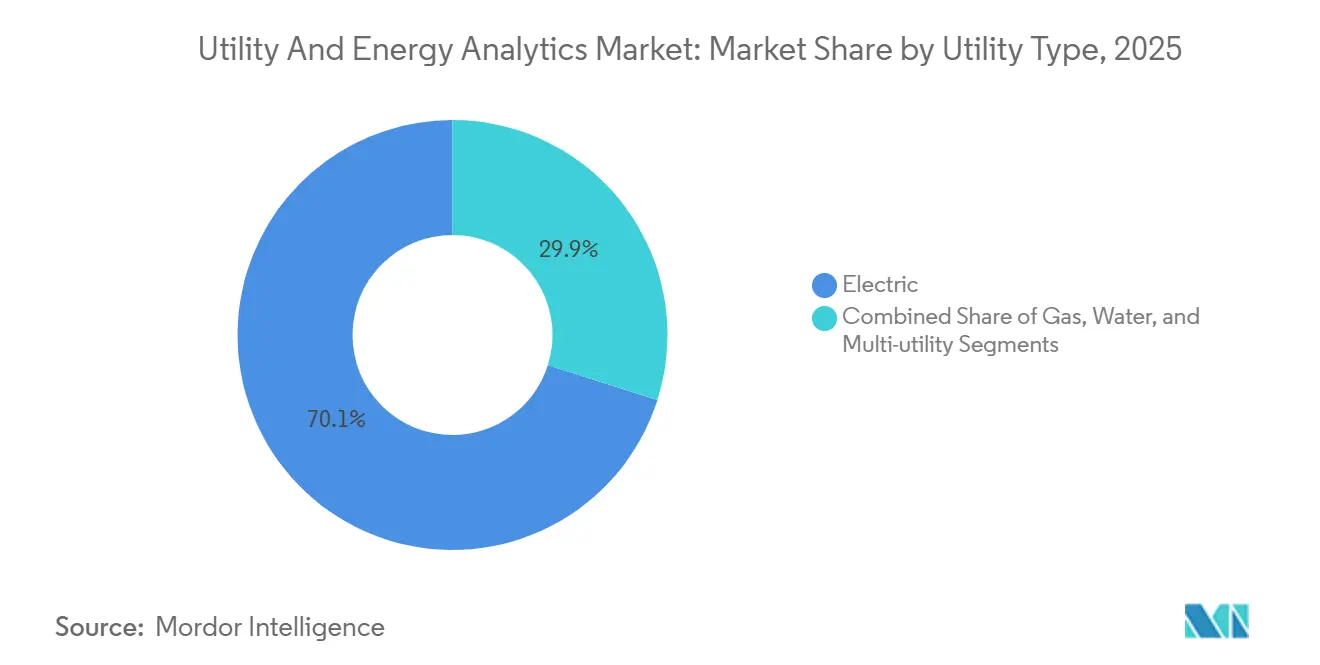
- By utility type, electric utilities held 70.12% revenue in 2025; water utilities advanced at a 10.23% CAGR through 2031.
- By end-user, transmission and distribution operators accounted for 38.03% spending in 2025; retail suppliers registered an 11.21% CAGR to 2031.
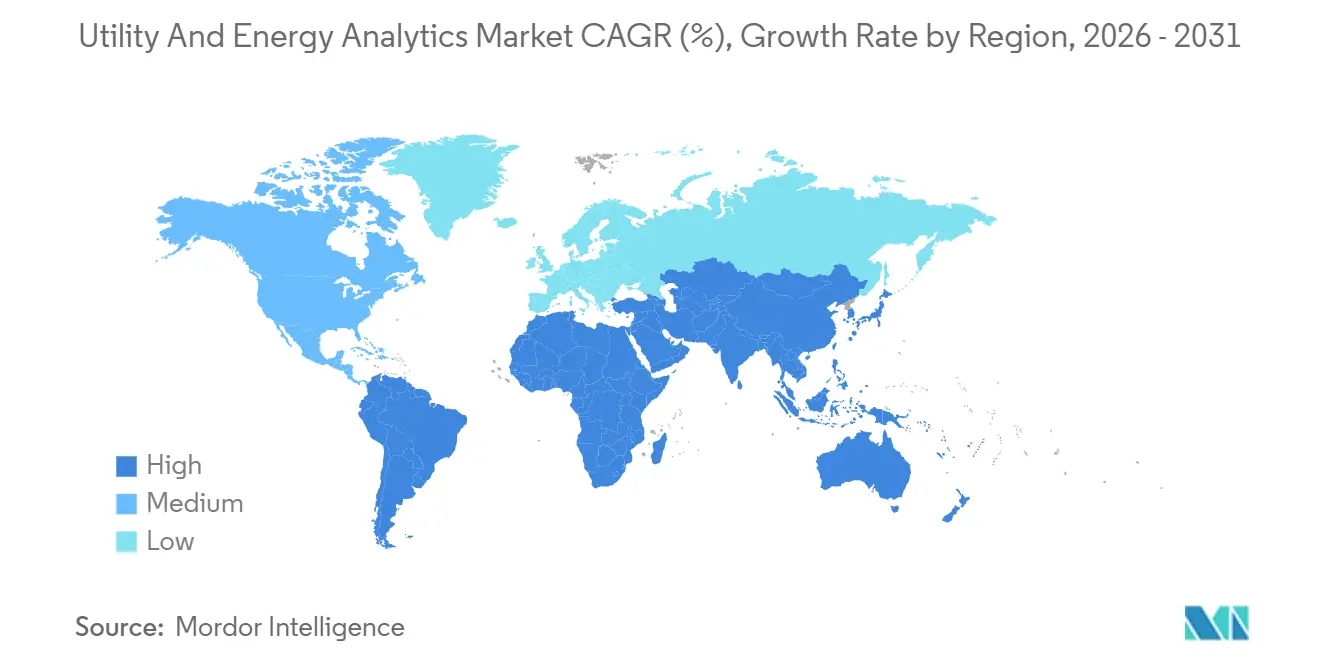
- By geography, North America led with 34.87% revenue share in 2025; Asia-Pacific progressed at a 9.84% CAGR through 2031.
Note: Market size and forecast figures in this report are generated using Mordor Intelligence’s proprietary estimation framework, updated with the latest available data and insights as of January 2026.
Market Trends and Insights
Drivers Impact Analysis of Utility And Energy Analytics Market*
| Driver | (~) % Impact on CAGR Forecast | Geographic Relevance | Impact Timeline |
|---|---|---|---|
| Mandatory Renewable Mandates and Decarbonisation Spend | +2.1% | Global, strongest in EU and California | Medium term (2-4 years) |
| AMI 2.0 Roll-out and Edge Analytics Adoption | +1.8% | North America and Asia-Pacific | Short term (≤2 years) |
| Wholesale-Price Volatility Driving Load-Forecast Accuracy | +1.3% | Europe, Texas, Australia | Short term (≤2 years) |
| Cloud-Native Utility-Analytics Frameworks | +1.2% | Global, rising in Middle East and Africa | Medium term (2-4 years) |
| AI-Driven Planning for Data-Center Electricity Surge | +1.0% | North America, Asia-Pacific | Long term (≥4 years) |
| Digital-Twin Adoption for Transformer Fleet Optimisation | +0.9% | Europe, North America | Long term (≥4 years) |
| Source: Mordor Intelligence | |||
Mandatory Renewable Mandates and Decarbonisation Spend
Clean-energy statutes in the European Union and California force utilities to manage higher renewable penetration with stochastic optimization and granular forecasting.[1] Machine-learning models that merge satellite imagery, numerical weather prediction, and historical generation now cut renewable forecast error below 5% mean absolute percentage error, the threshold for profitable ancillary-services participation. Global renewable capacity additions hit 510 GW in 2023, a 50% rise year-over-year, escalating the need for analytics that harmonize variable generation with inflexible baseload assets. Capital expenditure on decarbonization surpassed USD 1.8 trillion in 2023, and a growing slice flows to software that defers fossil retirements. Disclosure frameworks such as the Task Force on Climate-related Financial Disclosures oblige scenario modeling, embedding analytics into governance and investor relations.[2]
AMI 2.0 Roll-out and Edge Analytics Adoption
Second-generation smart-meter programs generate terabyte-scale daily data, requiring real-time validation, tamper detection, and customer segmentation. India’s 250 million-meter tender and the United States Grid Modernization Initiative are accelerating edge analytics that trim bandwidth costs by 60% and satisfy local data-residency laws. IEEE Standard 2030.5 harmonizes communication protocols, facilitating interoperability between meter vendors and analytics platforms. Utilities leverage granular consumption patterns to curb non-technical losses of 3-5% and to craft targeted efficiency programs that shave peak demand without new infrastructure.
Wholesale-Price Volatility Driving Load-Forecast Accuracy
Extreme price swings, such as European day-ahead rates topping EUR 500 per MWh during 2022 gas shortages, expose utilities to costly forecast errors. ERCOT estimates that every 1% boost in day-ahead accuracy saves USD 5 million in balancing charges. Markets adopting five-minute settlement, notably Australia, penalize deviations more severely, prompting ensemble models that integrate weather, economics, and behavioral signals. Reliability assessments in 2024 show extreme weather inflating load variability by 15%, pushing utilities toward probabilistic forecasting frameworks.
Cloud-Native Utility-Analytics Frameworks
Utilities are shifting to cloud-native stacks to gain elastic compute for annual planning and real-time outage restoration. AWS Clean Rooms for Energy lets multiple parties collaborate on demand forecasts without revealing proprietary data, easing privacy concerns. Microsoft Azure Energy Data Services cuts SCADA integration time from 12 months to 8 weeks. The Cloud Security Alliance’s 2024 framework sets baseline controls compatible with North American Critical Infrastructure Protection standards. Hybrid deployments keep sensitive operations on-premise while offloading compute-intensive models to the cloud, balancing security with scalability.
Restraints Impact Analysis of Utility And Energy Analytics Market*
| Restraint | (~) % Impact on CAGR Forecast | Geographic Relevance | Impact Timeline |
|---|---|---|---|
| Legacy OT-IT Integration Costs and Data Silos | -1.4% | Global, acute in North America and Europe | Short term (≤2 years) |
| Data-Science Talent Shortage in Power Domain | -1.1% | Global, severe in Asia-Pacific and Africa | Medium term (2-4 years) |
| Cyber-Security and Data-Sovereignty Concerns | -0.8% | Europe, China, Middle East | Medium term (2-4 years) |
| Transformer Supply-Chain Bottlenecks Limiting Sensor Retrofits | -0.6% | North America, Europe | Short term (≤2 years) |
| Source: Mordor Intelligence | |||
Legacy OT-IT Integration Costs and Data Silos
Supervisory control and data acquisition systems installed decades ago rely on proprietary protocols that resist modern analytics integration. The United States Government Accountability Office pegs upgrade costs for large investor-owned utilities between USD 40 million and USD 80 million, with timelines stretching up to two years.[3] Siloed datasets across metering, outage, GIS, and billing demand custom extract-transform-load pipelines absorbing 40% of project budgets. Partial adoption of IEC 61850 leaves 60% of North American substations incompatible with real-time analytics. Organizational resistance among operation-technology teams further delays integration, stalling pilots at proof-of-concept stage.
Data-Science Talent Shortage In Power Domain
Hybrid power-system and data-science skills remain scarce. A 2024 IEEE survey found 68% of utility executives citing talent shortages as the main analytics barrier, with senior roles taking nine months to fill. Fewer than 30 university programs offer joint power-AI degrees, limiting the talent pipeline. Emerging-market utilities lose qualified staff to higher-paying technology hubs, forcing costly reliance on consultants who hamper knowledge transfer. Low-code platforms ease entry but trade customization and performance, often proving inadequate for mission-critical dispatch or outage applications.
*Our forecasts treat driver/restraint impacts as directional, not additive. The impact forecasts reflect baseline growth, mix effects, and variable interactions.
Utility And Energy Analytics Market Segment Analysis
By Deployment:
Hybrid Models Bridge Security And ScalabilityOn-premise deployments commanded 53.16% revenue in 2025, underscoring utilities’ preference for direct control over operational data. The utility and energy analytics market size for hybrid architectures is projected to expand at a 13.07% CAGR between 2026 and 2031 as operators move historical analytics and scenario modeling to the cloud while retaining real-time control workloads locally. Municipal utilities pursue cloud-native software-as-a-service to sidestep capital budgets, whereas investor-owned utilities embrace phased migration plans aligned with evolving security frameworks. National Institute of Standards and Technology guidelines have removed regulatory ambiguity, encouraging adoption. Edge deployments at substations shorten fault-detection latency to milliseconds, enabling feeder-level voltage regulation that centralized models cannot achieve. Utilities also leverage edge gateways to satisfy data-sovereignty rules by filtering sensitive telemetry before cloud transfer. As renewable intermittency intensifies, elastic compute capacity for Monte Carlo simulations becomes indispensable, driving continuous hybrid uptake in the utility and energy analytics market.
The shift toward hybrid models also aligns with disaster-recovery objectives, permitting seamless workload failover across regions without duplicating physical infrastructure. Vendors offering unified management across on-premise, cloud, and edge nodes reduce operational complexity and attract utilities seeking single-pane-of-glass oversight. The competitive landscape now includes hyperscalers that certify industry-specific security controls, lowering due-diligence burden. However, utilities must still invest in robust identity-and-access management to prevent lateral movement between information-technology and operation-technology networks. Managed-service contracts bundled with hybrid deployments expedite skill transfer and mitigate talent shortages. Consequently, the utility and energy analytics market will likely witness hybrid overtaking pure on-premise by the end of the forecast period.

By Component:
Services Outpace Software As Complexity EscalatesSoftware platforms delivered 65.72% of component revenue in 2025, reflecting entrenched meter data management and outage suites. Nevertheless, services are growing fastest at 12.21% CAGR because utilities rely on advisory support for integration, model tuning, and change management. Open-source frameworks reduce license fees but demand customization, reinforcing service spend. The utility and energy analytics market size captured by services is expected to widen as subscription pricing compresses upfront software revenue. System integrators bundle multi-year managed services that assume operational risk, aligning vendor incentives with utility outcomes. Hardware revenue remains incremental yet strategic, covering intelligent electronic devices, gateways, and sensors critical for edge analytics.
Ongoing AI model maintenance fuels repeat service engagements. Utilities without in-house data-science teams contract vendors for periodic retraining to account for changing load patterns or equipment aging. Service providers also deliver cybersecurity monitoring, ensuring compliance with evolving standards. As utilities digitize asset management, demand for consulting around business process re-engineering rises. Vendors differentiating through domain expertise and accelerated deployment templates capture premium billable rates. Together, these factors underpin robust growth prospects for services within the utility and energy analytics market.
By Application:
Demand Response Surges As Flexibility Becomes CurrencyMeter operations retained 31.56% application revenue in 2025, anchored by validation, editing, and estimation functions vital to billing accuracy. Yet demand-response and flexibility tools are scaling at a 13.86% CAGR as grid operators monetize load curtailment to avoid costly transmission upgrades. Market reforms such as Federal Energy Regulatory Commission Order 2222 allow aggregated distributed resources to bid into wholesale markets, fostering investment in orchestration analytics. Flexibility software must reconcile disparate asset classes, from residential batteries to commercial HVAC, while honoring customer preferences and contractual obligations. The utility and energy analytics market size for demand-response platforms is therefore set to rise sharply as renewable penetration climbs.
Forecasting and distribution-planning applications also gain traction, simulating electrification scenarios and prioritizing network upgrades. Asset performance management reduces unplanned outages by harnessing transformer vibration and dissolved-gas data to predict failures months ahead. Outage management correlates smart-meter last-gasp signals with network topology, accelerating crew dispatch. As electric-vehicle adoption and electrified heating intensify peak variability, utilities will broaden application portfolios to cover probabilistic planning and real-time restoration.
By Utility Type:
Water Utilities Embrace Electric-Grid PlaybookElectric utilities accounted for 70.12% 2025 revenue, benefitting from mature dispatch and congestion-management use cases. Gas utilities focus on pipeline integrity and leak detection, guided by heightened safety regulations. Water utilities, advancing at a 10.23% CAGR through 2031, replicate electric-grid analytics to address non-revenue water averaging 25% in aging networks. Acoustic sensors and pressure analytics identify leaks before pipe bursts, avoiding costly emergency repairs. As Middle East and Africa operators grapple with water scarcity, desalination and wastewater plants adopt energy-optimization analytics. Integrated dashboards marry water, gas, and electric datasets to exploit cross-domain synergies. Consolidation among multi-utility operators enables scale efficiencies and unified analytics strategy, deepening market penetration among water providers. Consequently, the utility and energy analytics market will see water utilities account for a growing share of incremental revenue.
Heightened climate risk now places water, gas, and electric systems under integrated oversight committees that mandate common key-performance indicators for outage frequency, leak rate, and greenhouse-gas intensity. Because the utility and energy analytics market size for multi-utility operators grows in tandem with service bundling, vendors have started packaging cross-domain data models that flag interdependent vulnerabilities, such as pipeline leaks that threaten adjacent power-cable rights-of-way. In turn, insurance providers are rewarding utilities that deploy predictive analytics with lower premiums, reinforcing a feedback loop that keeps analytics spending on an upward trajectory.
By End-user:
Retail Suppliers Sharpen Hedging As Margins CompressTransmission and distribution operators spent 38.03% of 2025 outlays on analytics that optimize asset utilization and manage interconnection queues. Generation utilities target unit commitment and emission compliance, balancing profitability against carbon pricing. Retail suppliers, however, are expanding at an 11.21% CAGR through 2031 as deregulated markets heighten competition. Accurate load forecasting allows suppliers to hedge positions effectively, protecting thin margins from price volatility. Behavioral analytics predict churn and personalize retention offers, cutting acquisition costs that hover around USD 150 per customer. Virtual power plant aggregators emerge as a distinct end-user class, demanding real-time optimization and settlement capabilities. Growing end-user diversity broadens the utility and energy analytics market, encouraging vendors to tailor modules for each operational context.
Community-choice aggregators and municipal retailers add further momentum by procuring white-label analytics that deliver real-time greenhouse-gas dashboards to environmentally conscious customers. This consumer-facing transparency, coupled with automated contract-recommendation engines, reduces churn by presenting optimized tariffs before a renewal decision is made, thereby protecting the utility and energy analytics market share held by smaller suppliers in highly competitive jurisdictions. As carbon-credit trading integrates with retail billing platforms, end-users increasingly treat emissions reduction as a revenue stream rather than a compliance cost, expanding the data inputs and algorithmic complexity that analytics vendors must support.
Geography Analysis
North America Utility And Energy Analytics Market
North America led the utility and energy analytics market with 34.87% share in 2025, buoyed by Federal Energy Regulatory Commission directives that integrate distributed resources into wholesale markets. United States transmission-upgrade funding of USD 10.5 billion embeds analytics into project selection, while Canada optimizes hydro reservoirs for simultaneous power generation and flood control. Mexico’s regulatory uncertainty tempers adoption but modernization projects continue at private utilities. High renewable penetration in California and Texas necessitates probabilistic forecasting, spurring investment across the continent. Utilities also deploy analytics for wildfire risk mitigation, integrating weather data with vegetation models to prioritize line clearing.
APAC Utility And Energy Analytics Market
Asia-Pacific is advancing at a 9.84% CAGR through 2031. China’s plan to reach 1,200 GW of wind and solar by 2030 demands provincial grid-modernization spending above USD 100 billion. India’s 250 million smart-meter rollout aims to slash aggregate losses above 20% in several states. Japan’s virtual power plant pilots aggregate residential batteries for wholesale participation, while South Korea’s Green New Deal allocates USD 95 billion to renewables and smart grids. Australia’s five-minute settlement and rising rooftop solar penetration heighten the need for sub-hourly analytics. Regional grid code harmonization under the Association of Southeast Asian Nations will unlock cross-border dispatch optimization, expanding the utility and energy analytics market.
EMEA Utility And Energy Analytics Market
Europe’s clean-energy package mandates demand response and storage access to all markets by 2025, catalyzing analytics for distributed flexibility. Germany’s Energiewende surpassed 50% renewable electricity in 2023, forcing transmission operators to manage bidirectional power flows.[4] The United Kingdom’s holistic network design underwrites GBP 58 billion in transmission investments linked to net-zero pathways. In the Middle East, Saudi Arabia commits USD 50 billion to renewables by 2030, and the United Arab Emirates applies artificial intelligence for demand forecasting. Africa’s mini-grid buildout, especially in Nigeria and Kenya, creates greenfield opportunities for edge-native analytics. These developments solidify geographic diversification of the utility and energy analytics market.
Regulatory Landscape
Regulation is increasingly centered on utility data access, cybersecurity baselines, and interoperability, which in turn shapes analytics architectures and vendor requirements. In the United States, the E-Access Act of 2026 (introduced as H.R. 7741 and S. 3926) asks the U.S. Department of Energy and the Federal Energy Regulatory Commission to jointly develop model data sharing standards and policies to improve consumer access to retail electric and natural gas information, reinforcing the need for standardized data models and governed sharing workflows across utility systems.
At the state level, Oregon set a specific data-access timeline by requiring qualified utilities to provide aggregated usage data to qualified recipients within 60 days of request starting January 1, 2026. That requirement increases compliance pressure across meter data management, customer analytics, and data aggregation tooling. In the United Kingdom, the Department for Energy Security and Net Zero published the Energy Digitalisation Framework (with Ofgem positioned for implementation and enforcement), formalizing a coordinated approach to digital energy governance and signaling tighter alignment between market rules, data architecture, and security expectations.
Value Chain Analysis
The value chain begins with data generation and acquisition across operational technology and customer systems, including SCADA, AMI/AMI 2.0, GIS, outage management, and asset-health sensors and gateways that feed high-frequency telemetry. That data then moves through integration, governance, and security layers (connectors, ETL/ELT, identity and access management, and data quality tooling) into analytics platforms where utilities deploy applications such as meter operations, load and generation forecasting, demand response orchestration, and asset performance management. Delivery increasingly blends software subscriptions with professional services, as utilities procure implementation, model tuning, and managed operations to address legacy OT-IT integration complexity and domain talent constraints.
Downstream, system integrators and cloud or platform providers operationalize these solutions into utility workflows, often through hybrid deployments that keep sensitive control workloads on-premise while using cloud compute for simulation, digital twins, and collaboration. Recent ecosystem activity points to the role of edge and digital-twin enablers in pushing real-time visibility: Landis+Gyr signed an agreement with Benton REA to deploy Revelo grid sensors and Gridstream networking for distribution visibility, and Corinex partnered with Plexigrid to market a joint digital-twin solution combining grid visibility with optimization analytics. These moves reinforce a value chain where hardware-adjacent telemetry, interoperable networking, and software analytics are packaged as integrated outcomes rather than stand-alone tools.
Competitive Landscape
The utility and energy analytics market is moderately concentrated. Enterprise-resource-planning incumbents Oracle, SAP, and IBM upsell analytics modules to installed bases, leveraging long-standing relationships. Specialized vendors such as Itron, Landis+Gyr, and AutoGrid dominate metering, demand-response, and distributed-resource management niches. Hyperscalers Amazon Web Services and Microsoft Azure push platform-as-a-service bundles that couple compute infrastructure with pre-built templates, pressuring traditional vendors to modernize offerings.
Strategic moves center on partnerships. Siemens collaborates with C3.ai to inject artificial intelligence into grid-management suites, and Schneider Electric acquired AutoGrid to bolster demand-response capability. Consulting giants Accenture and Capgemini wrap software, integration, and managed analytics into multi-year deals, transferring operational risk and easing talent gaps for utilities. Meanwhile, start-ups like Bidgely use behavioral analytics for personalized efficiency insights, and Smarter Grid Solutions orchestrates grid-edge flexibility. Vendors differentiate through regulatory certifications, low-code tooling, and specialized professional services that shorten time-to-value.
Subscription pricing compresses upfront revenue but extends customer lifetime value, shifting focus to managed services that guarantee outcomes. Utilities increasingly demand interoperability to avoid vendor lock-in, favoring open APIs and adherence to standards such as IEC 61850. Vendors that combine domain expertise with cloud-native architecture and security credentials are best placed to capture incremental utility budgets earmarked for analytics expansion.
Utility And Energy Analytics Industry Leaders
-
Oracle Corporation
-
International Business Machines Corporation
-
Siemens AG
-
Schneider Electric SE
-
SAP SE
- *Disclaimer: Major Players sorted in no particular order
Utility And Energy Analytics Market Companies Covered in this Report
- Oracle Corporation
- IBM Corporation
- Siemens AG
- Schneider Electric SE
- ABB Ltd.
- General Electric Company
- SAS Institute Inc.
- SAP SE
- Capgemini SE
- Teradata Corporation
- Hitachi Energy Ltd.
- Landis+Gyr AG
- Itron Inc.
- AutoGrid Systems Inc.
- Wipro Ltd.
- Accenture plc
- Amazon Web Services Utilities
- Microsoft Azure Energy
- Enel X
- Nexant Inc.
- OSIsoft (AVEVA)
- Uptake Technologies
- Bidgely Inc.
- Smarter Grid Solutions
- Energyworx
- C3.ai Inc.
Market Opportunities and Future Outlook
Utility data-sharing mandates and model-standard initiatives create near-term whitespace around governed data products, consent management, and secure sharing workflows that can be reused across meter operations, retail customer experiences, and third-party program administration. The E-Access Act of 2026 (H.R. 7741/S. 3926) and Oregon's January 1, 2026 requirement for aggregated usage data delivery within 60 days raise the bar for utilities to operationalize curated, auditable datasets and standardized interfaces. This favors platforms that reduce SCADA and AMI integration effort while enforcing policy-driven access controls.
Operational analytics is also a practical monetization path where utilities can translate analytics into measurable reliability and cost outcomes. Con Edison’s deployment of the C3 AI Platform and C3 AI AMI Operations to manage 5.3 million smart meters (reported May 2026) shows demand for AMI-scale anomaly detection and operational workflows tied to customer and system benefits. Sense’s June 2026 pilot activity with Southern Company using Waveform AI on residential smart meters for vegetation-encroachment detection further connects AMI data to outage prevention and field operations. At the platform layer, cloud-native collaboration and privacy-preserving analytics (such as AWS Clean Rooms for Energy) and utility data fabrics support opportunities for multi-party forecasting, DER coordination, and digital-twin programs that depend on interoperable data models and secure cross-organization computation.
Recent Industry Developments in Utility And Energy Analytics Market
- April 2026: Oracle announced new AI capabilities for its Utilities Industry Suite, including enhancements to the Oracle Network Management System aimed at distributed energy resource management and grid resiliency. The update positions Oracle to embed AI outputs directly into network operations workflows and supports hybrid architectures that integrate control-centric applications with analytics. This development strengthens Oracle's stance in utility AI-enabled operations and aligns with ongoing grid modernization efforts.
- June 2025: Oracle released AI-driven anomaly detection and in-memory processing enhancements for the Oracle Utilities Customer Platform, reporting faster meter data processing and fewer high-usage VEE exceptions. These upgrades target AMI-scale data volumes and help utilities operationalize analytics in meter operations, billing accuracy, and exception management. The move also raises performance expectations for competing meter data management and customer analytics stacks.
- September 2024: Oracle introduced Oracle Energy and Water Data Intelligence updates positioned to help utilities unify data and accelerate AI projects across operational and customer domains. The announcement underscores the shift toward unified data foundations that connect SCADA, AMI, GIS, and enterprise datasets for cross-functional analytics. It also aligns with growing demand for governed data layers that can support forecasting, outage workflows, and asset performance management from the same data fabric.
Utility And Energy Analytics Market Report Scope and Research Methodology
Market Definition and Coverage
For this study, the market covers software and related services used by electric, gas, and water utilities to collect, manage, and analyze operational and customer data, so decisions improve across planning, reliability, and customer operations.
Scope exclusions: Hardware such as meters, sensors, communications gear, and generic analytics tools that are not sold for utility or energy-specific use are not counted.
Segments Covered in This Report
- By Deployment
- On-Premise
- Cloud
- Hybrid
- By Component
- Software
- Services
- Hardware / Edge Devices
- By Application
- Meter Operations and Data Management
- Load and Generation Forecasting
- Demand Response and Flexibility
- Distribution Planning and Optimisation
- Asset Performance Management
- Outage Management and Reliability
- By Utility Type
- Electric
- Gas
- Water
- Multi-Utility
- By End-User
- Generation Utilities
- Transmission and Distribution Operators
- Retail Energy Suppliers
- Independent Power Producers
- By Geography
- North America
- United States
- Canada
- Mexico
- South America
- Brazil
- Argentina
- Rest of South America
- Europe
- United Kingdom
- Germany
- France
- Italy
- Spain
- Nordics
- Russia
- Rest of Europe
- Asia-Pacific
- China
- Japan
- India
- South Korea
- Australia and New Zealand
- ASEAN
- Rest of Asia-Pacific
- Middle East
- Saudi Arabia
- United Arab Emirates
- Israel
- Turkey
- Rest of Middle East
- Africa
- South Africa
- Egypt
- Nigeria
- Rest of Africa
- North America
Data Sources, Market Sizing, and Validation
Desk Research
Desk research helped us set the boundaries and create a realistic demand pool before any math was done. We used public sources such as the US Energy Information Administration, International Energy Agency, World Bank, Eurostat, and regulator or grid-operator publications that show electricity demand, generation mix changes, outage and reliability indicators, and smart metering direction.
We also reviewed company annual reports, earnings call notes, investor presentations, utility procurement announcements, and credible press to understand how analytics programs are funded and rolled out. Where it added value, paid subscriptions for company financials and intelligence, news and financials, patent databases, and global contracts and tenders were referenced to confirm activity signals without relying on a single dataset. The examples above are not exhaustive, and many other sources were used to collect data, validate assumptions, and clarify open points.
Primary Interviews and Surveys
Primary work was used to pressure-test the model assumptions that desk sources do not show clearly, especially what gets budgeted as analytics versus adjacent IT spend. We spoke with utility-side digital, operations, and data leaders, along with system integrators and solution specialists, across APAC, EMEA, and the Americas so regional adoption patterns and pricing logic could be confirmed before final sign-off.
Distribution of primary research fieldwork respondents
| Company type | Respondent position | Region |
|---|---|---|
| Top tier: 32% | CXOs: 14% | APAC: 48% |
| Mid tier: 52% | Functional/Unit leaders: 37% | EMEA: 29% |
| Smaller Players: 16% | Managers: 49% | Americas: 23% |
Market-Sizing & Forecasting
Sizing started with a top-down build that reconstructs the spend pool from utility digital and operational analytics budgets, and then assigns shares to analytics functions that are utility-specific. To keep this practical, the totals were then corroborated using selective bottom-up checks, such as sampled license and services pricing times likely user counts, plus channel feedback on typical deal sizes.
Key inputs used in the model included smart meter and grid-modernization rollout direction, outage and reliability improvement programs, cloud migration pace in utility IT, distributed energy resource integration needs, and workforce productivity targets tied to field operations. Where primary feedback showed gaps in publicly visible spending, the model used conservative proxy ratios that can be rechecked each year.
For forecasting, we used scenario analysis supported by simple trend smoothing on the core spend drivers, and then adjusted the trajectory based on expert views on regulatory timelines and utility capex to opex shifts. The output stays traceable because each driver has a clear link to utility operating priorities, and each assumption can be revised when the next cycle of public data and interviews comes in.
Data Validation & Update Cycle
Outputs were checked against independent signals like utility digitization milestones, major program announcements, and observable shifts toward cloud-based operations tools. When a region or application line showed a jump that did not match these signals, it was reviewed again and, when needed, discussed with additional respondents to confirm whether it was timing, currency, or scope.
A multi-step internal review is followed so the assumptions, math, and narrative stay aligned. Reports are refreshed annually, with interim updates when material events change budgets or adoption, and a final pre-delivery pass is done so clients receive the latest updated view.
Mordor Intelligence's Utility and Energy Analytics Market Size Measured Against Other Published Estimates
Published market sizes for utility and energy analytics can look far apart because the scope line is drawn differently, and because pricing and adoption assumptions are refreshed at different times. We try to keep the model explainable, so a buyer can see what is included, what is not, and which real-world signals were used to validate the totals.
Utility digitization program signals, tender activity, and deal-size checks are used to keep Mordor Intelligence's estimate aligned to software and related services sold into electric, gas, and water utilities, instead of expanding into hardware-heavy edge stacks. Differences also show up when some estimates count oil and gas analytics under the same umbrella, or apply aggressive cloud penetration and faster price increases without re-checking what utilities are actually contracting for in the current year.
Benchmark comparison
| Source | Market Size | Gaps in Research Methodology |
|---|---|---|
| Mordor Intelligence | USD 5.87 B (2026) | |
| Industry Publisher A | USD 3.85 B (2024) | Uses an earlier base year and a broader energy framing, with segmentation that can mix upstream and downstream energy analytics with utility analytics, which shifts the counted spend pool. |
| Industry Publisher B | USD 6.36 B (2024) | Includes hardware or edge devices inside the component scope and applies a faster growth path, which can raise the starting value when combined with optimistic adoption and pricing assumptions. |
The spread mainly comes from year selection and what is counted as part of analytics spend, especially the treatment of hardware and non-utility energy use cases. By keeping inputs tied to utility budget signals and contract-led validation, the final number stays easier to reproduce and update as new programs and deployments show up in the market.
Key Questions Answered in the Report
What is the current value of the utility and energy analytics market?
The market stands at USD 5.87 billion in 2026 and is projected to reach USD 9.05 billion by 2031.
Which segment is growing fastest in utility and energy analytics?
Demand-response and flexibility applications are advancing at a 13.86% CAGR, outperforming other use cases.
Why are hybrid deployments gaining traction among utilities?
Hybrid architectures allow operators to keep real-time control data on-premise for security while leveraging cloud scalability for historical analytics and heavy computing tasks.
How do renewable mandates influence analytics adoption?
Statutory targets for clean energy require granular forecasting and stochastic optimization, driving investment in analytics that manage wind and solar intermittency.
Which region is expected to contribute most to future market growth?
Asia-Pacific, led by China and India, is forecast to register a 9.84% CAGR through 2031 due to large-scale grid modernization and smart-meter rollouts.
What are the main barriers to analytics deployment in utilities?
High legacy OT-IT integration costs and a shortage of domain-specific data-science talent are the most significant constraints.