
User Activity Monitoring Market Size and Share
Market Overview
| Study Period | 2020 - 2031 |
|---|---|
| Market Size (2026) | USD 3.61 Billion |
| Market Size (2031) | USD 7.65 Billion |
| Growth Rate (2026 - 2031) | 16.23 % |
| Fastest Growing Market | Asia Pacific |
| Largest Market | North America |
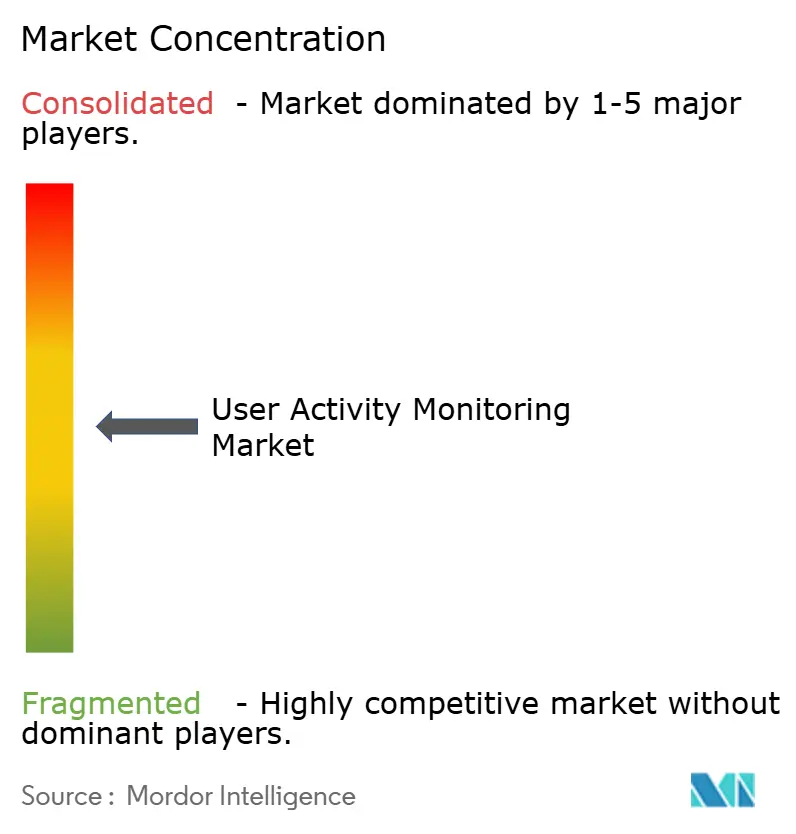
| Market Concentration | Medium |
Major Players *Disclaimer: Major Players sorted in no particular order Image © Mordor Intelligence. Reuse requires attribution under CC BY 4.0. | |
User Activity Monitoring Market Analysis by Mordor Intelligence
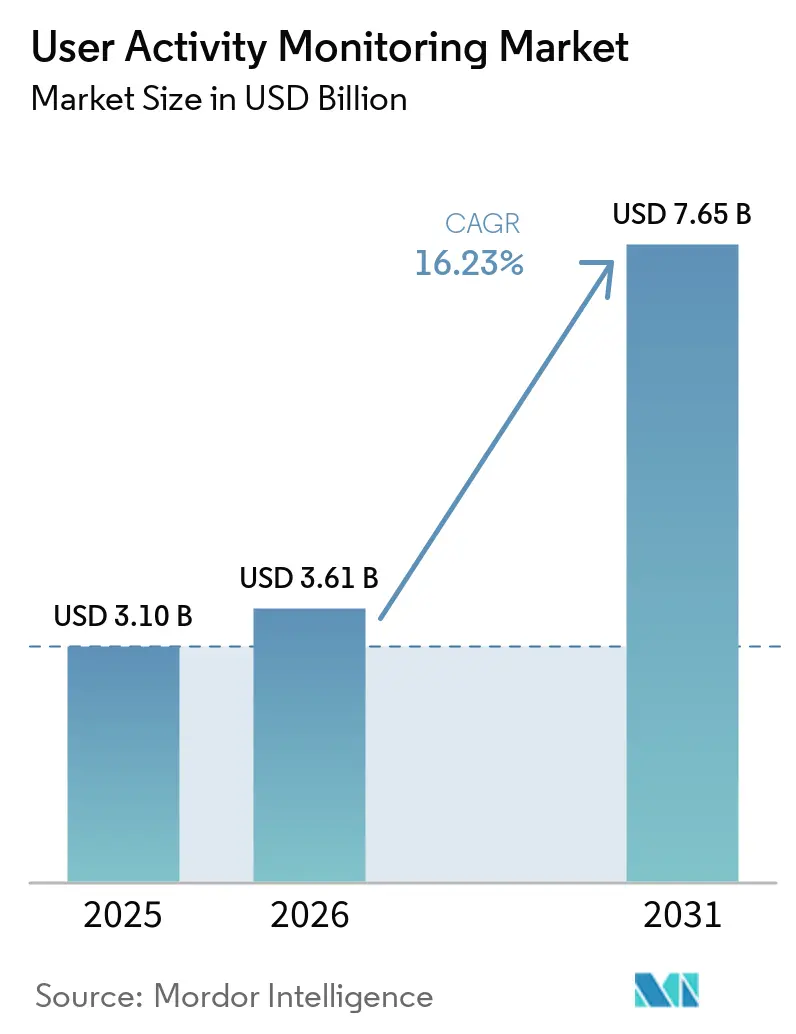
User activity monitoring market size in 2026 is estimated at USD 3.61 billion, growing from 2025 value of USD 3.1 billion with 2031 projections showing USD 7.65 billion, growing at 16.23% CAGR over 2026-2031. The growth path signals a clear pivot from perimeter-centric protections toward continuous verification, as zero-trust programs encourage real-time inspection of every privileged action across hybrid environments. Rapid cloud migration, rising cyber-insurance prerequisites, and the convergence of operational technology with traditional IT networks combine to expand addressable demand for the user activity monitoring market, particularly among sectors facing tight audit deadlines. Meanwhile, vendors differentiate through integrated analytics, regulatory-specific reporting, and open APIs that let enterprises embed monitoring feeds into broader observability pipelines. This shift favors solutions that scale elastically, enrich alert context automatically, and respect regional privacy constraints without sacrificing detection depth.
Key Report Takeaways
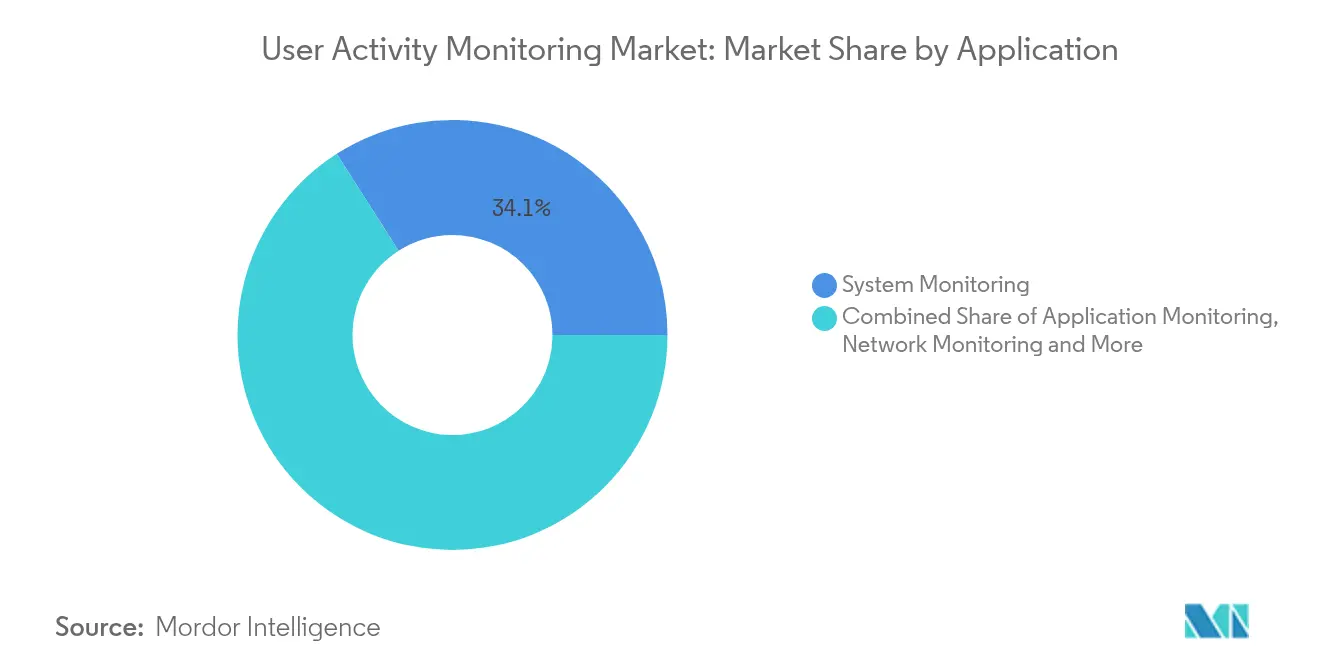
- By application, system monitoring led with 34.05% of the user activity monitoring market share in 2025, while database monitoring is on track to grow at 18.05% CAGR through 2031.
- By deployment model, on-premise retained 50.75% share of the user activity monitoring market size in 2025, yet cloud deployment is projected to expand at 23.18% CAGR to 2031.
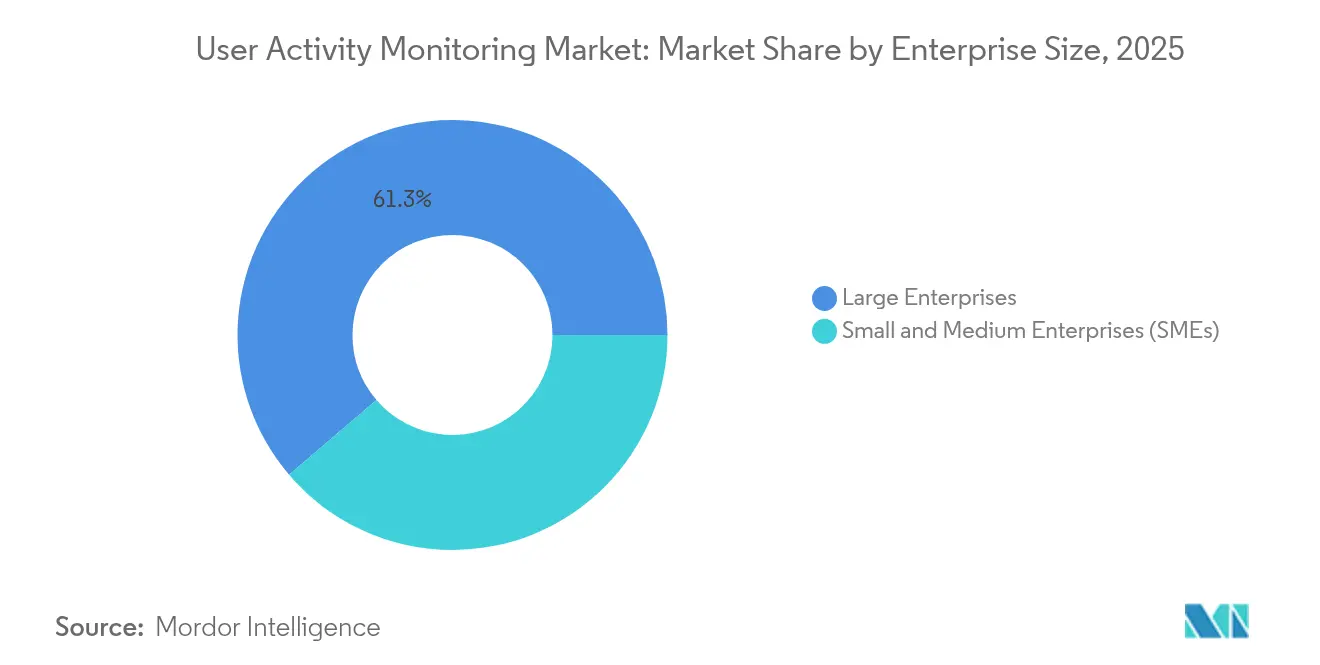
- By enterprise size, large enterprises accounted for 61.25% of the user activity monitoring market share in 2025; small and medium enterprises are advancing at 19.65% CAGR through 2031.
- By end-user industry, the BFSI segment held 29.15% of the user activity monitoring market size in 2025, whereas healthcare is forecast to grow at 19.12% CAGR through 2031.
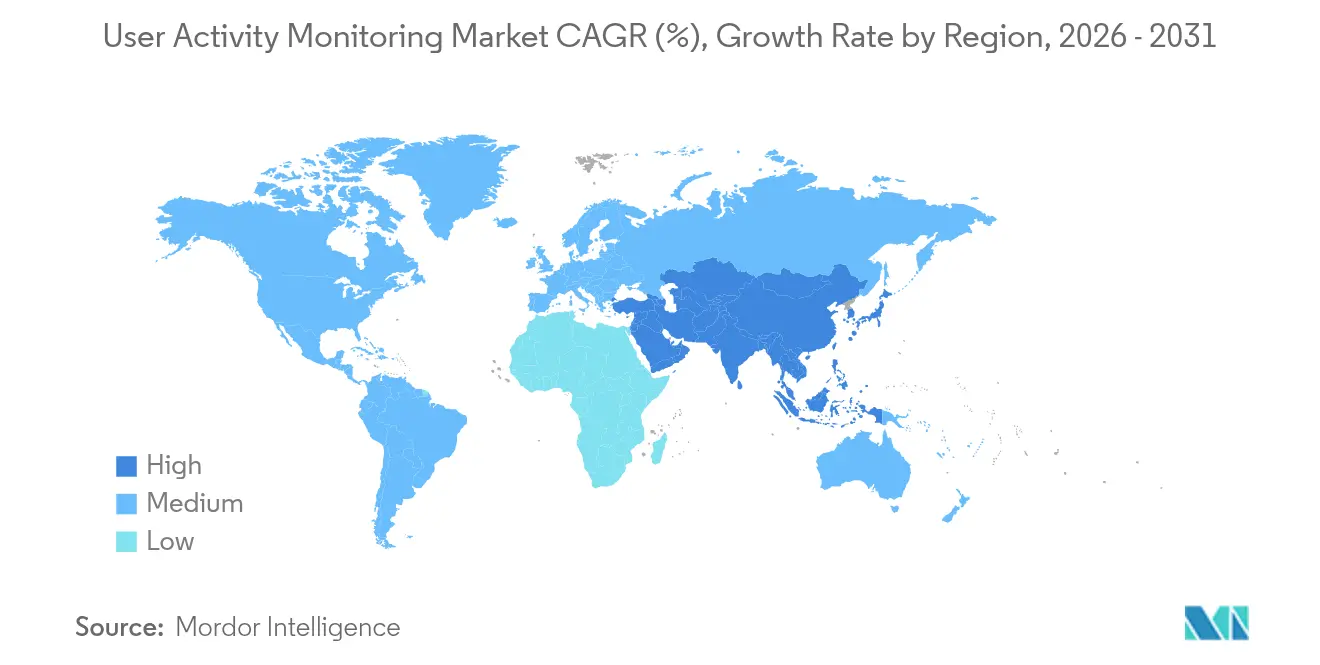
- By geography, North America commanded 44.15% revenue share in 2025, while the Asia-Pacific region is expected to post 17.74% CAGR over the forecast period.
Note: Market size and forecast figures in this report are generated using Mordor Intelligence’s proprietary estimation framework, updated with the latest available data and insights as of 2026.
Market Trends and Insights
Drivers Impact Analysis of User Activity Monitoring Market*
| Driver | (~) % Impact on CAGR Forecast | Geographic Relevance | Impact Timeline |
|---|---|---|---|
| Remote & hybrid-workforce expansion | +3.2% | Global; strongest in North America and Europe | Medium term (2-4 years) |
| Rising insider-threat & compliance mandates | +4.1% | Global; BFSI and healthcare sectors lead | Short term (≤ 2 years) |
| Shift to zero-trust security architectures | +3.8% | North America and EU lead; APAC follows | Medium term (2-4 years) |
| Need for unified observability stacks | +2.9% | Enterprise deployments worldwide | Long term (≥ 4 years) |
| Cyber-insurance driven real-time risk scoring | +2.1% | Primarily North America and Europe | Short term (≤ 2 years) |
| AI-native productivity analytics monetization | +1.4% | Technology sector globally | Long term (≥ 4 years) |
| Source: Mordor Intelligence | |||
Remote & Hybrid-Workforce Expansion
Government and private employers now support permanent distributed staffing models, prompting visibility gaps that traditional perimeter tools cannot fill. The United States Department of Defense allocated USD 469.8 million in FY 2025 to Continuous Diagnostics and Mitigation programs that watch activity across home offices and classified facilities alike. Similar patterns in banking force institutions to adopt cloud-native user activity monitoring platforms able to baseline behavior regardless of location. Vendors respond with lightweight agents that adjust thresholds dynamically as employees transition between networks, coworking spaces, and unmanaged devices. The associated productivity gains create board-level support for investments that separate legitimate remote work from credential misuse in real time.
Rising Insider-Threat & Compliance Mandates
Financial regulators, including SIFMA, revised best-practice guides in 2024 to require granular tracking of privileged user behavior for audit defense. Banking loss analyses attribute significant portions of fraud to insiders, accelerating interest in AI-driven anomaly detection that highlights subtle deviations such as off-hour data pulls. Manufacturing sees similar urgency as 52% of malware incidents feature ransomware that often begins with compromised internal accounts. Compliance teams therefore demand detailed audit trails able to reconstruct every keystroke during investigations, pushing organizations to treat user activity monitoring as an operating cost akin to firewalls rather than a discretionary tool.
Shift to Zero-Trust Security Architectures
Executive Order 14028 obliges United States federal agencies to implement zero-trust by 2027, embedding user behavior analytics into real-time policy decisions. Benchmarks show combined single sign-on and zero-trust designs authenticate in 30.03 milliseconds while flagging double-digit anomalies within hours, demonstrating that effective controls need seamless analytics rather than scheduled audits. Japanese enterprises echo this direction as 77.7% adopt cloud services yet struggle to watch automated service identities, elevating demand for platforms that link identity management with continuous context evaluation. Vendors that ship open API hooks for identity platforms and endpoint telemetry gain advantage because they let security teams orchestrate deny-or-step-up actions instantly.
Need for Unified Observability Stacks
Splunk’s FY 2024 Cloud ARR rose 23% to USD 2.186 billion as customers sought a single console for performance and security analytics. Operators want direct correlation between a failed database write, a spike in CPU, and the user who triggered both within milliseconds, rather than toggling among siloed dashboards. Cisco’s USD 28 billion offer for Splunk illustrates demand for convergence of SIEM, application performance management, and user activity monitoring market capabilities. This alignment aids compliance as auditors increasingly request proof that companies supervise the full stack, not isolated layers.
Restraints Impact Analysis of User Activity Monitoring Market*
| Restraint | (~) % Impact on CAGR Forecast | Geographic Relevance | Impact Timeline |
|---|---|---|---|
| Employee privacy & works-council pushback | -2.8% | Europe, with spillover across multinationals | Short term (≤ 2 years) |
| High TCO for multi-modal data capture | -1.9% | Worldwide; SME budgets most affected | Medium term (2-4 years) |
| Source: Mordor Intelligence | |||
Employee Privacy & Works-Council Pushback
The EU AI Act categorizes many monitoring solutions as high-risk, obliging firms to conduct impact assessments, preserve human oversight, and pay fines up to EUR 35 million for violations.[1] Works councils commonly challenge deployments that log granular keystrokes without worker consultation, forcing enterprises to deploy privacy-by-design models that anonymize data until investigation triggers occur. Multinationals then standardize on the strictest jurisdiction to avoid policy fragmentation, occasionally reducing analytic depth in regions that actually permit deeper inspection. Vendors invest in differential privacy, local-storage architectures, and role-based masking to maintain European viability while keeping detection true-positive rates acceptable elsewhere.
High TCO for Multi-Modal Data Capture
Comprehensive visibility calls for endpoint, network, file, and database telemetry streamed in real time, driving compute, storage, and license costs that can deter smaller organizations.[2] Semiconductor supply chain strain may escalate hardware expenses as global wafer fabrication outlays reach USD 2.3 trillion between 2024 and 2032. Although cloud models shift investment from capital to operating budgets, data-sovereignty rules can mandate local retention, pushing enterprises toward hybrid builds that replicate ingestion pipelines both on-premise and in the public cloud. SMEs therefore prioritize modular packages that let them begin with high-value assets such as databases, expanding toward full stack coverage when budgets permit.
*Our forecasts treat driver/restraint impacts as directional, not additive. The impact forecasts reflect baseline growth, mix effects, and variable interactions.
User Activity Monitoring Market Segment Analysis
By Application:
Database Monitoring Drives InnovationDatabase monitoring holds the fastest 18.05% CAGR through 2031 even as system monitoring commanded 34.05% of the user activity monitoring market share in 2025. The user activity monitoring market size attached to database oversight is forecast to expand rapidly because structured records hold regulated customer and financial data that present high breach penalties. Vendors embed query profiling and privilege escalation alerts to meet auditors’ expectations for precise chain-of-custody evidence. Complementary modalities-file, network, and application monitoring-continue to mature, but buyers increasingly insist on a unified console capable of tracing a transaction from initial request to final write.
Organizations therefore adopt platforms that stitch user identities, process IDs, and SQL statements into a single timeline, reducing meantime-to-incident-resolution and improving report generation for standards such as PCI DSS and Basel III. System monitoring maintains relevance by covering every endpoint, including unmanaged personal devices now admitted under bring-your-own-device policies. Application monitoring gains traction within DevSecOps pipelines, enabling development teams to shift left by detecting risky behavior during staging rather than after production release.

By Deployment Mode:
Cloud Acceleration Reshapes ArchitectureCloud delivery exhibits a 23.18% CAGR as enterprises move telemetry workloads off-premise in tandem with broader software modernization. On-premise still accounted for 50.75% of the user activity monitoring market size in 2025 because legacy industries and governments often retain sensitive workloads behind strict firewalls. Adoption rates accelerate in Europe, where 45.2% of businesses purchased cloud services in 2023. Hybrid models emerge as the default: sensitive log data is written locally to comply with sovereignty rules, while lower-risk streams enter regional cloud zones for elastic processing.
This split architecture urges vendors to design agent-based collection that forwards data selectively based on tagging rules. Innovations such as edge-native preprocessing compress payloads before they reach collectors, lowering egress fees and latency. As network bandwidth costs decline and hyperscalers introduce privacy vaults, more customers migrate cold storage to object repositories while keeping hot analytic clusters close to real-time data sources.
By Enterprise Size:
SME Adoption AcceleratesLarge enterprises held 61.25% revenue in 2025, yet SMEs are growing at 19.65% CAGR, shifting the buyer demographic of the user activity monitoring market. Affordability improved through subscription models that start below three-digit USD monthly tiers, removing upfront license fees that once barred smaller firms. Cyber-insurance carriers now expect log retention and privileged access monitoring as minimum requirements for coverage, compelling even micro businesses to adopt baseline telemetry.
Enterprise buyers continue to spend most in absolute terms, demanding native integration with security orchestration platforms, asset management databases, and data lakes. Advanced features such as container-aware tracing and remote session video recording remain optional for SMEs but default for multinational corporations that manage thousands of privileged contractors. Observed convergence between compliance and operations suggests future packages will bundle governance dashboards accessible to finance and legal teams without separate tooling.
By End-User Industry:
Healthcare Leads GrowthBFSI remained the largest vertical at 29.15% revenue in 2025, supported by extensive regulatory frameworks like the New York DFS Part 500 rule set. Healthcare, however, is forecast to post 19.12% CAGR after proposed HIPAA Security Rule updates in January 2025 require multi-factor authentication and expanded audit controls. Providers adopt agentless discovery that captures ePHI access across electronic medical record systems, medical IoT devices, and third-party billing portals.
Manufacturing faces a distinct threat profile dominated by ransomware groups targeting operational technology. Energy utilities invest heavily in grid modernization security programs, integrating user activity telemetry from SCADA consoles and field laptops to satisfy Department of Energy implementation plans. Government agencies comply with 10 USC 2224 mandates for automated insider detection across cleared networks, further evidencing that sector-specific rules remain chief budget drivers.
Geography Analysis
North America User Activity Monitoring Market
North America generated 44.15% of 2025 revenue, benefiting from early zero-trust mandates, strong cyber-insurance penetration, and prolific state-level legislation that now requires continuous monitoring within public sector contracts. Federal departments align to Executive Order 14144, and the Energy Modernization Cybersecurity Implementation Plan outlines 32 initiatives that fund telemetry sensors across substations and cloud edge nodes. Vendor ecosystems cluster around Washington, D.C., and Silicon Valley, fostering rapid feature iteration and robust customer success communities that shorten deployment timelines.
APAC User Activity Monitoring Market
Asia-Pacific is the fastest-growing region at 17.74% CAGR through 2031. China’s Network Data Security Management Regulations, effective January 2025, compel nearly every large enterprise to implement risk assessment and user activity logs, while India’s Digital Personal Data Protection Act tightens breach-reporting windows and mandates consent tracking. Japan’s Cloud Security Alliance surveys find 46% of firms struggle to monitor non-human identities, driving interest in identity-centric solutions integrated into public-cloud ecosystems. Start-ups from Singapore and South Korea focus on multilingual natural-language search interfaces that suit heterogeneous IT deployments across the region.
EMEA and LATAM User Activity Monitoring Market
Europe sustains measured adoption amid privacy complexities. The user activity monitoring market size in Germany, France, and the Nordics expands as companies negotiate works-council approvals by adopting privacy-preserving analytics. With the EU AI Act coming into force in August 2026, vendors invest early in algorithmic explainability and human-in-the-loop controls to retain access to continental buyers. Emerging economies in Latin America, the Middle East, and Africa increasingly embed monitoring clauses in data-protection directives, although budget constraints redirect preference toward SaaS platforms hosted in regional data centers.
Regulatory Landscape
User activity monitoring (UAM) deployments sit at the intersection of cybersecurity control catalogs and worker privacy rules. In the United States, NIST SP 800-53 Rev. 5 includes controls that require monitoring for atypical account usage and reporting suspicious activity, supporting audit-ready UAM in government-aligned environments. In the European Union, the EU AI Act (Regulation 2024/1689) places many AI-enabled workplace monitoring use cases in the high-risk category. Its obligations, including human oversight, transparency, and record-keeping, become operative from August 2, 2026, shaping how vendors package analytics and how buyers document governance.
Privacy and employment-law constraints also influence feature design and rollout playbooks. GDPR-based requirements steer organizations toward a lawful basis for processing, employee-facing transparency, and Data Protection Impact Assessments for systematic monitoring. That, in turn, increases demand for privacy-by-design controls such as role-based masking and minimized capture. Sector rules add further specificity, including healthcare-driven audit expansions tied to proposed HIPAA Security Rule updates (January 2025), alongside operational resilience and financial privacy regimes that raise expectations for evidentiary logs and retention discipline. This reinforces UAM as a compliance control rather than an optional tool.
Competitive Landscape
The user activity monitoring market remains moderately fragmented, with household names—Microsoft, IBM, Cisco, Splunk, and Broadcom—competing against specialists like CyberArk, Forcepoint, and ObserveIT. Cisco’s planned integration of Splunk indicates a strategic bet that security buyers prefer end-to-end observability over point solutions. Established vendors expand machine-learning capabilities, adding context from identity providers and configuration management databases to reduce alert fatigue.
Specialists differentiate through depth rather than breadth. CyberArk emphasizes privileged session recording and just-in-time credential issuance, securing contracts in defense and energy verticals that demand National Institute of Standards and Technology compliance. Insider-risk newcomers leverage local differential-privacy algorithms so personal identifiers stay encrypted until an alert threshold is crossed, satisfying European works councils while preserving forensics integrity.
Open-source projects, including Wazuh and Elastic Security, penetrate cost-sensitive segments, especially SMEs requiring basic file-integrity monitoring. Partnerships matter: cloud providers bundle baseline log retention within broader workload protection platforms, creating challenges for independent vendors that must justify additional spend. Overall, winning strategies hinge on interoperability with security information and event management systems, low-latency processing, and transparent pricing that scales predictably with data volume rather than static seat counts.
User Activity Monitoring Industry Leaders
-
Micro Focus International PLC
-
Splunk Inc.
-
Imperva Inc.
-
CyberArk Software Ltd.
-
Centrify Corporation
- *Disclaimer: Major Players sorted in no particular order
User Activity Monitoring Market Companies Covered in this Report
- Micro Focus International PLC
- Splunk Inc.
- Forcepoint LLC
- Imperva Inc.
- CyberArk Software Ltd.
- Delinea (Centrify)
- Securonix Inc.
- Netwrix Corporation
- LogRhythm Inc.
- Teramind Inc.
- SolarWinds Corp.
- Rapid7 Inc.
- Proofpoint Inc.
- ObserveIT
- ManageEngine (Zoho)
- ActivTrak Inc.
- Ekran System Inc.
- Veriato Inc.
- IBM Corporation
- Microsoft Corporation
Market Opportunities and Future Outlook
A key whitespace is privacy-preserving monitoring that still supports defensible forensics across hybrid endpoints, SaaS, and cloud workloads. The EU AI Act compliance burden, including high-risk governance from August 2026 for many employment-related AI systems, and GDPR DPIA-driven scrutiny are pushing buyers toward approaches that reduce capture of raw personal content while preserving behavioral signals. This creates room for vendors that can deliver configurable data minimization, explainability, and region-aware retention defaults without breaking incident reconstruction workflows.
Another opportunity is deeper convergence of UAM telemetry with broader observability and automated operations. Cisco's move to integrate Splunk reflects ongoing buyer preference for consolidated analytics where user actions, application behavior, and infrastructure signals correlate within one workflow. This favors UAM products with open APIs and native connectors into SIEM and observability stacks. On the detection side, session-level behavioral telemetry is extending beyond employee and privileged-access contexts into web and application interactions. Cloudflare's July 2026 launch of Precursor, built around full-session behavioral validation using real-time browser telemetry, points to enterprise appetite for continuous behavior-based detection that can operate without collecting keystroke content, a pattern UAM vendors can translate into broader session monitoring and anomaly detection use cases.
Recent Industry Developments in User Activity Monitoring Market
- July 2026: Splunk announced general availability of Splunk Agent Launchpad, a no-code capability for building AI agents inside the Splunk environment. This expands automation pathways for security and IT workflows by turning machine data, including activity and event telemetry, into actions through configurable agents rather than manual playbooks.
- April 2026: Thales introduced Imperva for Google Cloud, bringing Imperva application security capabilities directly into Google Cloud using cloud-native traffic integration. The move aligns UAM-adjacent monitoring and protection with where workloads run, reducing friction for cloud-first buyers that want integrated visibility and enforcement without separate routing architectures.
- January 2025: HHS proposed updates to the HIPAA Security Rule that strengthen requirements around multi-factor authentication and audit controls for ePHI systems. Healthcare providers and their vendors face a clearer mandate to expand audit trails and access oversight across clinical applications and connected environments, elevating demand for monitoring that supports compliance reporting and investigations.
User Activity Monitoring Market Report Scope and Research Methodology
Market Definition and Coverage
This market covers software and related services that record and analyze user actions on endpoints and business systems to support security monitoring, compliance evidence, and insider risk investigations across organizations.
Scope exclusions: We exclude basic time tracking and attendance tools that do not provide security-grade event logging, alerting, or investigation support.
Segments Covered in This Report
- By Application
- System Monitoring
- Application Monitoring
- File Monitoring
- Network Monitoring
- Database Monitoring
- Others
- By Deployment Mode
- On-premise
- Cloud
- Hybrid
- By Enterprise Size
- Small and Medium Enterprises (SMEs)
- Large Enterprises
- By End-user Industry
- BFSI
- Retail and E-commerce
- IT and Telecom
- Healthcare and Life Sciences
- Manufacturing
- Government and Defense
- Energy and Utilities
- Others
- By Geography
- North America
- United States
- Canada
- Mexico
- South America
- Brazil
- Argentina
- Rest of South America
- Europe
- United Kingdom
- Germany
- France
- Italy
- Spain
- Rest of Europe
- Asia-Pacific
- China
- India
- Japan
- South Korea
- Australia
- Rest of Asia-Pacific
- Middle East
- Saudi Arabia
- United Arab Emirates
- Turkey
- Rest of Middle East
- Africa
- South Africa
- Egypt
- Nigeria
- Rest of Africa
- North America
Data Sources, Market Sizing, and Validation
Desk Research
Desk work starts with public signals that show how demand for user visibility and audit trails is changing across regions and industries. We review materials such as NIST guidance, CISA advisories, SEC cybersecurity disclosure requirements, and privacy and workplace monitoring expectations reflected in FTC and EEOC resources, which help frame what buyers consider necessary controls.
To ground adoption and budgeting context, we also reference public breach reporting and incident learnings, including government and public safety bulletins, plus labor and privacy statutes and peer-reviewed security and digital forensics research where available. Company filings, investor presentations, product documentation, and reputable press coverage are used to understand packaging changes and deployment patterns. We then do selective checks using paid subscriptions for company financials and intelligence, patent databases, and a global contracts and tenders dataset. The sources listed here are illustrative only, and many other public references were used to collect data, cross-check assumptions, and clarify gaps.
Primary Interviews and Surveys
Primary work is used to pressure-test what we see in public sources, especially where pricing, deployment mix, and buying triggers are not directly visible. We speak with a mix of solution providers, channel partners, and enterprise buyers, including security leaders, IT operations, and compliance owners, across the Americas, EMEA, and APAC. This helps ensure regional adoption patterns and budget timing show up in the final model.
Distribution of primary research fieldwork respondents
| Company type | Respondent position | Region |
|---|---|---|
| Top tier: 26% | CXOs: 13% | APAC: 43% |
| Mid tier: 60% | Functional/Unit leaders: 34% | EMEA: 34% |
| Smaller Players: 14% | Managers: 53% | Americas: 23% |
Market-Sizing & Forecasting
Sizing begins with a top-down build where enterprise security and compliance software spend is filtered into the portion that is realistically addressable by user activity monitoring. The split is shaped using indicators such as remote and hybrid workforce intensity, the share of regulated industries in IT spending, endpoint and identity footprint growth, and the maturity of insider risk and audit programs.
Those totals are then corroborated with selective bottom-up checks. We sample typical pricing per user or endpoint, expected license counts by organization size, and channel feedback on renewal and expansion cycles. We also adjust where public revenue lines bundle adjacent security products. For forecasting, scenario analysis is used, with assumptions shaped by expert feedback on policy-driven demand, cloud migration timing, and how quickly buyers shift from basic logging to higher value analytics and alerting. The model is refreshed when clear signals move, including regulatory deadlines, rapid changes in workplace monitoring rules, or a step change in average contract size.
Data Validation & Update Cycle
Outputs are checked against independent signals, such as security software budget trends, published breach and insider incident patterns, and adoption cues from job postings and procurement language. When a figure looks out of line across regions or year-over-year growth, we re-check inputs, confirm currency timing, and revisit the assumptions that drive adoption and pricing.
Before sign-off, the model goes through a multi-step internal review where calculations, source notes, and logic are re-read by another analyst and then reconciled back to the market definition. Reports are refreshed annually, and interim updates are made when material events occur. After those updates, respondents may be re-contacted to confirm whether the change is temporary or structural. Right before delivery, we run a final pass so the latest public updates are reflected in the numbers.
Mordor Intelligence's User Activity Monitoring Market Size Versus Other Published Estimates
Published market values for user activity monitoring can vary widely because each publisher draws the line differently on what counts as monitoring versus broader insider risk, analytics, or even HR tracking. Differences also show up when one estimate uses vendor-reported category revenue, while another leans more on buyer spending intent or a single region and then scales it up.
Key gap drivers are usually scope and pricing logic, such as whether session recording and forensic logging are required, how cloud subscriptions are annualized, and how services are treated versus software-only totals. Some estimates also move faster or slower on refresh cadence, which matters when contract sizes and deployment mix shift quickly after policy updates, and this is why the table below shows a spread.
Benchmark comparison
| Source | Market Size | Gaps in Research Methodology |
|---|---|---|
| Mordor Intelligence | USD 3.61 B (2026) | |
| Global Consultancy A | USD 4.78 B (2025) | Uses a broader definition that can fold adjacent insider risk and behavior analytics capabilities into the total, and year alignment differs, which can lift the point-in-time value versus a tighter UAM-only tally. |
| Industry Publisher B | USD 4.74 B (2025) | Leans on a faster adoption case and a wider cloud software interpretation, and it is less clear how bundled security suites and services are separated, which changes the implied average price and total spend. |
The spread is mainly explained by whether basic time-tracking tools are counted alongside security-grade monitoring and how subscription pricing is normalized to a single year. This check keeps the scope consistent for Mordor Intelligence.
Key Questions Answered in the Report
What is the current value of the user activity monitoring market?
The user activity monitoring market stands at USD 3.61 billion in 2026 and is set to reach USD 7.65 billion by 2031.
Which application segment is growing fastest?
Database monitoring is projected to expand at 18.05% CAGR through 2031 as enterprises focus on protecting structured data repositories.
Why are small and medium enterprises now adopting user activity monitoring?
SMEs face rising cyber-insurance requirements and can leverage affordable cloud-native platforms that remove upfront hardware costs, supporting a 19.65% CAGR in this buyer group.
How do privacy regulations in Europe affect deployment?
The EU AI Act designates many monitoring tools as high-risk, requiring strict governance, impact assessments, and privacy-preserving analytics before rollout.
What role does zero-trust architecture play in future demand?
Zero-trust programs embed behavioral analytics into access decisions, making real-time user activity monitoring a foundational layer for every privileged operation across hybrid environments.