
Used Construction Equipment Market Size and Share
Market Overview
| Study Period | 2020 - 2031 |
|---|---|
| Market Size (2026) | USD 132.67 Billion |
| Market Size (2031) | USD 174.28 Billion |
| Growth Rate (2026 - 2031) | 5.63 % |
| Fastest Growing Market | Asia Pacific |
| Largest Market | Asia Pacific |
| Market Concentration | Medium |
Major Players *Disclaimer: Major Players sorted in no particular order Image © Mordor Intelligence. Reuse requires attribution under CC BY 4.0. | |
Used Construction Equipment Market Analysis by Mordor Intelligence
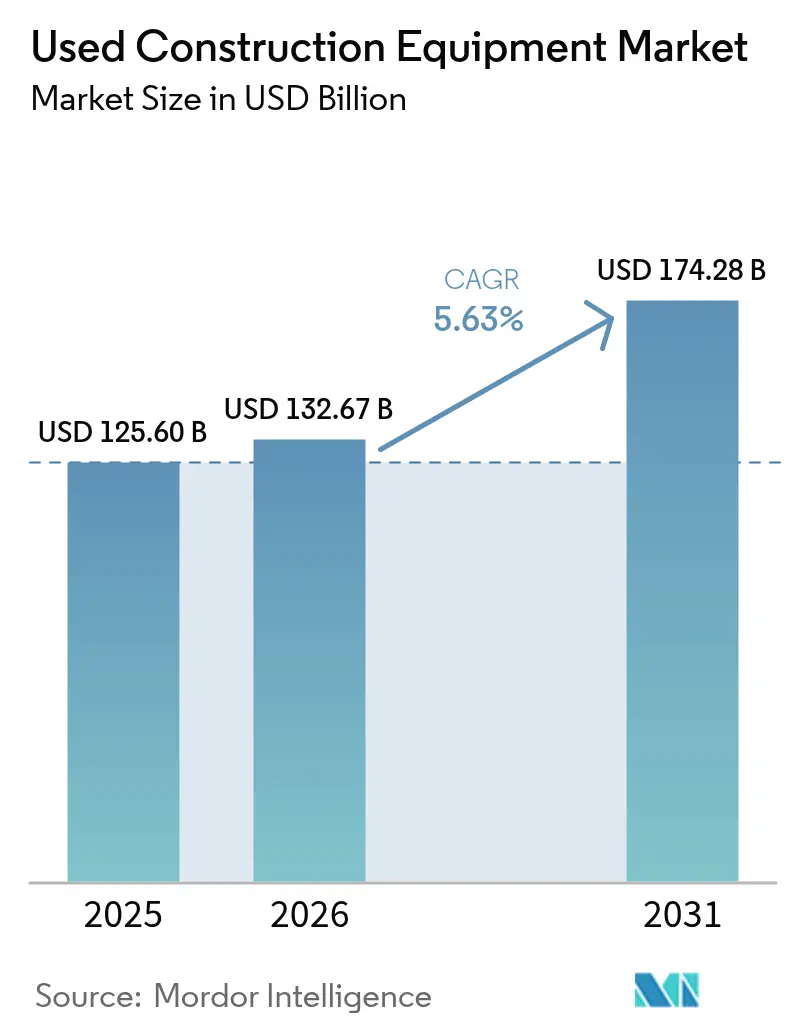
Used construction equipment market size in 2026 is estimated at USD 132.67 billion, growing from 2025 value of USD 125.60 billion with 2031 projections showing USD 174.28 billion, growing at 5.63% CAGR over 2026-2031. Robust infrastructure pipelines in Asia-Pacific, the acceleration of residual values, and supply-chain disruptions that extend original-equipment lead times are recalibrating purchase decisions toward immediately deployable assets. Fleet operators in both mature and emerging regions now treat pre-owned machines as core capacity, compressing traditional replacement windows and reshaping residual value models. The widening gap between project start dates and new-equipment delivery is also stimulating cross-border flows, with dealers shipping inventory from slower to faster growing regions to arbitrage price differentials. Meanwhile, electrification mandates in urban centers are creating two distinct value curves in which compliant electric units command premiums while older diesel machines retain demand in unrestricted territories.
Key Report Takeaways
- By product type, excavators held 42.68% of the used construction equipment market share in 2025; cranes recorded the highest 6.42% CAGR forecast to 2031.
- By drive type, internal combustion engines dominated with a 90.92% of the used construction equipment market share in 2025, while electric powertrains are expanding at an 8.08% CAGR to 2031.
- By end-use industry, construction and infrastructure accounted for 59.02% of the used construction equipment market share in 2025 and are advancing at a 6.15% CAGR through 2031.
- By sales channel, dealers and brokers held a 53.78% of the used construction equipment market share in 2025; auction platforms recorded the highest 7.03% CAGR forecast to 2031.
- By geography, Asia-Pacific commanded 47.62% of the used construction equipment market share in 2025 and leads growth at a 6.74% CAGR through 2031.
Note: Market size and forecast figures in this report are generated using Mordor Intelligence’s proprietary estimation framework, updated with the latest available data and insights as of 2026.
Market Trends and Insights
Drivers Impact Analysis of Used Construction Equipment Market*
| Driver | (~) % Impact on CAGR Forecast | Geographic Relevance | Impact Timeline |
|---|---|---|---|
| Supply-Chain-Driven Fleet Renewals | +1.2% | Global with peak impact in North America and Asia-Pacific | Short term (≤ 2 years) |
| Infrastructure Stimulus Emerging Markets | +1.1% | Asia-Pacific core, spill-over to Middle East and South America | Long term (≥ 4 years) |
| Soaring Residual Values Resale ROI | +0.9% | Global, especially Europe and North America | Medium term (2-4 years) |
| Electrification Mandates for Urban Job-Sites | +0.8% | Europe and select North American cities, expanding globally | Long term (≥ 4 years) |
| Rapid Digitalization Auction Platforms | +0.7% | Global with early adoption in North America and Europe | Medium term (2-4 years) |
| OEM Buy-Back and Certified Programs | +0.6% | North America and Europe, emerging in Asia-Pacific | Medium term (2-4 years) |
| Source: Mordor Intelligence | |||
Supply-Chain-Driven Fleet Renewals
OEM delivery times that stretch 12-18 months have turned used assets into bridge solutions that frequently become permanent parts of the fleet. Contractors now pay high premiums over pre-2024 valuation benchmarks for immediate delivery, particularly in specialty categories where factory output remains constrained. Demand no longer follows legacy economic cycles and instead hinges on construction start dates, creating a structural pull that underpins the used construction equipment market through the near term. Dealers report that standardized models such as 20- to 30-ton excavators and mid-size wheel loaders transact fastest, because parts availability and operator familiarity compress adoption risk. The dynamic is especially intense in North America and the Asia-Pacific, where mega-projects overlap with housing shortages. These conditions sustain above-trend prices and encourage fleet managers to hedge future availability by locking in secondary-market capacity early.
Infrastructure Stimulus in Emerging Markets
Asia-Pacific governments need approximately USD 43 trillion in capital spending through 2035, with India’s USD 1.4 trillion National Infrastructure Pipeline and China’s urban renewal plans headline examples [1]“Meeting Asia’s Infrastructure Needs,” Asian Development Bank, adb.org. Domestic production cannot fully cover near-term demand for standardized equipment, so imports of 3- to 5-year-old machines fill the gap. Dealers in Japan, Europe, and North America increasingly ship compliant units to India, Indonesia, and the Philippines, creating a jump in cross-border flows since 2024. Price arbitrage narrows as buyers in emerging markets gain real-time visibility into global listings, forcing sellers to align asking prices with international benchmarks. Governments often prioritize project speed over equipment age, making lightly used machinery acceptable as long as reliability thresholds are met.
Soaring Residual Values Driving Resale ROI
Typical depreciation curves have contracted significantly, converting disposal from a cost center into a profit source for many owners. Resale upside is altering lease structures, with term lengths shortening to three years so fleets can capture elevated exit values. Buyers are choosing brands and configurations with the strongest secondary-market performance, shifting negotiating leverage toward OEMs that publish transparent buy-back guarantees. Smaller contractors benefit as stronger trade-in positions open access to higher-tier machines that once sat outside their budgets. The feedback loop of tight supply and elevated prices reinforces asset appreciation, further pulling capital into the used construction equipment market.
Electrification Mandates for Urban Job-Sites
London’s Non-Road Mobile Machinery Low Emission Zone and Norwegian city pledges for zero-emission construction sites are pushing electric machines into premium territory, often above diesel equivalents [2]“Non-Road Mobile Machinery Low Emission Zone,” Transport for London, tfl.gov.uk. Contractors win jobs partly based on emission compliance, translating regulatory timelines into tangible equipment demand. Because OEM electric production remains limited, early adopters enjoy scarcity premiums in resale markets. Parallel diesel fleets still dominate rural and heavy-duty tasks, so value curves bifurcate by geography rather than technology alone. Battery improvements are narrowing the performance gap, yet the total cost of ownership already favors electrics in low-utilization urban projects where idle diesel burn and mandated retrofit costs erode margins.
Restraints Impact Analysis of Used Construction Equipment Market*
| Restraint | (~) % Impact on CAGR Forecast | Geographic Relevance | Impact Timeline |
|---|---|---|---|
| Volatile Used-Equipment Price Cycles | -0.8% | Global, highest swings in commodity-dependent regions | Short term (≤ 2 years) |
| Financing Tightness for Older Assets | -0.6% | North America and Europe, emerging in Asia-Pacific | Medium term (2-4 years) |
| Regulatory Uncertainty on Engine Retrofits | -0.5% | Europe and North America, extending to Asia-Pacific | Long term (≥ 4 years) |
| Fragmented Inspection-Quality Standards | -0.4% | Global with uneven enforcement | Medium term (2-4 years) |
| Source: Mordor Intelligence | |||
Volatile Used-Equipment Price Cycles
Quarterly swings impede financing and disposal decisions, particularly in mining-oriented equipment that tracks commodity super-cycles. In downturns, values of haul trucks and large loaders can halve within 12 months before recovering as metal prices rebound. Small contractors without diversified fleets face balance-sheet stress, sometimes delaying purchases until volatility subsides, which compresses liquidity and amplifies further price drops. Less predictable cash flows also deter lenders, tightening credit just when buyers most need financing to capitalize on discounted inventory.
Financing Tightness for Above 8-Year Assets
Banks are retreating from loans on machines older than eight years because default likelihood rises and residual values become difficult to model. Interest-rate spreads widen, and loan-to-value ratios fall significantly, pushing many transactions to cash. Larger rental fleets can absorb the cost, but small operators find themselves locked out of quality late-life equipment. Peer-to-peer platforms and asset-backed securities provide partial relief, yet their scale is still low and geographic coverage uneven. The financing gap places a practical ceiling on secondary-market liquidity for aging machines, muting total growth potential.
*Our forecasts treat driver/restraint impacts as directional, not additive. The impact forecasts reflect baseline growth, mix effects, and variable interactions.
Used Construction Equipment Market Segment Analysis
By Product Type:
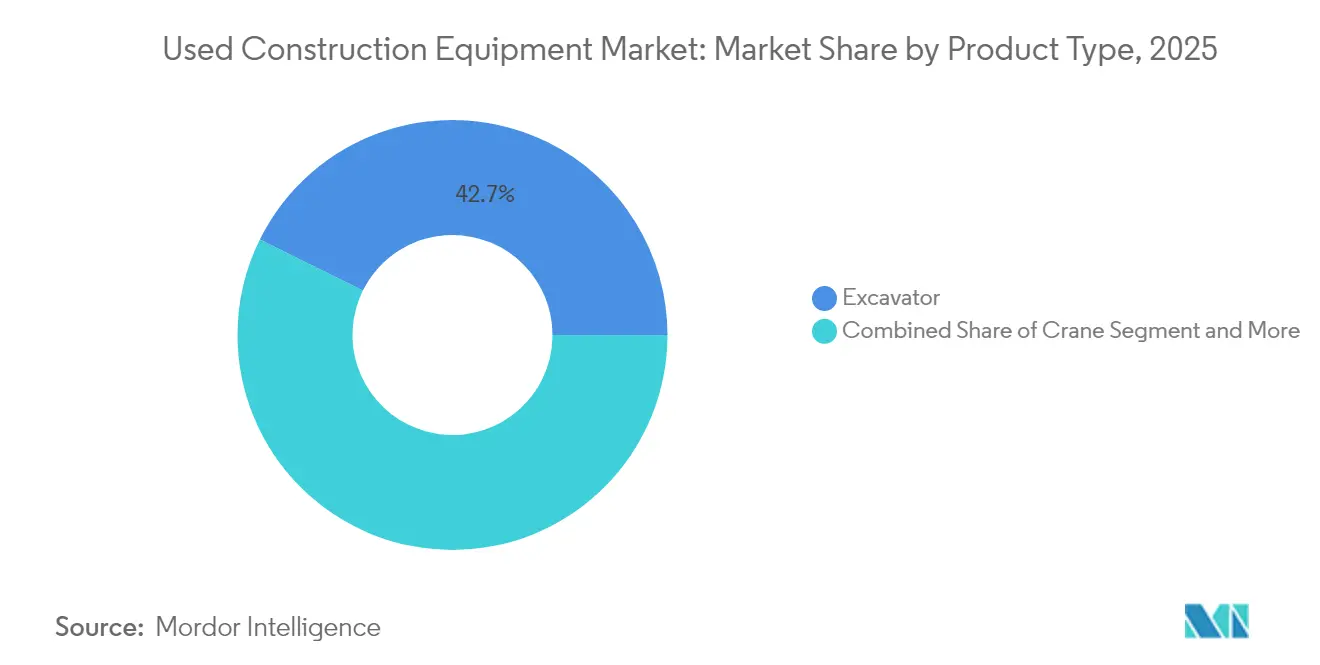
Excavators Lead While Cranes AccelerateExcavators accounted for 42.68% of the used construction equipment market size in 2025, owing to their versatility across site preparation, trenching, and demolition tasks. Ready access to parts and operator familiarity reduces downtime and underpins high absorption in rental fleets. The category’s liquidity attracts both institutional investors and smaller contractors, keeping turnover brisk even during seasonal slowdowns. Cranes are advancing at a 6.42% CAGR through 2031 as urban densification fuels demand for high-reach lifting solutions. Tight OEM production slots for tower and crawler cranes amplify the premium on late-model units with accurate service logs. Sellers can thus capture above-average margins, and buyers accept them because rental alternatives are scarce during peak building cycles. Attachments and material-handling implements add modular flexibility, encouraging contractors to optimize fleets around core carriers and specialized tooling rather than multiple dedicated machines. This modular approach bolsters absorption for quick-coupler systems that accelerate jobsite changeovers.
Rising safety standards are also directing attention to telematics-enabled models that record duty cycles and overload events. Units with complete electronic histories transact faster and at higher values, especially in Europe, where regulatory compliance is strict. Meanwhile, standardized control layouts across major brands ease cross-training, allowing mixed fleets to reallocate operators without productivity penalties. That capability reinforces excavators’ leadership, while specialized lifting still distinguishes cranes as the fastest growth niche within the used construction equipment market.


By Drive Type:
ICE Dominance Faces Electric DisruptionInternal combustion engines continue to hold 90.92% of the used construction equipment market share in 2025 due to unmatched energy density and ubiquitous diesel infrastructure. Heavy earthmoving in remote mining and pipeline projects will keep diesel indispensable beyond the forecast horizon. Yet electric machines are showing an 8.08% CAGR and are already pivotal in city centers with decibel limits and carbon budgets. Premiums of 20-30% persist for compliant units because supply is thin and the learning curve for maintenance is steep. Fleets exploiting night-shift work in emission-controlled areas find total operating costs lower for electrics, particularly when local utilities offer discounted off-peak charging.
Hybrid systems are carving a narrow but resilient space, especially on equipment with variable duty cycles, such as telescopic handlers that idle extensively. Diesel-electric drivetrains lower fuel consumption and delay battery replacement schedules, balancing capital cost against operational savings. However, the technology premium narrows as battery prices continue to fall. For now, ICE dominance gives the used construction equipment market essential depth and value stability, while growth in zero-emission zones lays the groundwork for a gradual but irreversible shift to electrics.
By End-use Industry:
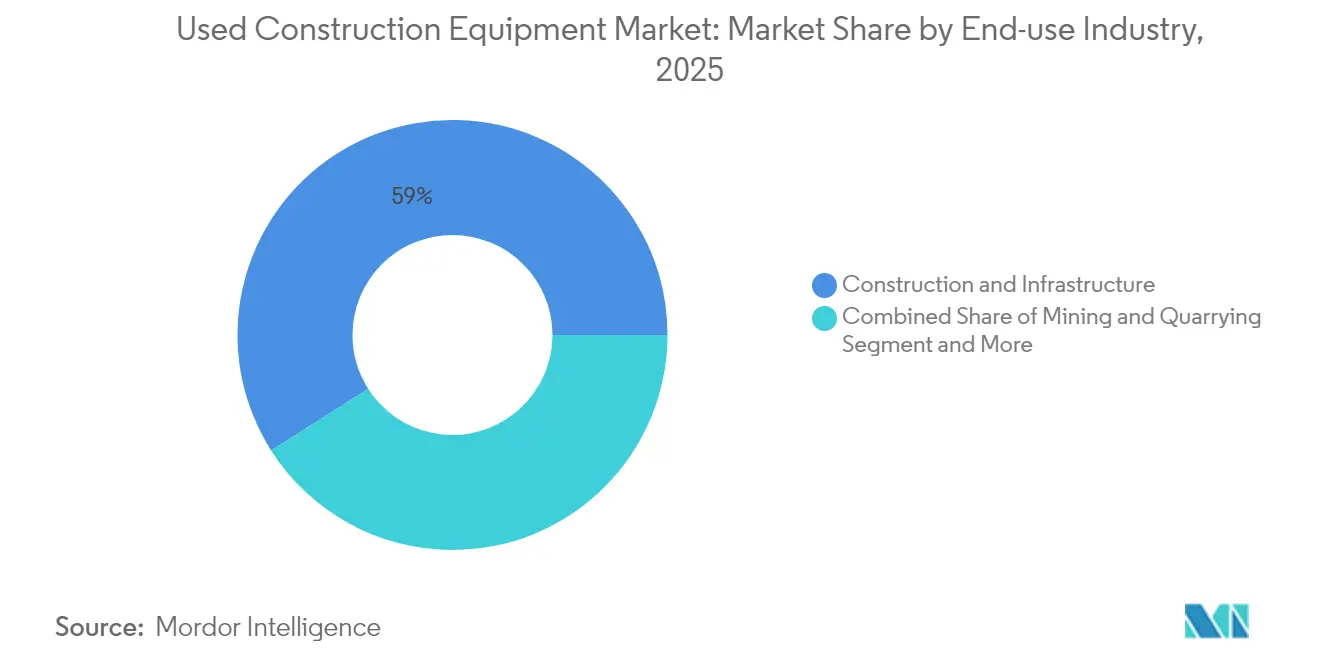
Construction and Infrastructure Drive DemandConstruction and infrastructure applications controlled 59.02% of the used construction equipment market share in 2025 and are forecast to advance at a 6.15% CAGR as governments pursue backlog reduction in transport, energy, and housing. Megaprojects compress project lead times, forcing contractors to source ready-to-deploy units rather than wait on lengthy build-to-order cycles. Mining and quarrying present a stable base load volume for ultra-class haul trucks and large bulldozers whose secondary value correlates strongly with commodity prices. Agriculture and forestry create seasonal trade flows that keep inventory cycling, though volumes remain small relative to infrastructure.
E-commerce warehouse expansion is stimulating industrial builds that integrate material-handling automation, pushing crossover demand for compact loaders and telehandlers. Contractors now redeploy equipment across segments to maximize utilization; an excavator might dig drainage on an infrastructure site in spring and later load aggregate at a quarry. Such versatility increases fungibility, buoying liquidity and supporting steady price floors.
By Sales Channel:
Dealers Dominate While Auctions DigitalizeDealer and broker networks retained a 53.78% of the used construction equipment market share in 2025 by combining inspection, warranty, and financing packages that de-risk transactions. They excel in heavy or specialized categories where post-sale technical support is critical. Online and physical auctions are expanding at a 7.03% CAGR as global bidding widens customer pools and lowers fees. Digital catalogs, augmented-reality inspections, and escrow services reassure international buyers, making it easier to import equipment from surplus regions.
OEM-certified pre-owned branches overlay the dealer-auction landscape with a branded assurance layer. Premiums of 10-15% are common, yet buyers often accept them because warranties and financing tie-outs streamline procurement. Rental fleet disposals feed all channels, and their well-documented maintenance history keeps clearance rates high. Over time, channel choice is turning into a portfolio decision: fleets mix dealership purchases for critical machines, auction acquisitions for opportunistic buys, and OEM programs for warranty-sensitive deployments.
Geography Analysis
APAC Used Construction Equipment Market
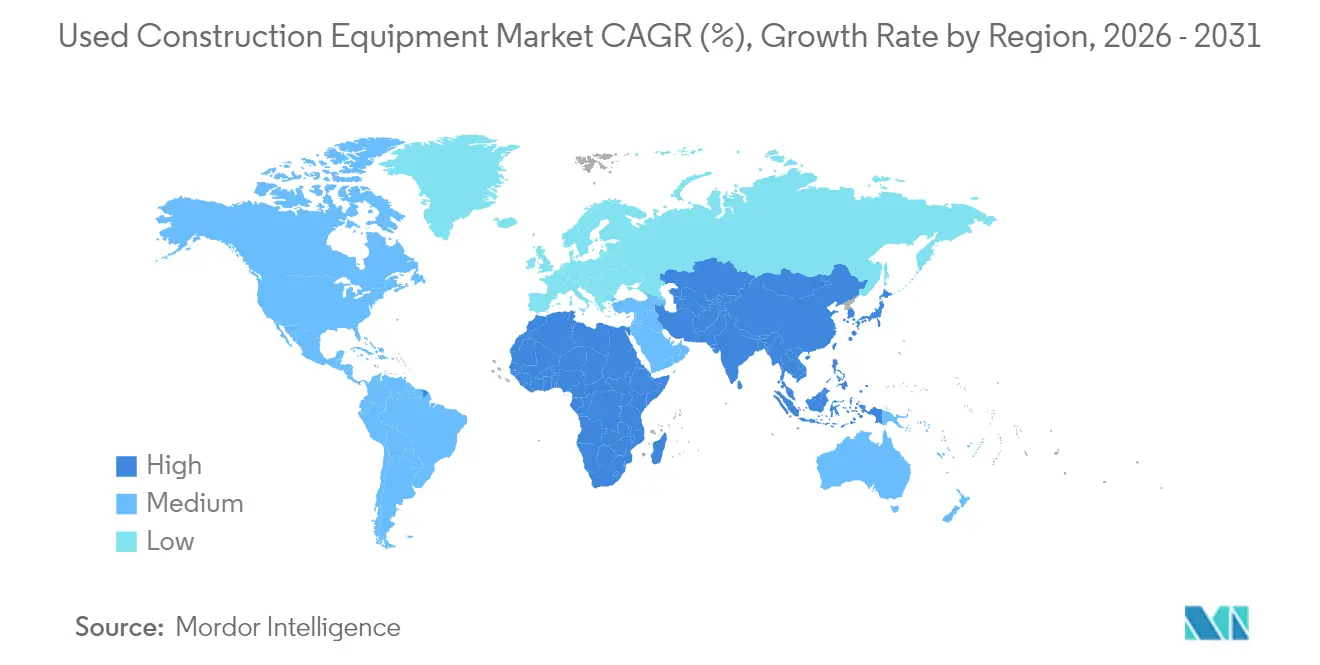
Asia-Pacific held 47.62% of the used construction equipment market share in 2025 and will grow at a 6.74% CAGR through 2031 as India, China, and Southeast Asian nations accelerate spending on transport corridors, renewable power, and housing. India’s National Infrastructure Pipeline and China’s urban renewal policies drive sustained machine absorption, overwhelming local OEM capacity and prompting imports from Japan, Europe, and North America. Equipment transit times shorten due to regional maritime logistics investments, enabling just-in-time arrivals that align with project mobilization schedules.
North America and Europe Used Construction Equipment Market
North America's growth is underpinned by a mature secondary-market ecosystem and steady public-works appropriations in the United States. OEM buy-back programs are most advanced here, allowing contractors to rotate fleets every three to four years without major depreciation hits. Canada’s uptick in resource projects has boosted demand for specialized forestry and pipeline equipment, further deepening liquidity in cross-border trade. Europe exhibits moderate volume but high unit values, driven by stringent emission frameworks that elevate the price of Stage V-compliant machines. Residual values remain strong partly because reimbursement programs in Germany and the Nordics subsidize cleaner equipment adoption. Electric mini-excavators and compact wheel loaders are disproportionately represented in European resales thanks to dense urban markets and early regulatory adoption.
MEA and South America Used Construction Equipment Market
The Middle East and Africa are emerging hot spots, especially Gulf Cooperation Council nations that balance oil revenue diversification with ambitious construction programs. Mega-projects such as NEOM in Saudi Arabia require immediate fleets, favoring imports of reliable late-model machines. Sub-Saharan Africa’s mining expansion sustains demand for several construction equipment, though political risk and logistics still limit broader market depth. South America mirrors commodity cycles; Brazil and Chile purchase heavily during copper and iron-ore upswings, then slow during downturns, injecting volatility but also arbitrage opportunities into global flows.

Regulatory Landscape
Regulation in the used construction equipment market centers on non-road engine emissions compliance and market-access rules that affect cross-border trading. In the United States, EPA non-road diesel engine rules (including Tier 4 Final requirements under 40 CFR Part 1039) continue to set the compliance baseline for many late-model machines, which supports the resale liquidity for these units. In Europe, Stage V remains the primary emissions reference point influencing residual values and the movement of compliant machines into regulated urban job sites.
Beyond emissions, type-approval and trade policy are introducing additional decision points for buyers and sellers. Regulation (EU) 2025/14, adopted in December 2024, establishes updated type-approval and market surveillance requirements for non-road mobile machinery circulating on public roads, with most provisions applying from 29 January 2028. This shifts documentation and conformity planning earlier for machines intended for road circulation. In the United States, a June 2026 proclamation reduced Section 232 tariffs from 25% to 15% for specified agricultural, construction, and industrial equipment for June 8, 2026 through December 31, 2027, conditional on U.S.-origin metal content requirements, which can alter landed costs and sourcing strategies for traded equipment and components.
Value Chain Analysis
The value chain runs from upstream component and materials suppliers (steel, structural weldments, hydraulics, electronics) to OEMs such as Caterpillar, Komatsu, and Volvo Construction Equipment, and then into downstream remarketing through dealer-broker networks, rental fleet disposals, independent refurbishers, and physical and online auction platforms. Used equipment transaction value is increasingly shaped by service data and verification layers, including telematics histories, standardized inspections, and OEM-backed certified programs that bundle warranties, parts support, and financing with the asset.
Upstream and midstream supply constraints continue to influence secondary-market flows by extending new-equipment lead times and increasing the value of immediately available machines. Industry reporting in 2026 also highlighted persistent risk in steel-intensive subassemblies and hydraulic components, with structural weldment lead times exceeding 12 weeks for a large share of fabricators, reinforcing reliance on used units as bridge capacity. Circular-economy infrastructure is adding to supply as well, with Komatsu reporting 22 remanufacturing locations across 11 countries (as of 2024). That rebuild capacity supports component availability, improving the economics and uptime profile of older fleets traded through dealers and auctions.
Competitive Landscape
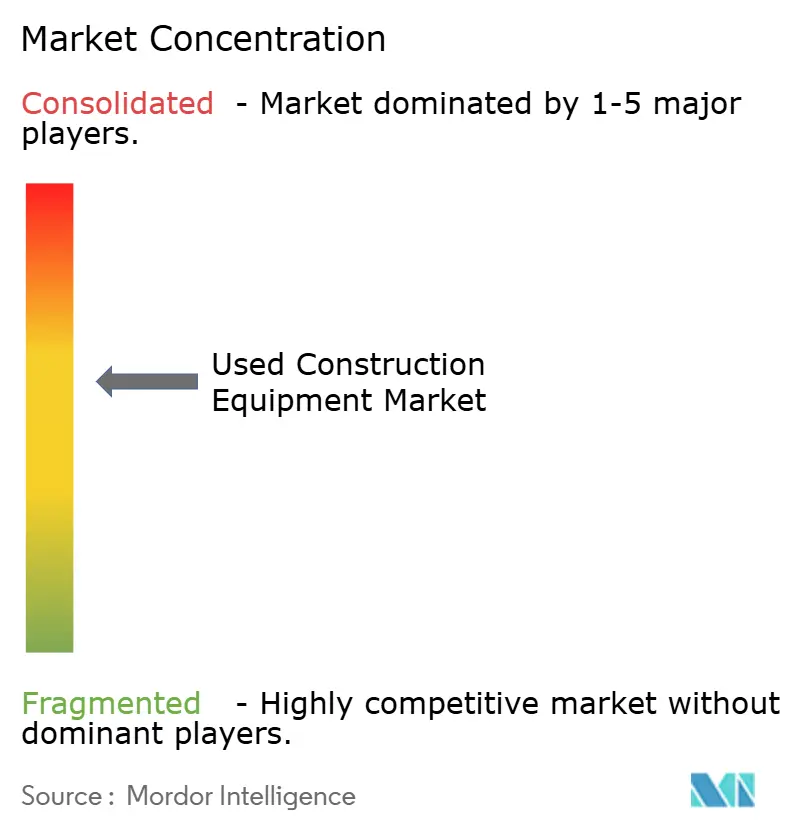
The competitive arena remains moderately fragmented. The top OEM-aligned certified pre-owned programs and the largest independent auction houses together hold a major share of global transaction value, with the remainder split among thousands of regional dealers and brokers. OEMs such as Caterpillar, Komatsu, Liebherr, and XCMG are capturing secondary-market margin by bundling warranties, telematics subscriptions, and financing into one invoice. Independent dealers respond by specializing in niche categories like foundation drills or slip-form pavers, where OEM involvement is lighter.
Technology adoption is pivotal. Leading players deploy IoT sensors and predictive analytics that report real-time machine health, attracting buyers who value uptime warranties. Komatsu’s acquisition of an AI analytics firm equips its dealer network with predictive maintenance dashboards that guide trade-in valuations, tightening the buy-sell spread [3]“Komatsu Acquires Octodots Analytics,” Komatsu Ltd., komatsu.com. Hitachi partners with energy-storage start-ups to retrofit older excavators with hybrid kits, creating upgrade paths that extend asset life while meeting local emission rules.
Auction houses invest heavily in cloud infrastructure and global logistics alliances to offer one-stop export solutions that compress delivery from six weeks to three. Dealer management systems now integrate with online platforms, giving sellers instant visibility into global price benchmarks and accelerating inventory turnover. Cross-listing equipment across multiple channels maximizes exposure, but also intensifies competition on service quality, forcing slower adopters to modernize or lose market share.
Used Construction Equipment Industry Leaders
Caterpillar Inc.
Komatsu Ltd.
Deere & Company
Volvo Construction Equipment
Hitachi Construction Machinery Co., Ltd.
- *Disclaimer: Major Players sorted in no particular order
Used Construction Equipment Market Companies Covered in this Report
- Caterpillar Inc.
- Komatsu Ltd.
- Deere & Company
- Volvo Construction Equipment
- Hitachi Construction Machinery Co., Ltd.
- Liebherr Group
- Kobelco Construction Machinery Co., Ltd.
- Terex Corporation
- Manitou Group
- CNH Industrial (Case CE)
- JCB
- Sany Heavy Industry Co. Ltd.
- Xuzhou Construction Machinery Group Co., Ltd.
- HD Hyundai Construction Equipment Co., Ltd.
- Bobcat Company
- Kubota Corporation
- Wirtgen Group
- Astec Industries

Market Opportunities and Future Outlook
Electrification compliance and data-backed assurance are creating clearer white space in the used market, especially where urban job sites apply low-emission requirements and buyers want verified operating history. London NRMM controls and Norwegian zero-emission construction pledges are already pushing compliant machines into premium territory, and limited availability of late-model electric units lifts the value of OEM-led certified offerings and dealer inventory that can validate battery condition, duty cycles, and maintenance records. Volvo Construction Equipment's EWR150 Electric wheeled excavator launch in Europe in June 2026 is a tangible marker of OEM portfolio expansion that can widen the pool of tradeable electric machines over time, increasing the importance of charging-ready job sites, battery service capability, and residual-value setting for electrified assets.
Digitalization and automation are also becoming visible differentiators in used-equipment pricing and liquidity, as buyers focus on productivity features alongside the base machine. The completion of Caterpillar's Skycatch acquisition (July 2026) highlights OEM investment in spatial data capture and analysis for mining and earthmoving, which supports opportunities for dealers, auction platforms, and refurbishers to authenticate software compatibility, sensor health, and telematics continuity as machines move into second and third ownership. This also creates a route for remanufacturing networks to pair component rebuilds with electronics calibration, supporting warrantable, export-ready used machines.
Recent Industry Developments in Used Construction Equipment Market
- July 2026: Caterpillar completed its acquisition of Skycatch, Inc., adding spatial data capture and analysis capabilities to its mining technology portfolio. The acquisition strengthens digital workflows around surveying, productivity, and site planning that can be bundled across new and used equipment deployments. It also increases the value of connected-machine histories in resale and certified pre-owned channels, where verified data supports pricing and financing decisions.
- January 2025: JCB India signed an MoU with Shriram Automall India Limited (SAMIL) to streamline resale of pre-owned JCB machines using SAMIL's phygital marketplace. The arrangement expands manufacturer-backed access to auction and remarketing infrastructure, improving liquidity and price discovery for JCB assets. It also reinforces structured resale pathways as a lever in fleet rotation decisions for contractors and rental operators.
- December 2024: XCMG Machinery launched the XCMG Certified Used Equipment brand to organize certified remarketing around lifecycle management. The program formalizes inspection, refurbishment, and documentation practices that help de-risk transactions for buyers, including cross-border purchasers. It adds competitive pressure on independent dealers and auction platforms to match warranty, verification, and aftersales service levels.


Used Construction Equipment Market Report Scope and Research Methodology
Market Definition and Coverage
For this report, the market covers transactions of pre-owned construction equipment that is resold for use in construction, infrastructure, and related job sites, across dealer, auction, and direct channels. Values reflect equipment resale revenue captured at the point of sale.
Scope exclusions: excludes spare parts, attachments sold separately, and standalone maintenance services that do not involve a used equipment sale.
Segments Covered in This Report
- By Product Type
- Crane
- Telescopic Handler
- Excavator
- Material Handling Equipment
- Loader and Backhoe
- Attachments and Others
- By Drive Type
- Internal Combustion Engine
- Electric
- Hybrid
- By End-use Industry
- Construction and Infrastructure
- Mining and Quarrying
- Agriculture and Forestry
- Industrial and Warehousing
- By Sales Channel
- Dealer / Broker
- Auction (Physical and Online)
- Rental Fleet Disposal
- Direct OEM Certified Pre-owned
- By Geography
- North America
- United States
- Canada
- Rest of North America
- South America
- Brazil
- Argentina
- Rest of South America
- Europe
- Germany
- United Kingdom
- France
- Russia
- Spain
- Italy
- Rest of Europe
- Asia-Pacific
- China
- India
- Japan
- South Korea
- Australia
- Rest of Asia-Pacific
- Middle East and Africa
- United Arab Emirates
- Saudi Arabia
- Turkey
- Egypt
- South Africa
- Rest of Middle East and Africa
- North America
Data Sources, Market Sizing, and Validation
Desk Research
Desk work was used to set the demand context and to identify macro and sector signals that move used equipment volumes and pricing. We referenced public sources such as the US Census Bureau construction spending series, Eurostat construction output indicators, and the World Bank and IMF macro time series, plus trade and customs statistics where available for machinery flows.
To map the industry structure, we also reviewed company annual reports and investor decks from major dealers, auction platforms, and rental businesses, along with association and regulator publications when they clarify equipment utilization, financing availability, and emissions rules. Select paid subscriptions were used for company financials, news and financials, import-export shipment-level checks, and patent databases to understand electrification-related technology direction. These sources are not exhaustive, and we reviewed other public materials to collect, validate, and reconcile data points during the study.
Primary Interviews and Surveys
Primary work focused on validating how used equipment is priced and how quickly units turn across regions, since those two items drive the value model the most. We spoke with dealers and brokers, auction participants, rental fleet managers handling disposals, and end users across construction, mining, industrial, and agriculture cohorts, then checked with regional experts to confirm local cycle timing.
Distribution of primary research fieldwork respondents
| Company type | Respondent position | Region |
|---|---|---|
| Top tier: 29% | CXOs: 18% | APAC: 49% |
| Mid tier: 52% | Functional/Unit leaders: 26% | EMEA: 30% |
| Smaller Players: 19% | Managers: 56% | Americas: 21% |
Market-Sizing & Forecasting
Sizing starts from a top-down build where construction and infrastructure activity, fleet replacement cycles, and used-to-new switching are translated into an addressable pool of resale transactions by region. Once that pool is formed, it is converted to value by applying observed pricing bands that shift with machine age, hours, and local supply pressure.
To keep the totals realistic, we corroborate outputs with selective bottom-up approximations, such as dealer and auction channel roll-ups, sampled average selling price (ASP) by equipment class, and unit flow checks from rental fleet disposals. Key inputs used in the model include construction spending momentum, infrastructure pipeline timing, equipment utilization and replacement intervals, auction clearance rates, and residual value trends by machine type and drive type (including early electric and hybrid premiums in certain markets).
For forecasting, scenario analysis was used because the market is sensitive to shifts in project starts and credit conditions, and both can change quickly across geographies. Where interview data was thin for smaller channels, gaps were filled using region-level proxy ratios (for example, dealer share versus auctions) and then adjusted after follow-up validation checks with practitioners.
Data Validation & Update Cycle
Validation is done through consistency checks that compare model outputs against independent signals, such as construction output direction, auction activity indicators, and reported resale or disposal commentary from industry participants. When outliers appear, we revisit assumptions, recheck currency conversion timing, and trigger follow-up calls to confirm whether the variance is real or data-driven.
Before sign-off, the model and narrative go through multi-step analyst reviews so definitions, units, and math align across tables. Reports are refreshed annually, and interim updates are made when material events occur, such as sharp rate moves, major policy shifts, or sudden supply constraints. Right before delivery, we complete a final pass to ensure the latest public releases and field inputs are incorporated.
Mordor Intelligence's Used Construction Equipment Market Sizing Compared With Other Published Estimates
Published market values for used construction equipment can look far apart because firms do not always count the same transaction types, channels, and timing for currency conversion. Differences also show up when one estimate is built from unit flows and pricing, and another is scaled from a broader machinery spending number.
Attachments sold separately sit outside Mordor Intelligence's scope, and that single exclusion can move totals upward in studies that bundle attachments, parts, and bundled service revenue into the resale value. The spread can also come from how auction prices are annualized, whether rental fleet disposals are treated as full resale revenue, and how quickly ASPs are assumed to normalize after supply chain swings in new equipment lead times.
Benchmark comparison
| Source | Market Size | Gaps in Research Methodology |
|---|---|---|
| Mordor Intelligence | USD 125.60 B (2025) | |
| Global Research Publisher A | USD 142.30 B (2025) | This estimate appears to use a broader revenue bucket that can fold in adjacent items like attachments and add-ons, and it may apply a higher blended ASP across equipment classes and ages, which lifts the 2025 total. |
| Industry Research Portal B | USD 69.80 B (2025) | This number likely reflects a narrower definition of pre-owned equipment revenue, with tighter channel capture or partial inclusion of informal and cross-border resale, and it may exclude some heavy equipment categories that are counted in wider market views. |
Looking across the table, most of the difference is explained by what gets counted around the machine sale itself and how completely each channel is captured. By keeping the model tied to resale transactions and checking pricing and turnover with field inputs, the final figure stays traceable to clear variables that can be repeated year to year.


Key Questions Answered in the Report
How fast is demand for pre-owned machinery growing in Asia-Pacific?
Asia-Pacific demand is expanding at a 6.74% CAGR to 2031, supported by infrastructure megaprojects that need immediately deployable fleets.
Which equipment category holds the largest share of global resale value?
Excavators lead with 42.68% of worldwide transactions thanks to their versatility and robust dealer support.
Why are residual values rising rather than falling?
Tight OEM supply, longer lead times, and high project urgency have lifted five-year residuals to about 50% of original list prices, making disposal profitable.
How do emissions rules influence purchasing decisions?
Urban zero-emission mandates push buyers toward electric or Stage V-compliant units that can command 20-30% premiums over conventional diesel equipment.
Page last updated on:


 Your data is secure and never sold or shared.


