
Market Overview
| Study Period | 2021 - 2031 |
|---|---|
| Forecast Data Period | 2026 - 2031 |
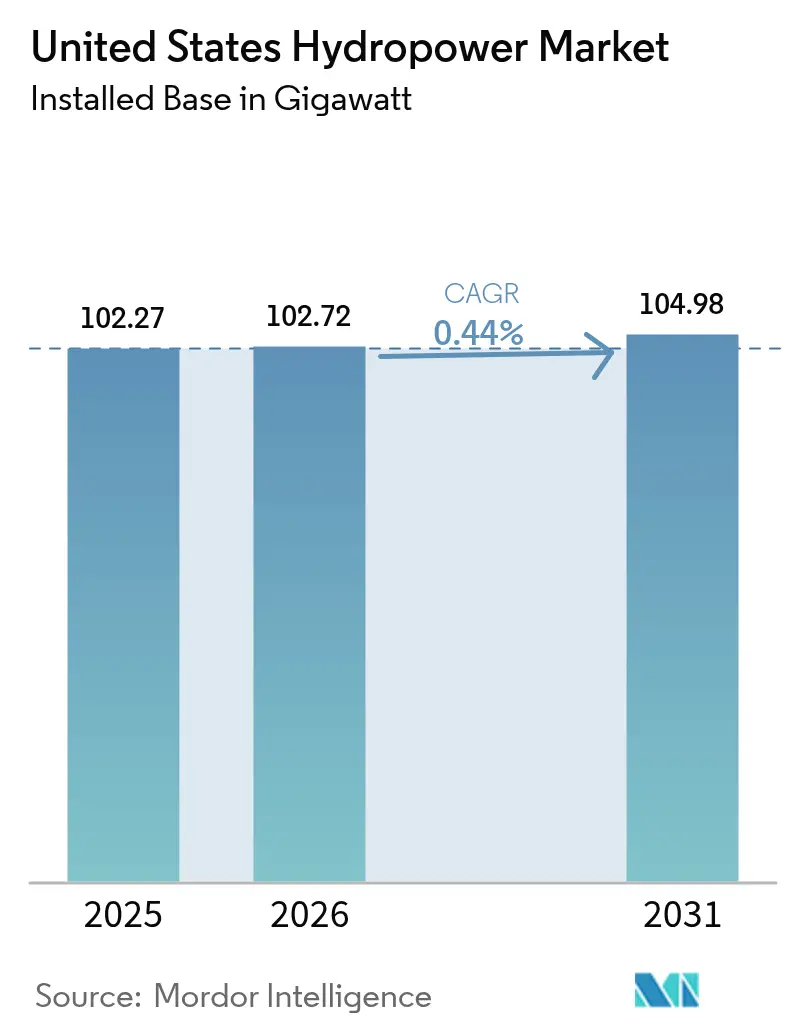
| Base Year Market Size (2025) | 102.27 gigawatt |
| Market Volume (2026) | 102.72 gigawatt |
| Market Volume (2031) | 104.98 gigawatt |
| Growth Rate (2026 - 2031) | 0.44 % |
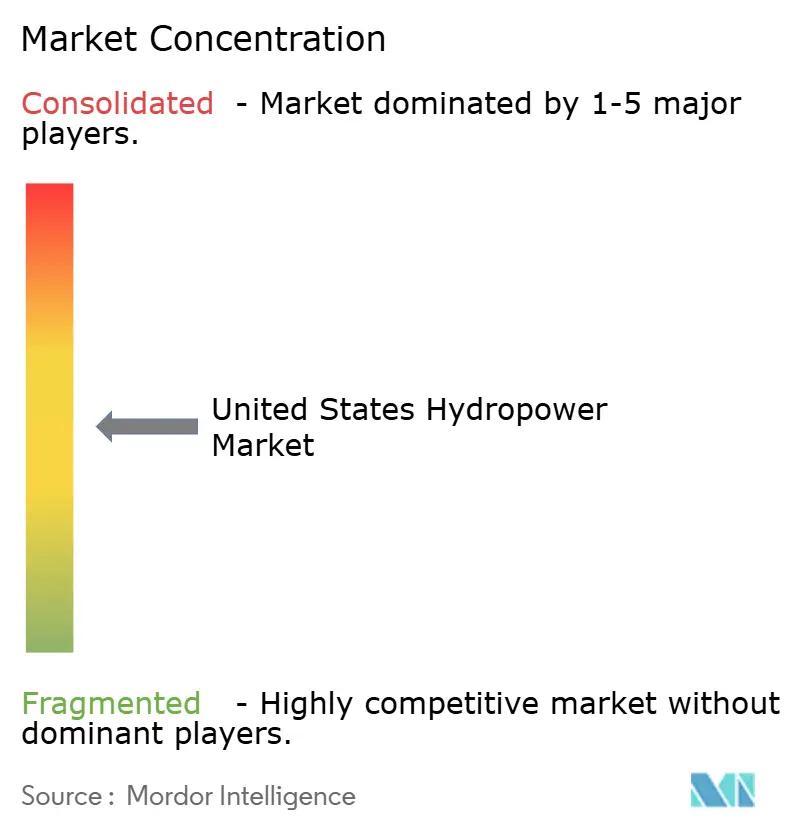
| Market Concentration | Medium |
Major Players *Disclaimer: Major Players sorted in no particular order Image © Mordor Intelligence. Reuse requires attribution under CC BY 4.0. | |
United States Hydropower Market Analysis by Mordor Intelligence
The United States Hydropower Market size was valued at 102.27 gigawatt in 2025 and estimated to grow from 102.72 gigawatt in 2026 to reach 104.98 gigawatt by 2031, at a CAGR of 0.44% during the forecast period (2026-2031).
The restrained outlook reflects a mature asset base where environmental compliance costs, relicensing delays, and the scarcity of new dam sites hold back large additions. Federal policy now channels capital toward turbine upgrades, governor automation, and digital‐twin deployments that lift plant availability without altering river footprints. Grid operators continue to reward the rapid ramping and inertia of hydropower, creating earnings headroom even when megawatt growth is minimal. Private investors, deterred by licensing risks for greenfield dams, instead target operational improvements that raise output per acre-foot of water. In this efficiency-first landscape, technology suppliers providing predictive maintenance, fish-friendly runners, and real-time controls capture expanding service revenues while overall installed capacity changes only incrementally.
Key Report Takeaways
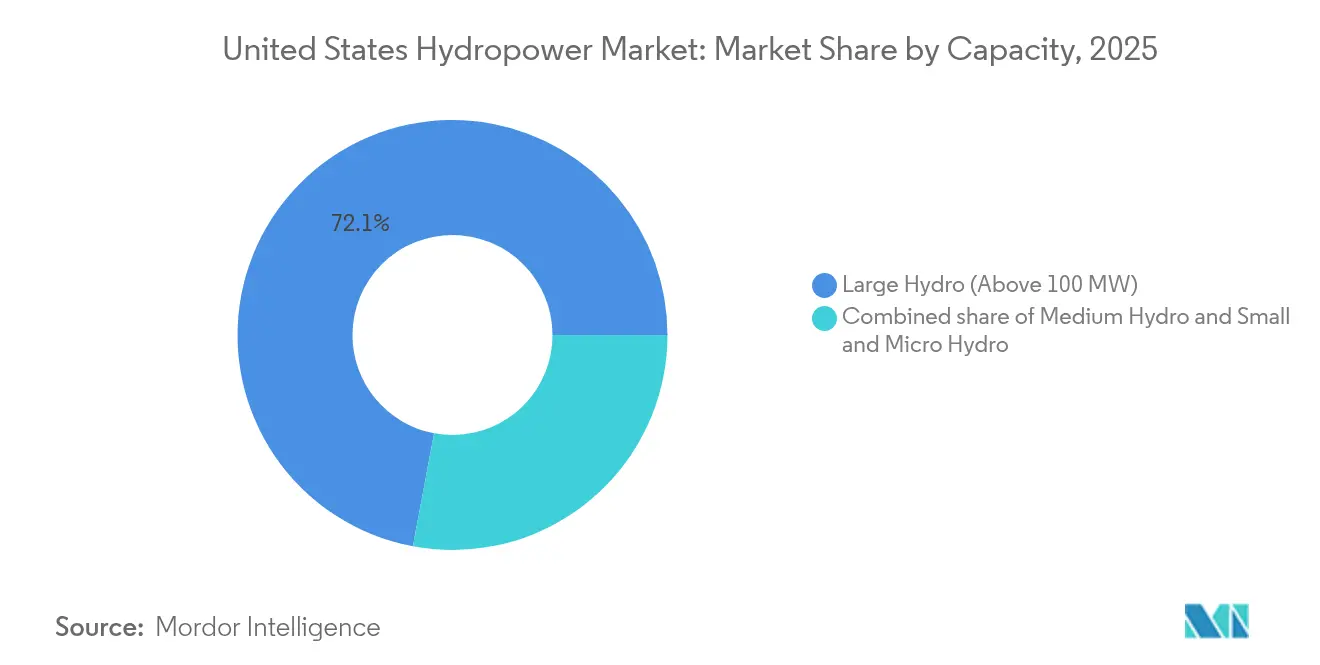
- By capacity rating, large hydro units above 100 MW held 72.05% of the US hydropower market share in 2025, whereas small and micro hydro are projected to advance at a 4.55% CAGR to 2031.
- By technology, Reservoir-Based plants accounted for 68.30% of the US hydropower market size in 2025, while Pumped-Storage facilities posted the quickest 2.3% CAGR through 2031.
- By end-user, Utilities controlled 72.60% of installed capacity in 2025, while independent power producers were forecasted to register the highest 3% CAGR to 2031.
Note: Market size and forecast figures in this report are generated using Mordor Intelligence’s proprietary estimation framework, updated with the latest available data and insights as of 2026.
United States Hydropower Market Trends and Insights
Drivers Impact Analysis*
| Driver | (~) % Impact on CAGR Forecast | Geographic Relevance | Impact Timeline |
|---|---|---|---|
| Federal investment tax-credits extension | +0.15% | Nationwide aging-dam clusters | Medium term (2-4 years) |
| DOE Water Power RD&D funding pipeline | +0.08% | National tech-demo corridors | Long term (≥ 4 years) |
| Grid-support payments for flexible capacity | +0.12% | High-renewables regional grids | Short term (≤ 2 years) |
| Aging coal retirements | +0.06% | Midwest & Southeast | Medium term (2-4 years) |
| Corporate 24 × 7 clean-power procurement | +0.05% | West & Northeast | Medium term (2-4 years) |
| Climate-driven flood-control funds | +0.03% | Southwest watersheds | Long term (≥ 4 years) |
| Source: Mordor Intelligence | |||
Federal Investment Tax-Credits Extension
The Infrastructure Investment and Jobs Act now delivers direct payments covering up to 30% of modernization costs, enabling 46 plants to pursue efficiency gains averaging 14% without adding capacity.[1]U.S. Department of Energy, “Section 243 Incentive Awards,” energy.gov Owners have lined up USD 2.4 billion in matching capital, confirming that the US hydropower market favors upgrades such as runner replacements and generator rewinds over new dams. Down-rating exciter losses and installing variable-speed governors boost annual output within the same hydraulic envelope, a strategy that improves revenue per cubic meter of flow while keeping licensing risk negligible. Because tax equity can be syndicated, smaller public-power entities also tap the credit, accelerating long-delayed electrical balance-of-plant renewals. In aggregate, the incentive nudges national energy supply upward through efficiency rather than expansion.
DOE’s New Water Power RD&D Funding Pipeline
The Water Power Technologies Office earmarked USD 33 million in 2024 for projects that merge digital twins, sonar-based fish detection, and pumped-storage optimization. Pacific Northwest National Laboratory now models entire turbine assemblies in a virtual environment that predicts cavitation before it degrades blades, extending asset life with minimal downtime.[2]Pacific Northwest National Laboratory, “Digital Twin Research,” pnnl.gov Such analytics also compress the expertise gap created by retiring plant operators. Vendors of sensors, fiber-optic stator coils, and cloud SCADA, therefore, gain new domestic demand, positioning the US hydropower market as an export source of diagnostic software even while local megawatts remain flat. Over the long term, these tools could shave O&M expense ratios, improving free cash flow and attracting additional infrastructure capital.
Grid-Support Payments for Flexible Capacity
FERC re-categorized many hydro units as eligible for frequency regulation markets, unlocking compensation streams tied to automatic-generation control and spinning reserve. Pumped-storage already comprises virtually all US long-duration storage, and its operators now cycle multiple times per day to arbitrage midday solar oversupply and evening peak prices. Bonneville Power Administration lifted its 2025 transmission-reinforcement budget to USD 590 million to move hydro flexibility across the Western Interconnection. These revenues are incremental to energy sales, so even plants with unchanged capacity post stronger EBITDA, reinforcing an efficiency-over-expansion thesis.
Aging Coal Retirements Creating Replacement Need
EIA data show the coal fleet contracting each year through 2030, yet most of the retired megawatts sit far from viable hydro sites. Utilities, therefore, focus on squeezing extra kilowatt-hours from existing dams. Duke Energy’s Bad Creek expansion, one of the few greenfield moves, doubles pumped-storage but still underscores that new hydro is the exception, not the rule. In other regions, synchronous condensing conversions let existing turbines provide voltage support previously delivered by coal, again favoring modernization over new builds.
Restraints Impact Analysis*
| Restraint | (~) % Impact on CAGR Forecast | Geographic Relevance | Impact Timeline |
|---|---|---|---|
| Extended FERC relicensing timelines | -0.18% | Nationwide federal projects | Medium term (2-4 years) |
| ESA fish-passage retrofit costs | -0.12% | Pacific Northwest | Long term (≥ 4 years) |
| Low avoided-cost rates in organized markets | -0.08% | PJM, NYISO, CAISO | Short term (≤ 2 years) |
| Distributed PV peak-price cannibalization | -0.05% | California & Arizona | Medium term (2-4 years) |
| Source: Mordor Intelligence | |||
Extended FERC Relicensing Timelines
The Integrated Licensing Process averages 7.6 years, during which capex faces inflation creep and investor patience wanes.[3]Federal Energy Regulatory Commission, “Clean Water Act Section 401 Rule,” ferc.gov Although a December 2024 rule requires agencies to act within one year on water-quality certifications, other consultations—particularly under the Endangered Species Act—can still stretch schedules beyond project pro-formas. As a result, owners often sequence modernization work to coincide with existing license terms, prioritizing asset preservation over expansions that would reopen environmental impact scopes.
ESA-Driven Fish-Passage Retrofit Costs
NOAA estimates annual fish-passage spending at USD 240 million, a burden that lands hardest on smaller reservoirs. Individual contracts, such as the Howard A. Hanson Dam project, consume tens of millions, siphoning funds from capacity additions.[4]U.S. Army Corps of Engineers, “Howard A. Hanson Fish Passage Contract,” usace.army.mil While grants offset part of the bill, many operators select lower-impact efficiency measures, runner reshaping, inflow-outflow sequencing, overhead-raising, or new penstocks, keeping total US hydropower market growth incremental.
*Our forecasts treat driver/restraint impacts as directional, not additive. The impact forecasts reflect baseline growth, mix effects, and variable interactions.
Segment Analysis
By Capacity: Operational Efficiency Underpins Small & Micro Hydro Growth
Large Hydro’s 72.05% share in 2025 underscores the inertia of legacy federal dams whose reservoir footprints cannot meaningfully expand. In contrast, the Small & Micro bracket below 10 MW records a 4.55% CAGR as developers tap non-powered dams and irrigation conduits that bypass complex FERC processes. These projects add just kilowatts at a time, yet their streamlined timelines illustrate how distributed assets can reinforce rural grids without new transmission corridors. For many cooperatives, slipstreaming a 1 MW Kaplan unit into a flood-control structure offsets diesel peaker rentals. The segment enhances the nationwide US hydropower market while leaving aggregate capacity largely unchanged.
Investor interest coalesces around portfolios of 1–5 MW run-of-river stations where identical control packages cut O&M labor. Because drone inspections and plug-and-play governors reduce visit frequency, owners can supervise dozens of micro-plants from a single control center. This scale-via-software model elevates the internal rate of return despite modest nameplates, and it embodies the sector’s pivot from greenfield dams to digital optimization.


By Technology: Reservoir Plants Dominate While Pumped-Storage Adds Services, Not Megawatts
Reservoir-based schemes deliver 68.30% of installed megawatts yet face the strictest ecological scrutiny, limiting uprate potential to turbine-only changes. Even so, efficiency kits that cut cavitation raise annual energy yield by several percentage points, a valuable gain when new reservoirs are politically untenable. Pumped-Storage grows at 2.3% CAGR, propelled less by fresh projects and more by schedule extensions and round-trip-efficiency tweaks. The technology’s revenue now hinges on dispatch services: black-start, inertia, and fast frequency response that grid codes increasingly reward.
Run-of-River plants, though small in capacity, see higher utilization after adding battery banks that smooth daily flow variability. In-stream and micro-conduit devices remain experimental but benefit from scaling lessons learned in European riverines. Together, these technology slices illustrate how the US hydropower market gains flexibility and resiliency without materially altering cumulative megawatts.
By End-User: Utilities Retain Control While IPPs Chase Niche Upgrades
State and Public Utilities own 72.60% of capacity, reflecting New Deal infrastructure such as Bonneville and TVA networks. Political sensitivities make outright privatization rare, so efficiency grants flow directly to agency budgets. Independent Power Producers, though small, outpace the market at 3% CAGR by aggregating minor assets shed by industrial owners. Acquisitions such as CDPQ’s USD 10 billion Innergex deal bundle hydro with wind and solar PPAs, offering investors blended cash-flow resilience.
Industrial and captive users continue modest turbine-house refurbishments that lower process energy intensity. For example, pulp-and-paper mills replace fixed-blade Francis runners with adjustable units, squeezing more kilowatt-hours from the same head to power digesters. Across owner classes, the narrative holds: modernization eclipses megawatt growth, framing the US hydropower market as an efficiency play.

Geography Analysis
The West commands 36.70% of installed hydro and benefits from huge multipurpose reservoirs that already host fish ladders and transmission corridors. Output rebounded to 125.1 billion kWh in 2025 after a wetter winter boosted head levels, illustrating how hydrology can swing annual generation even when capacity is static. Bonneville Power Administration’s 2025 upgrade plan adds dynamic-line-rating sensors, letting operators transfer surplus Northern Cascades energy to Southern California when solar ramps down.
The Southwest posts the highest 5.35% CAGR, albeit from a low base, as Arizona and New Mexico pursue pumped-storage to buffer solar curtailments. Federal drought-mitigation funds finance dam crest raises that also increase effective head, so energy gains ride on safety budgets rather than capacity constructs. Yet strict groundwater compacts limit new reservoir licensing, so most projects involve deepened tailraces or variable-speed pump-turbines fitted within existing impoundments.
In the Southeast, coal retirements unlock transmission capacity that utilities use to re-rate hydro peakers. Duke Energy’s Bad Creek doubling showcases rare physical expansion, but widespread activity centers on rewinding generators and adding harmonic filters to meet updated grid codes.
The Midwest and Northeast focus on relicensing over the next decade; more than 400 dams must file by 2033, prompting pre-emptive fish-passage upgrades and gate actuator replacements. These projects sustain regional labor and equipment demand without notably shifting the national megawatt tally, yet they incrementally raise dependable capacity, reinforcing the US hydropower market’s reliability value.
Regulatory Landscape
Hydropower regulation in the United States is anchored in the Federal Energy Regulatory Commission (FERC) under the Federal Power Act, with the Integrated Licensing Process (18 CFR Part 5) acting as the default pathway for new and subsequent licenses. Licensing timelines continue to constrain project execution, which has pushed process transparency and schedule tracking further into project planning. In 2026, FERC maintained its national “Pending License, Relicense, and Exemption Applications” database, while Oak Ridge National Laboratory’s HydroSource published a 2026 hydropower relicensing and license surrender dataset that owners use to benchmark schedules and execution risk.
On incentives, federal support increasingly channels capital toward existing-fleet upgrades rather than greenfield dams. The US Department of Energy (DOE) runs the Maintaining and Enhancing Hydroelectricity Incentives program (authorized by EPAct Section 247), offering up to 30% cost-share for eligible capital improvements. DOE began releasing an initial tranche of payments in April 2026 (about USD 53 million) across a large set of upgrade projects. Separately, Public Law 119-90 adds schedule flexibility by allowing FERC to extend construction commencement deadlines by up to six years for qualifying projects licensed before March 13, 2020, which improves bankability for developments delayed by permitting or market conditions.
Competitive Landscape
Turbine manufacturing is moderately concentrated: Voith, GE Vernova, ANDRITZ, Siemens Energy, and Toshiba together supply just over half of new and replacement runners. Competitive edge now lies in eco-design, such as GE’s aerating Francis unit installed at Dominion’s Saluda plant, which improves dissolved-oxygen levels while lifting efficiency. Emerson’s 2024 purchase of American Governor signals a pivot toward firmware and predictive analytics supremacy; by embedding governor logic into cloud platforms, vendors lock in aftermarket revenues.
Service firms offering turnkey relicensing support—environmental studies, eel ladder engineering, tribal consultations—see rising demand as more plants near license expiry. Meanwhile, IPP consolidation accelerates: Constellation’s USD 26.6 billion Calpine takeover formed a 60 GW clean-energy fleet that pairs nuclear steadiness with hydro flexibility, positioning the firm to bid 24 × 7 supply contracts. Smaller co-ops counter by forming equipment-buying consortia, reducing spare-parts costs, and retaining local control.
White-space innovation centers on hybridization. Battery integrators partner with medium-head dams to shave ramp rates and capture frequency-response payments. Electrolyzer makers co-locate at spillways, turning excess spring runoff into green hydrogen. These ancillary markets reward operational ingenuity rather than concrete volume, keeping the US hydropower market attractive to technology specialists even when megawatt growth is sluggish.
United States Hydropower Industry Leaders
U.S. Army Corps of Engineers (operated by BPA & others)
Tennessee Valley Authority (TVA)
Brookfield Renewable US
Duke Energy Corporation
PacifiCorp
- *Disclaimer: Major Players sorted in no particular order

Market Opportunities and Future Outlook
The clearest whitespace is modernization and uprates that raise dependable output and ancillary-service value without expanding river footprints. DOE’s Section 247 incentives create a near-term demand pool for turbines, generators, control and automation, and balance-of-plant upgrades; DOE restarted negotiations for more than USD 430 million in payments to 212 facilities in April 2026 and began distributing an initial roughly USD 53 million tranche. This funding structure supports vendor opportunities in runner replacement, governor automation, condition monitoring, and digital controls, particularly where owners align work with relicensing needs.
A second opportunity track is pumped-storage development and refurbishment as long-duration storage becomes more central to grid operations. FERC’s January 2026 license issuance for Rye Development’s 1,200 MW Goldendale pumped-storage project in Washington reflects permitting progress for large projects, while FERC’s June 2026 environmental review milestone for the proposed 4 GW Seminoe pumped-storage project in Wyoming indicates an active pipeline even as timelines lengthen. Climate-driven operating constraints also push retrofit demand at major federal assets; in May 2026, the US Bureau of Reclamation released USD 52 million for replacing three turbines at Hoover Dam with wide-head models to preserve generation at lower Lake Mead elevations, reinforcing opportunities for OEMs and contractors focused on retrofit engineering under tighter hydrologic windows.
Recent Industry Developments
- May 2026: The US Bureau of Reclamation released USD 52 million to replace three turbines at Hoover Dam with wide-head models designed to operate across lower Lake Mead elevations. The work supports energy reliability from a flagship federal asset under tighter hydrology constraints, directing capital toward retrofit engineering and OEM refurbishment capability rather than new builds.
- July 2025: Brookfield Renewable and Google signed a hydro framework agreement covering up to 3,000 MW of capacity in the United States. The structure reinforces long-dated demand for dispatchable clean power and supports investment cases for relicensing, overhauls, and performance upgrades across private hydropower fleets.
- December 2024: FERC issued a final rule setting a one-year deadline for Clean Water Act Section 401 water-quality certifications. The rule targets a recurring source of relicensing delay, improving schedule clarity for owners planning refurbishment windows and financiers underwriting hydropower upgrade programs.


Research Methodology Framework and Report Scope
Market Definition and Coverage
For this report, the US hydropower market is defined as the installed hydropower generating capacity operating in the United States, reported in gigawatts (GW), and reflecting utility scale and smaller hydropower assets.
Scope exclusions: We exclude non-hydro renewables and we do not size the market as equipment or services revenue since the core market value here is tracked in installed capacity (GW).
Segmentation Overview
- By Capacity Rating
- Large Hydro (Above 100 MW)
- Medium Hydro (10 to 100 MW)
- Small and Micro Hydro (Below 10 MW)
- By Technology
- Reservoir-Based
- Run-of-River
- Pumped-Storage
- In-Stream and Micro-conduit
- By Component (Qualitative Analysis only)
- Turbines
- Generators
- Control and Automation
- Balance-of-Plant
- By End-User
- Utilities (State and Public)
- Independent Power Producers
- Industrial and Captive
Data Sources, Market Sizing, and Validation
Desk Research
Desk work starts with public capacity and generation context so the installed base can be tied back to real-world system reporting. We referenced sources such as the US Energy Information Administration (EIA), the Federal Energy Regulatory Commission (FERC), and the US Army Corps of Engineers hydropower program pages to understand the operating fleet, licensing flows, and project pipelines.
To cross-check technology and asset characteristics, we also used sources such as the International Renewable Energy Agency (IRENA) statistical tables, National Renewable Energy Laboratory (NREL) publications, and US Geological Survey (USGS) water and hydrology information where it helped explain constraints and upgrade activity. Company filings, investor presentations, and reputable press were used to validate major refurbishments, pumped-storage additions, and retirements, and then news and financials databases and patent databases were selectively used to time announcements and confirm ownership or asset-level changes. The desk source list is illustrative, and many other public documents and datasets were also consulted for data collection, validation, and clarification.
Primary Interviews and Surveys
Primary work focused on validating what is counted as operating capacity versus under-construction or planned assets, and on confirming timing assumptions for relicensing, uprates, and refurbishment-linked capacity changes. We spoke with a mix of utility teams, independent power producers, and engineering and project stakeholders across the United States so the assumptions from desk research could be corrected where they did not match on-the-ground delivery realities.
Distribution of primary research fieldwork respondents
| Company type | Respondent position |
|---|---|
| Top tier: 34% | CXOs: 19% |
| Mid tier: 47% | Functional/Unit leaders: 21% |
| Smaller Players: 19% | Managers: 60% |
Market-Sizing & Forecasting
The core sizing is built from a top-down approach where national installed hydropower capacity is reconstructed using publicly reported capacity baselines, tracked additions, uprates, and retirements, and then reconciled to the study definition in GW. Results are then corroborated with selective bottom-up approximations, such as sampling major project announcements and checking likely net capacity changes by technology type, before totals are finalized.
In the model, a few practical drivers matter more than long variable lists, so we emphasized indicators such as the operating capacity baseline for the US fleet, the pipeline and commissioning timing for pumped-storage projects, license renewal and relicensing schedules, refurbishment and modernization cycles that create small but steady uprates, and drought and water availability signals that can delay delivery (even if they do not change nameplate capacity quickly). Technology mix checks were also applied across reservoir-based, run-of-river, pumped-storage, and in-stream or micro-conduit categories so the forecast stays consistent with how assets are developed and reported.
Forecasting was done using scenario analysis, because capacity growth depends heavily on a limited number of project-level decisions and regulatory timing rather than smooth demand curves. Where gaps existed on exact commissioning dates or net uprate magnitude, we used conservative timing ranges, and then narrowed them using interview feedback and recent project progress reporting.
Data Validation & Update Cycle
Outputs are validated through repeated cross-checks against independent signals, including the reported national capacity baseline, major project milestones, and technology mix consistency over time. If a modeled year shows a sudden jump or drop that cannot be explained by known additions, retirements, or uprates, the input set is rechecked and primary respondents may be re-contacted to confirm whether a project slipped or changed scope.
Before sign-off, the dataset and calculations go through a multi-step review so unit handling (GW), timing, and definitional boundaries stay consistent across the time series. The report is refreshed annually, and interim updates are made when material events occur, such as a large pumped-storage project moving into construction or a major relicensing delay. Right before delivery, a final pass is completed so the numbers reflect the latest public updates available.
Mordor Intelligence's USA Hydropower Market Sizing Compared With Other Published Estimates
Published estimates for US hydropower can look inconsistent because the market is sometimes reported as installed capacity, sometimes as generation output, and sometimes as revenue tied to equipment, services, or new-build activity. Differences also show up when pumped-storage is included in full, treated separately, or partially excluded.
By tracking operating capacity changes asset-by-asset and refreshing timing assumptions from licensing and project progress checks, Mordor Intelligence keeps the 2025 total aligned to installed capacity (GW) rather than mixing it with generation or equipment-spend measures. The spread is also influenced by whether small and micro assets are fully captured, how upgrades are treated (net uprates versus gross replacements), and whether the estimate is updated after major schedule shifts or policy announcements.
Benchmark comparison
| Source | Market Size | Gaps in Research Methodology |
|---|---|---|
| Mordor Intelligence | USD 102.27 B (2025) | |
| Industry Association A | USD 98.60 B (2025) | Often reflects a narrower operating fleet view that can under-count small and micro units and may treat refurbishments as replacements without translating them into net capacity change. |
| Global Consultancy B | USD 107.90 B (2025) | May blend pumped-storage capacity and broader hydro-related infrastructure activity into one total, and can apply optimistic commissioning timing that pulls forward capacity additions. |
Looking across the three values, the main takeaway is that scope and unit choices drive most of the gap, not math differences. When the market is kept strictly in installed capacity and reconciled to observable additions, retirements, and uprates, the result stays traceable to steps that a reader can follow and replicate with the same public signals.


Key Questions Answered in the Report
What is the installed hydropower capacity in the United States as of 2026?
The national fleet stands at 102.72 GW following only marginal year-over-year growth.
How fast is pumped-storage capacity projected to expand through 2031?
Pumped-storage is forecast to register a 2.3% CAGR as grid operators reward long-duration storage services.
Which ownership group is adding assets most rapidly?
Independent Power Producers are advancing at a 3% CAGR by acquiring and modernizing legacy dams.
How are Section 243 incentives shaping plant upgrades?
Direct federal payments that cover up to 30% of project costs are accelerating turbine, generator and governor retrofits at 46 facilities.
Why do corporate 24 × 7 clean-energy contracts favor hydropower?
Dispatchable, weather-independent output enables utilities to meet round-the-clock commitments without building new dams.
What environmental compliance expense weighs heaviest on modernization budgets?
Fish-passage retrofits cost the sector about USD 240 million each year, steering capital toward efficiency improvements rather than new capacity.
Page last updated on:


 Your data is secure and never sold or shared.


