
Market Overview
| Study Period | 2020 - 2031 |
|---|---|
| Forecast Data Period | 2026 - 2031 |
| Base Year Market Size (2025) | USD 11.71 Billion |
| Market Size (2026) | USD 12.01 Billion |
| Market Size (2031) | USD 14.31 Billion |
| Growth Rate (2026 - 2031) | 3.56 % |
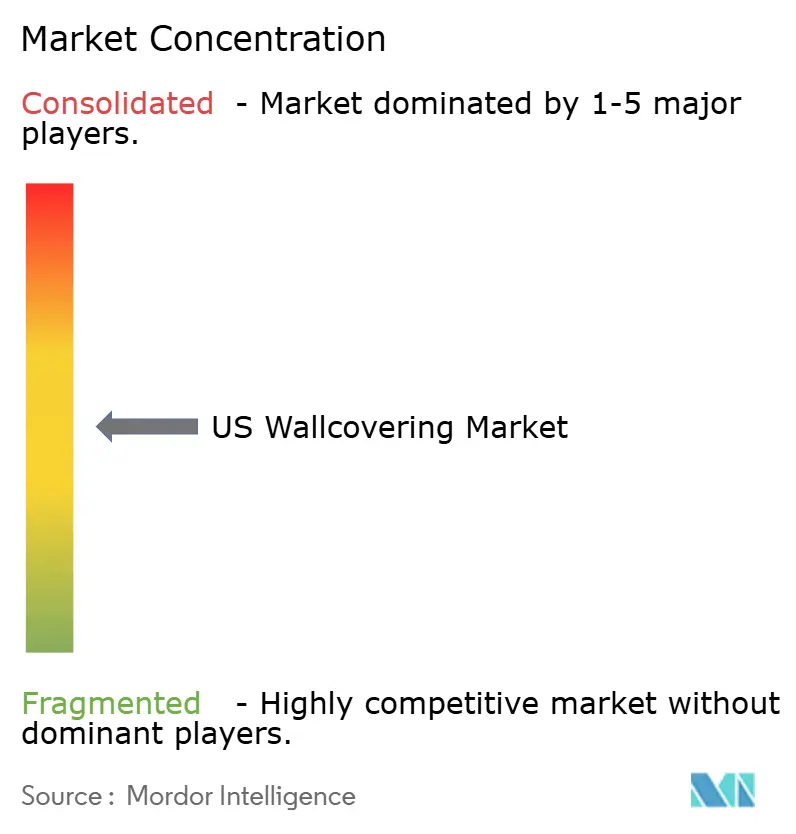
| Market Concentration | Medium |
Major Players *Disclaimer: Major Players sorted in no particular order Image © Mordor Intelligence. Reuse requires attribution under CC BY 4.0. | |
US Wallcovering Market Analysis by Mordor Intelligence
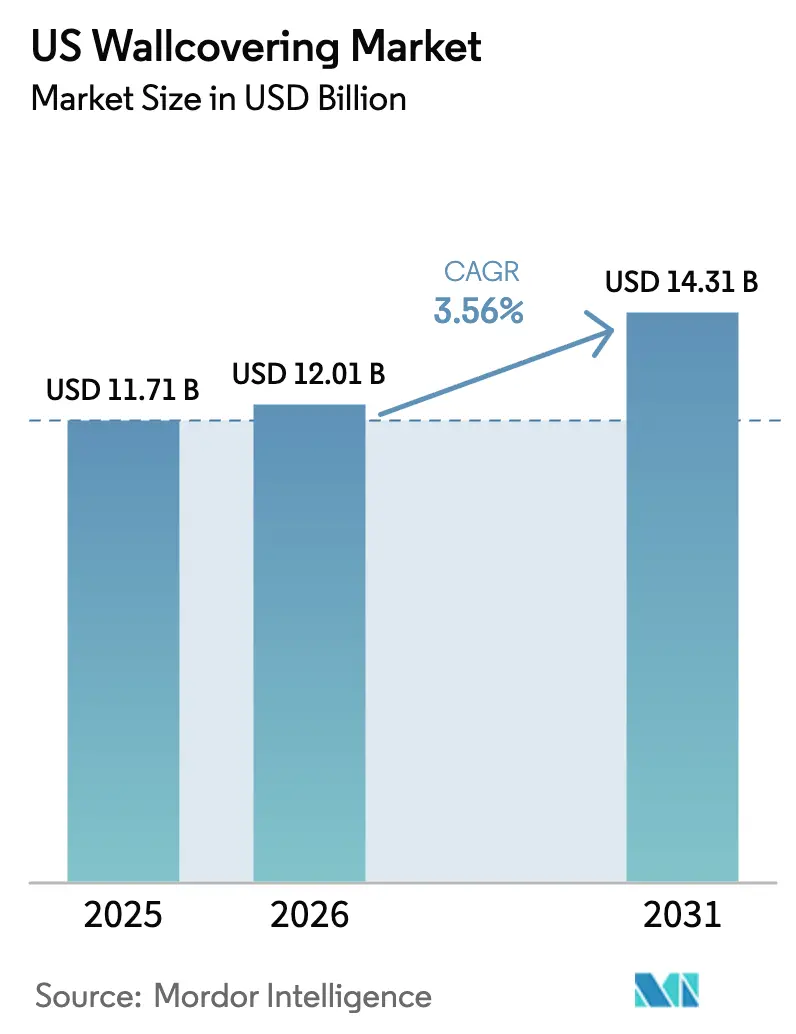
The US wallcovering market size is projected to be USD 11.71 billion in 2025, USD 12.01 billion in 2026, and reach USD 14.31 billion by 2031, growing at a CAGR of 3.56% from 2026 to 2031. Expansion is underpinned by a rebound in residential construction, persistent renovation outlays, and rapid adoption of digitally printed, on-demand products. Total housing starts, which climbed to 1.354 million units in 2024, have regenerated builder confidence, while renovation spending of USD 485 billion has cemented an aftermarket revenue floor. Within this landscape, the US wallcovering market benefits from rising do-it-yourself participation, e-commerce visualization tools, and stricter indoor-air-quality regulations, which position low-VOC substrates as premium propositions. Competitive dynamics remain moderate, paint conglomerates leverage channel breadth and cross-category bundling, whereas specialist brands pursue design exclusivity and fast-cycle customization. Regulatory pressure on volatile organic compound (VOC) emissions and fire performance continues to push material innovation toward non-woven, paper, and textile backings that offer sustainability differentiation without compromising code compliance.
Key Report Takeaways
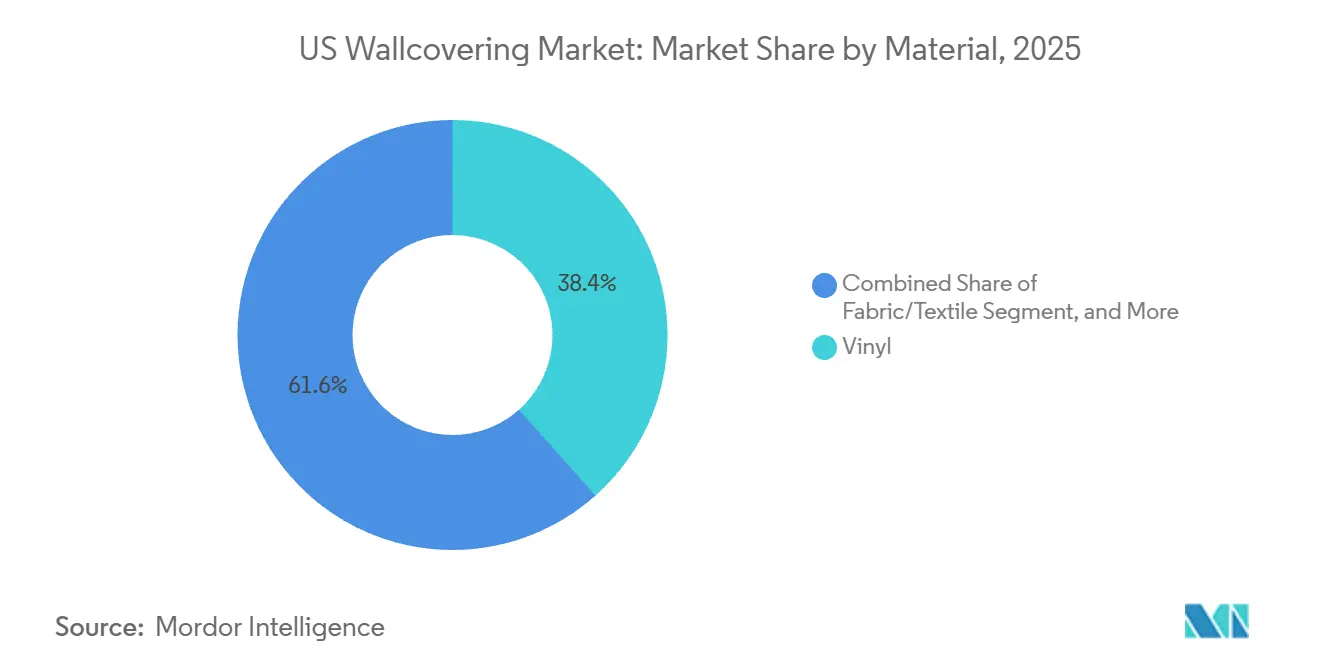
- By material, vinyl commanded 38.43% of the US wallcovering market share in 2025, while fabric and textile wall coverings are forecast to record the fastest 4.43% CAGR through 2031.
- By product type, wallpaper led with 39.32% revenue share in 2025, whereas wall panel sales are projected to expand at a 4.63% CAGR between 2026 and 2031.
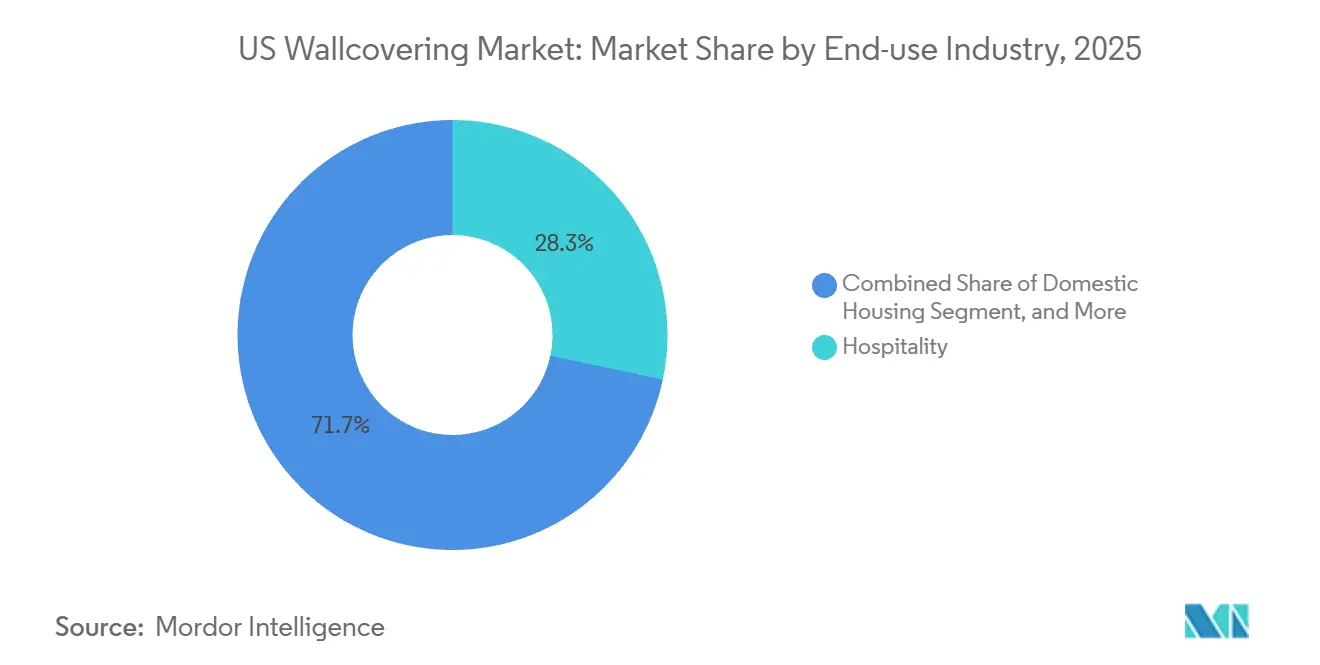
- By end-use industry, hospitality accounted for 28.32% of 2025 revenue, yet domestic housing is set to grow at a market-beating 5.78% CAGR through 2031.
- By distribution channel, specialty stores held a 31.21% share in 2025, and franchise stores are expected to post a 5.21% CAGR over the forecast period.
Note: Market size and forecast figures in this report are generated using Mordor Intelligence’s proprietary estimation framework, updated with the latest available data and insights as of January 2026.
US Wallcovering Market Trends and Insights
Drivers Impact Analysis*
| Driver | (~) % Impact on CAGR Forecast | Geographic Relevance | Impact Timeline |
|---|---|---|---|
| Rebounding Residential Construction Activity | +1.2% | Sun Belt concentration | Medium term (2-4 years) |
| Recovery in Wall Panel Sales Through Renovation Demand | +0.9% | Major metro retrofit corridors | Medium term (2-4 years) |
| Increasing Demand for Digitally Printed Solutions | +0.7% | Coastal urban markets | Short term (≤ 2 years) |
| Preference for Non-woven and Paper-based Wallpapers | +0.5% | Northeast and West Coast | Long term (≥ 4 years) |
| Shift Toward Eco-Friendly Wallcoverings | +0.4% | States with strict VOC rules | Long term (≥ 4 years) |
| Growth of E-commerce Customization Platforms | +0.6% | Suburban millennial clusters | Short term (≤ 2 years) |
| Source: Mordor Intelligence | |||
Rebounding Residential Construction Activity
Single-family housing starts reached 1.026 million units in 2024, an 8.1% annual rise as mortgage rates stabilized below 7% and household formation regained momentum. Builders allocate 2-4% of interior-finish budgets to accent surfaces, creating fresh specification opportunities for the US wallcovering market. Sun Belt states generated 53% of national starts, concentrating distributor and installer activity. Model homes featuring distinctive wallcoverings convert to buyer upgrades in roughly 15-20% of closings, reinforcing aftermarket pull-through. Because installation occurs 12-18 months after permitting, the uplift manifests as a medium-term revenue driver.
Recovery in Wall Panel Sales Through Renovation Demand
Commercial landlords accelerated retrofits in 2025, adopting acoustic wall panels with noise-reduction coefficients of 0.15-0.45 in 30-40% of Class A office upgrades.[1] MDC Wallcoverings, “Acoustic Wall Panel Product Specifications,” mdcwall.com Interlocking panels mount directly over drywall and cut labor hours by up to 50%, a compelling economic advantage for both contractors and do-it-yourself consumers. Retailers such as Home Depot and Lowe’s merchandised DIY-friendly kits, broadening reach into residential spaces. This installation speed, coupled with acoustic gains, underpins the segment’s forecast-leading 4.63% CAGR.
Increasing Demand for Digitally Printed Solutions
Wide-format inkjet systems like Roland DG’s VersaCAMM VS-640i deliver 1,200 dpi output, enabling cost-effective runs as low as 10 linear feet.[2] Roland DG, “VersaCAMM VS Series Product Information,” rolanddg.com E-commerce providers Spoonflower and Wallpops reported 35-40% growth in orders in 2024 as consumers uploaded custom artwork.[3]Spoonflower, “Custom Wallpaper Design Platform,” spoonflower.com On-demand production collapses inventory risk, allowing niche entrants to compete on design rather than scale. Customization regularly commands a 15-25% price premium, buoying revenue in the domestic housing channel and reinforcing the United States wallcovering market’s value proposition against paint.
Preference for Non-woven and Paper-based Wallpapers
Non-woven substrates held roughly 30% share of wallpaper volume in 2025 because their paste-the-wall application trims installation time by up to 30%. Paper-based products certified by the Forest Stewardship Council align with LEED v4.1 low-emitting criteria and contribute to corporate sustainability mandates.[4] Forest Stewardship Council, “FSC Certification Standards,” fsc.org Manufacturers increasingly embed up to 40% post-consumer fiber, signaling a shift toward circular materials. Cost parity with vinyl remains a hurdle, yet tightening VOC regulations and consumer eco-preferences position these substrates for steady adoption through 2031.
Restraints Impact Analysis*
| Restraint | (~) % Impact on CAGR Forecast | Geographic Relevance | Impact Timeline |
|---|---|---|---|
| Strong Competition from Paints and Coatings | -1.4% | Nationwide DIY retail | Medium term (2-4 years) |
| Volatile Raw Material Prices (PVC and Pulp) | -0.8% | Exposure to global commodity cycles | Short term (≤ 2 years) |
| Skilled Labor Shortage for Installation | -0.5% | High-growth metros | Long term (≥ 4 years) |
| Rising Environmental Regulations on VOC Emissions | -0.3% | California and Northeast | Medium term (2-4 years) |
| Supply Chain Disruptions for Specialty Paper | -0.3% | Import-dependent mills | Short term (≤ 2 years) |
| Source: Mordor Intelligence | |||
Strong Competition from Paints and Coatings
Paint captures roughly 85-90% of interior wall-finishing spend, leveraging lower cost, faster application, and wide contractor familiarity. Sherwin-Williams alone posted USD 6.16 billion net sales in its Paint Stores Group for Q3 2024, underscoring the scale differential facing the US wallcovering market. Premium paint lines with texture additives now mimic wallpaper aesthetics, while consumer perception surveys reveal 60-65% of homeowners see wallpaper removal as a hassle. The DIY channel intensifies the threat because a gallon of quality paint covers 350-400 square feet at USD 30-50, versus USD 50-150 per wallpaper roll covering 25-30 square feet.
Volatile Raw Material Prices (PVC and Pulp)
Polyvinyl chloride resin traded between USD 0.52-0.68 per pound during 2024, squeezing margins for vinyl manufacturers that rely on PVC for 40-50% of their substrate cost. Paper-based suppliers faced pulp price swings of USD 1,150-1,300 per metric ton in the same period. Larger producers hedge 30-40% of annual volume via forward contracts, but smaller firms lack that leverage, creating competitive bifurcation. When commodity spikes outpace a 90-120-day retail repricing window, gross margin compresses by 200-300 basis points, dampening reinvestment capacity across the US wallcovering market.
*Our forecasts treat driver/restraint impacts as directional, not additive. The impact forecasts reflect baseline growth, mix effects, and variable interactions.
Segment Analysis
By Material: Fabric and Textile Gains on Sustainability Credentials
Fabric and Textile substrates are projected to expand at a 4.43% CAGR, eclipsing overall US wallcovering market growth. In 2025, Vinyl maintained a 38.43% market share lead due to its durability and washability in healthcare corridors, yet its share is eroding under regulatory and recycling pressure. Paper-based products certified by FSC accounted for roughly 20% of volume, thriving in residential spaces despite their moisture sensitivity. Wood veneers, metal foils, and grasscloth together serve less than 10% of demand but capture premium price points that bolster revenue mix.
The segment’s trajectory is reinforced by LEED v4.1 credits and GREENGUARD Gold thresholds that Fabric and Textile options meet without additional treatments. Acoustic damping and tactile differentiation add value in hospitality suites and executive offices. Installation remains the primary hurdle, as seam-matching and paste-the-wall techniques require professional labor, capping DIY penetration but sustaining specialty-contractor margins. Over the forecast period, the United States wallcovering market for Fabric and Textile is expected to gain a growing share of high-value projects, even as Vinyl maintains volume supremacy in price-sensitive environments.


By Product Type: Wall Panels Leverage Installation Speed
Wall Panels headline growth at a 4.63% CAGR through 2031, driven by acoustic performance mandates and DIY-friendly systems. Wallpaper nonetheless anchored 39.32% of 2025 revenue, a testament to its pattern versatility in both hospitality and domestic accent walls. Tile and Metal wall coverings address niche demands in commercial kitchens and design-statement lobbies, respectively.
Interlocking panel kits reduce labor hours by nearly half compared to traditional hanging, trimming installed cost and accelerating project timelines. Acoustic cores with fabric or printed facings satisfy open-office retrofits that seek noise mitigation without constructing hard partitions. Meanwhile, Wallpaper’s integration with digital printing has refreshed pattern diversity, allowing on-demand production of limited runs and murals. The United States wallcovering market size tied to Wallpaper will therefore persist, yet incremental share gains will skew toward panelized solutions that satisfy cost and speed imperatives.
By End-use Industry: Domestic Housing Surges on DIY Platforms
Domestic Housing is forecast to grow at a robust 5.78% CAGR, catalyzed by peel-and-stick technologies and visualization apps that lower the skill threshold for millennial and Gen Z homeowners. In contrast, Hospitality held the largest share, 28.32%, in 2025, as hotel and restaurant refresh cycles rely on Type II vinyl for durability. Healthcare, Retail, Corporate Offices, Education, and Industrial Facilities round out demand, each with specific performance criteria such as antimicrobial coatings or chemical resistance.
Peel-and-stick lines from Wallpops, Tempaper, and Rust-Oleum enable damage-free removal, redefining wallpaper from a permanent investment to a short-cycle design element. Hospitality’s 5-7-year renovation rhythm sustains baseline volume, while healthcare procurement is expanding adoption of silver-ion antimicrobial technology to curb hospital-acquired infections. As DIY platforms scale, the US wallcovering market share for Domestic Housing will widen, yet Hospitality will continue to deliver the highest absolute square-footage consumption.
By Distribution Channel: Franchise Stores Capture Mid-Market Renovators
Specialty Stores secured 31.21% of 2025 revenue with curated assortments, in-home consultations, and installer referrals. Franchise Stores, including Sherwin-Williams’ company-operated network and Benjamin Moore’s independent retailers, are projected to advance at a 5.21% CAGR by pairing brand recognition with neighborhood proximity. E-commerce accounted for roughly one-quarter of 2025 sales, driven by augmented-reality tools from Wizart that let users overlay patterns onto room photos.
Hybrid fulfillment models, such as buy online, pick up in store, mitigate color-matching uncertainty and shorten lead times. For manufacturers, omnichannel integration, harmonizing digital discovery, sample logistics, and professional installation, has emerged as a parity mandate. Successful execution determines exposure to the growing US wallcovering market size in millennial home-renovation cycles.
Geography Analysis
Regional variation inside the United States shapes both demand clusters and product preference. Sun Belt states, Texas, Florida, Arizona, and North Carolina, collectively delivered more than half of all 2024 single-family starts. This construction density concentration brings wholesale distributors and certified installers together, lowering logistics costs and boosting inventory turns. Conversely, the Northeast exhibits the highest penetration of non-woven and paper-based products due to stronger environmental preferences and tighter indoor air-quality codes.
West Coast metros such as Los Angeles, San Francisco, and Seattle display above-average adoption of digitally printed, custom murals, supported by design-centric consumer bases and innovative hospitality projects. Midwestern states remain price-sensitive, favoring durable vinyl wallpapers in healthcare corridors and educational facilities. Rural markets lag in specialty-store coverage, making big-box retailers and franchise paint outlets the primary access points.
E-commerce plays an outsized role in remote geographies where showroom access is limited. However, color fidelity concerns and tactile evaluation needs challenge pure online conversion rates, prompting retailers to expand loaner-sample programs. Freight cost surcharges on rigid panels inhibit penetration in Alaska and Hawaii, whereas peel-and-stick wallpaper ships economically under parcel rates. These logistical nuances underscore how geography modulates the US wallcovering market’s growth vectors at the metro level.
Regulatory Landscape
Regulation affecting wallcoverings in the United States is shaped by indoor air quality and emissions controls for both materials and production. Printing and converting operations that use certain wide-web flexographic or rotogravure processes fall under EPA air-emissions requirements, including 40 CFR 63.825, which is pushing commercial wallcovering production toward low-emission inks, coatings, and control technologies.
On the sustainability and compliance side, extended producer responsibility (EPR) packaging laws are expanding administrative obligations across seven states (California, Colorado, Maine, Maryland, Minnesota, Oregon, and Washington). Trade association guidance highlighted May 31, 2026 as a major reporting deadline in several EPR states, which increases pressure on manufacturers, printers, and converters to provide SKU-level material and source data to customers and brand owners. Import policy is another variable, with the February 2026 U.S. tariff overview reinforcing that some wallcovering classifications can carry a general duty rate of free, but origin-specific additional duties and temporary surcharges can still affect landed costs for substrates and finished goods.
Value Chain Analysis
The US wallcovering value chain begins with upstream inputs such as PVC resins and additives for vinyl, pulp and specialty papers for paper-backed products, textiles for fabric wallcoverings, and inks, coatings, and adhesives that support durability and compliance attributes. These inputs feed into manufacturing and converting steps, including coating, lamination, embossing, and printing. Production is commonly split between rotogravure and flexographic lines for scale runs and grand-format digital printing for short-run and custom work.
Downstream, products reach market through a mix of specialty showrooms, franchise paint-store networks, big-box retailers, and e-commerce platforms that increasingly depend on sample logistics and room-visualization tools. Standards and labor capability are anchored by the Wallcoverings Association (Chicago, Illinois) and the Wallcovering Installers Association (Elmsford, New York), and installation capacity remains a key friction point for higher-end and commercial projects. That makes coordination among manufacturers, distributors, and installer networks a practical differentiator.
Competitive Landscape
The market is moderately fragmented. Paint conglomerates such as Sherwin-Williams and PPG leverage architectural-coating footprints to cross-sell wallcoverings, bundling finish schedules for contractors and project specifiers. Sherwin-Williams’ USD 3.6 billion acquisition of Sika AG’s North American distribution network in 2024 expanded its contractor branches by 400 locations, illustrating its channel-reach strategy. PPG added low-VOC adhesive capacity through a USD 150 million plant upgrade in Delaware, aligning production assets with environmental demand.
Specialist manufacturers, notably York Wallcoverings and Brewster Home Fashions, differentiate through celebrity collaborations and direct-to-consumer customization portals. York’s “Design Studio” enables pattern, color, and scale tweaks delivered within 10 days. Digital-native disruptors like Spoonflower capitalize on user-generated content, printing one-of-a-kind murals that circumvent wholesale distribution. Technology partnerships, including Wizart’s augmented-reality plug-in for retailer sites, have become table stakes for younger buyers who research entirely online.
Consolidation is expected to continue as scale players acquire digital specialists to capture millennial segments and backfill design agility. At the same time, niche firms will defend high-margin niches through superior artistry, limited-edition drops, and eco-innovations such as recycled-fiber backings. The overall competitive narrative suggests a gradual tilt toward omnichannel ecosystems that marry convenience, customization, and environmental assurance, propelling the US wallcovering market toward its forecast value ceiling.
US Wallcovering Industry Leaders
F. Schumacher & Co.
Crossville Inc.
York Wallcoverings Inc.
Benjamin Moore & Co.
Brewster Home Fashions
- *Disclaimer: Major Players sorted in no particular order

Market Opportunities and Future Outlook
A primary opportunity is scaling customization and speed-to-ship offerings that compete with paint on convenience while keeping design differentiation. On-demand and digitally printed wallcoverings already show pull-through, supported by platforms such as Spoonflower and Wallpops reporting strong order growth in 2024, along with wide-format inkjet systems that enable economical short runs. This combination creates room for manufacturers and retailers to pair rapid-turn digital production with omnichannel sampling and visualization, expanding use beyond residential accent walls into hospitality refreshes where specifiers seek property-specific designs.
Compliance-driven product development also supports premiumization in low-emission and sustainability-aligned wallcoverings and installation systems. Stricter VOC and indoor air-quality expectations, alongside EPA emissions requirements that influence printing and converting practices (40 CFR 63.825), support broader adoption of water-based inks, low-VOC adhesives, and certified substrates used for LEED-aligned projects. The expansion of state EPR packaging compliance activity, highlighted by multi-state reporting deadlines in May 2026, further raises demand for traceable material disclosures and packaging data from wallcovering suppliers, favoring producers that can operationalize SKU-level reporting, transparent sourcing, and recycling-oriented material choices without sacrificing commercial-grade performance.
Recent Industry Developments
- July 2026: Plans were unveiled to open two new showrooms and design shops in Jacksonville and West Palm Beach, Florida, with openings scheduled for September 2026. The expansion improves direct access to trade customers across the Sun Belt and supports higher-touch specification of premium wallcoverings and coordinated textiles.
- December 2025: A showroom and design shop opened in the Charleston Design District, expanding the designer-facing distribution model. This increases in-person sampling and specification velocity for wallcoverings in the Southeast.
- March 2024: Industrial Opportunity Partners announced support for the combination of Brewster Home Fashions and York Wallcoverings under a single ownership platform. The integration strengthens scale across manufacturing and distribution, helping the combined group compete across mass-market retail, specialty trade, and contract channels.


Research Methodology Framework and Report Scope
Market Definition and Coverage
For this study, the US wallcovering market includes revenue earned from selling wallcovering products used to finish interior walls in the United States, across residential and non-residential buildings.
Scope exclusions: We exclude labor-only installation services and broader wall decor items that are not sold as wallcovering products.
Segmentation Overview
- By Material
- Paper-Based
- Fabric/Textile
- Wood-Based
- Vinyl
- Other Materials
- By Product Type
- Wall Panel
- Wallpaper
- Vinyl Wallpaper
- Non-woven Wallpaper
- Paper-based Wallpaper
- Fabric Wallpaper
- Other Wallpaper Types
- Tile
- Metal Wall Covering
- Other Product Types
- By End-use Industry
- Hospitality
- Healthcare
- Retail
- Corporate Offices
- Education
- Domestic Housing
- Industrial Facilities
- Other End-use Industries
- By Distribution Channel
- Specialty Store
- Franchise store
- E-commerce
- Other Distribution Channels
Data Sources, Market Sizing, and Validation
Desk Research
Desk research was used to build the basic demand and supply story and to set guardrails for the model inputs before talking to industry participants. We reviewed public construction and renovation indicators and then mapped them to how wallcovering demand typically moves across housing starts, remodeling spend, and commercial fit-out cycles.
Sources used included public and official datasets such as US Census Bureau construction and housing series, Bureau of Economic Analysis construction spending categories, Bureau of Labor Statistics inflation and producer price trends, and US International Trade Commission trade classifications where relevant for imported wallcovering materials. We also reviewed trade association publications and standards documents, including ASTM International, along with company filings, investor materials, and reputable press coverage, to understand product mix and channel shifts. Where needed, paid subscriptions for company financials and shipment-level import and export checks were used to validate directional shares and pricing movement. The sources listed here are illustrative, and many other references were used for data collection, validation, and research clarification.
Primary Interviews and Surveys
Primary work focused on validating what is actually specified and purchased in the US, and how pricing and mix are changing across product types and end uses. We spoke with manufacturers, distributors, installers, specifiers, and procurement stakeholders to test assumptions on replacement cycles, channel margins, and the share of projects using higher value wall panels versus traditional wallpaper.
For a US-only market, coverage was balanced across major construction and renovation pockets, and across residential and commercial buying behavior, so the model did not over-weight one customer group.
Distribution of primary research fieldwork respondents
| Company type | Respondent position |
|---|---|
| Top tier: 38% | CXOs: 17% |
| Mid tier: 41% | Functional/Unit leaders: 41% |
| Smaller Players: 21% | Managers: 42% |
Market-Sizing & Forecasting
Sizing started with a top-down build that reconstructs the demand pool from US building activity and interior finish intensity, which are then converted into wallcovering spend using usage rates and value per installed area assumptions. Once that total was formed, it was cross-checked with selective bottom-up approximations, such as sampled price per roll or per panel multiplied by observed volume ranges from channel checks, followed by sanity checks against supplier revenue ranges where disclosure allowed.
Key inputs used in the model included housing starts and completions, remodeling and repair spending, commercial construction and tenant improvement signals, product mix shifts between wallpaper, wall panels, tiles, and metal wall coverings, and price movement captured through inflation and material cost direction. Because adoption can swing by end use, project mix across domestic housing, hospitality, offices, healthcare, and education was also tracked and adjusted, and gaps were handled by using proxy shares from similar building categories and then re-tested during interviews.
Forecasts were built using scenario analysis, where base case construction and renovation trajectories were translated into volume and price paths, and then aligned to expert expectations on specification trends and channel growth. Where short-term volatility appeared, smoothing was applied so one unusual year did not distort the multi-year curve.
Data Validation & Update Cycle
Outputs were validated through multiple checks, including comparing implied spend per project against typical interior finish budgets, testing year-to-year price movement against inflation measures, and reviewing whether trade and supply signals moved in a consistent direction. When variances showed up, we traced the drivers back to specific assumptions (mix, pricing, or activity levels), then corrected the inputs and re-ran the model.
Before sign-off, the work goes through step-by-step analyst review, followed by a final pass to confirm that assumptions are still current and internally consistent. Reports are refreshed annually, and interim updates are done when material events change pricing, construction activity, or channel dynamics, so the market view stays timely for buyers.
Mordor Intelligence's US Wallcovering Market Size Measured Against Other Published Estimates
Published market sizes for US wallcovering can look far apart because each source draws the boundary of what counts as wallcovering in its own way, then prices the mix differently. The year chosen as the base, the treatment of channels, and how aggressive the construction outlook is can also shift the final number.
The table highlights the spread that comes from scope and pricing logic. Some estimates lean toward wallpaper-only definitions or rely heavily on import and export values, while others roll adjacent wall decor categories into the total, which inflates the number when panels and decorative systems are broadly classified.
Benchmark comparison
| Source | Market Size | Gaps in Research Methodology |
|---|---|---|
| Mordor Intelligence | USD 11.71 B (2025) | |
| Trade Journal A | USD 0.57 B (2024) | Often closer to wallpaper-only demand, with value anchored to narrower product definitions and shorter-term sales snapshots, which can understate panels, tiles, and higher value commercial specifications. |
| Global Consultancy B | USD 28.40 B (2026) | Typically applies a wider wall coverings umbrella and optimistic construction growth, and it may blend decorative wall systems and installation-related spend into the same revenue pool, which pushes the total upward. |
The table shows a wide range because what gets counted varies more than people expect, and in Mordor Intelligence's model the value is limited to wallcovering product revenues across wallpaper, panels, tiles, and metal wall coverings sold in the United States, without adding labor-only services. With clear activity drivers and practical price and mix checks, the end result stays traceable to construction and renovation demand and is easier to repeat year after year.


Key Questions Answered in the Report
How large is the US wallcovering market in 2026?
The US wallcovering market size reached USD 12.01 billion in 2026 and is forecast to climb to USD 14.31 billion by 2031.
Which product category is expected to grow the fastest through 2031?
Wall Panels are projected to expand at a 4.63% CAGR, outpacing all other product types.
What is driving demand in residential applications?
Peel-and-stick wallpapers, e-commerce visualization tools, and millennial DIY activity together fuel a 5.78% CAGR for Domestic Housing.
Why are non-woven and paper-based wallpapers gaining traction?
They meet low-VOC and sustainability criteria, align with LEED v4.1 credits, and offer easier paste-the-wall installation.
Which distribution channel is forecast to gain share?
Franchise paint stores are expected to post a 5.21% CAGR by pairing local inventory with designer partnerships.
Page last updated on:


 Your data is secure and never sold or shared.


