
United States Wall Covering And Wall Decor Market Size and Share
Market Overview
| Study Period | 2020 - 2031 |
|---|---|
| Forecast Data Period | 2026 - 2031 |
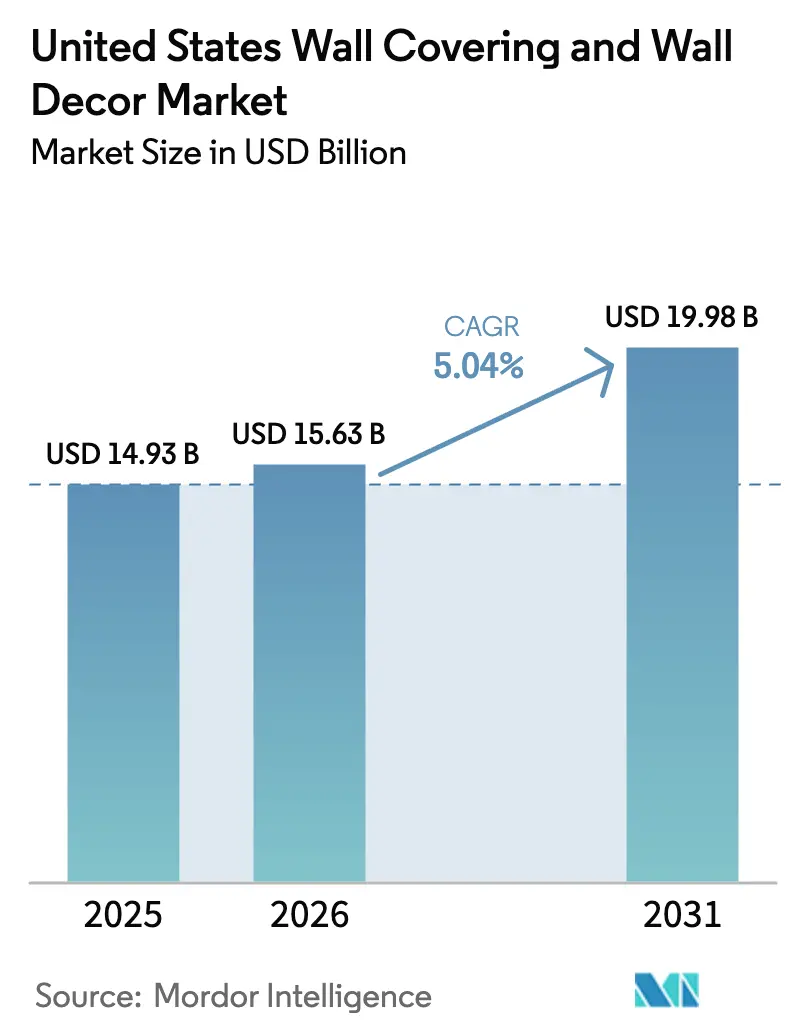
| Base Year Market Size (2025) | USD 14.93 Billion |
| Market Size (2026) | USD 15.63 Billion |
| Market Size (2031) | USD 19.98 Billion |
| Growth Rate (2026 - 2031) | 5.04 % |
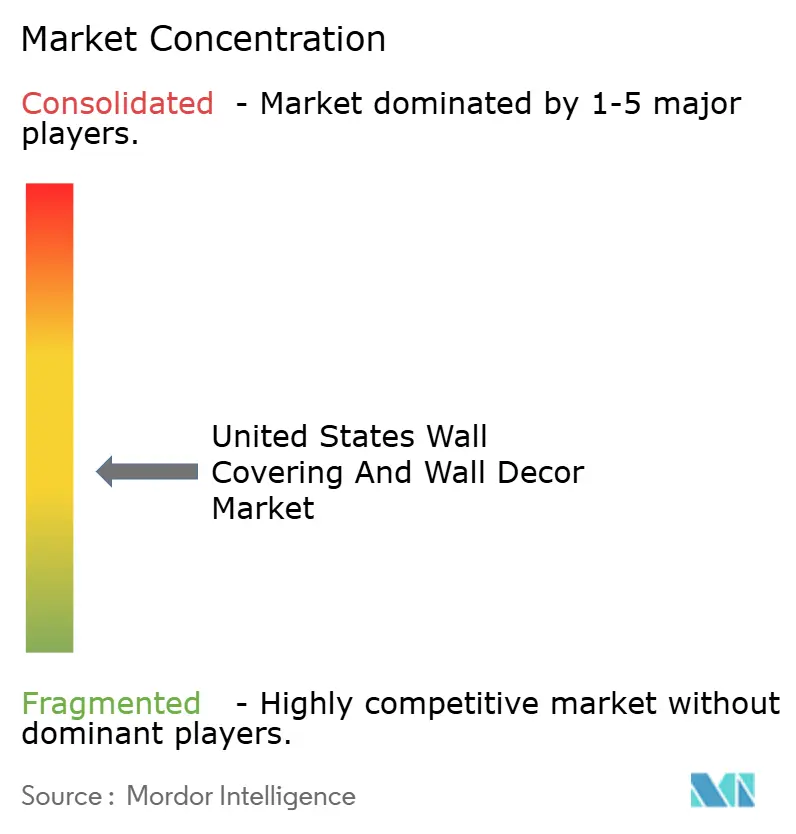
| Market Concentration | Medium |
Major Players *Disclaimer: Major Players sorted in no particular order Image © Mordor Intelligence. Reuse requires attribution under CC BY 4.0. | |
United States Wall Covering And Wall Decor Market Analysis by Mordor Intelligence
The United States wall covering and wall decor market size is expected to increase from USD 14.93 billion in 2025 to USD 15.63 billion in 2026 and reach USD 19.98 billion by 2031, growing at a CAGR of 5.04% over 2026-2031. Momentum stems from robust residential construction, rising e-commerce penetration, and shorter interior refresh cycles that favor renter-friendly, peel-and-stick formats. Vinyl wallpaper continues to dominate commercial specifications, yet digital printing is broadening design choices and lowering minimum order quantities. Tariff-driven input cost inflation and a widening labor gap among installers temper volume growth but also accelerate the shift toward do-it-yourself products. These forces collectively keep the United States wall covering and wall decor market on a steady growth trajectory amid high competitive rivalry.
Key Report Takeaways
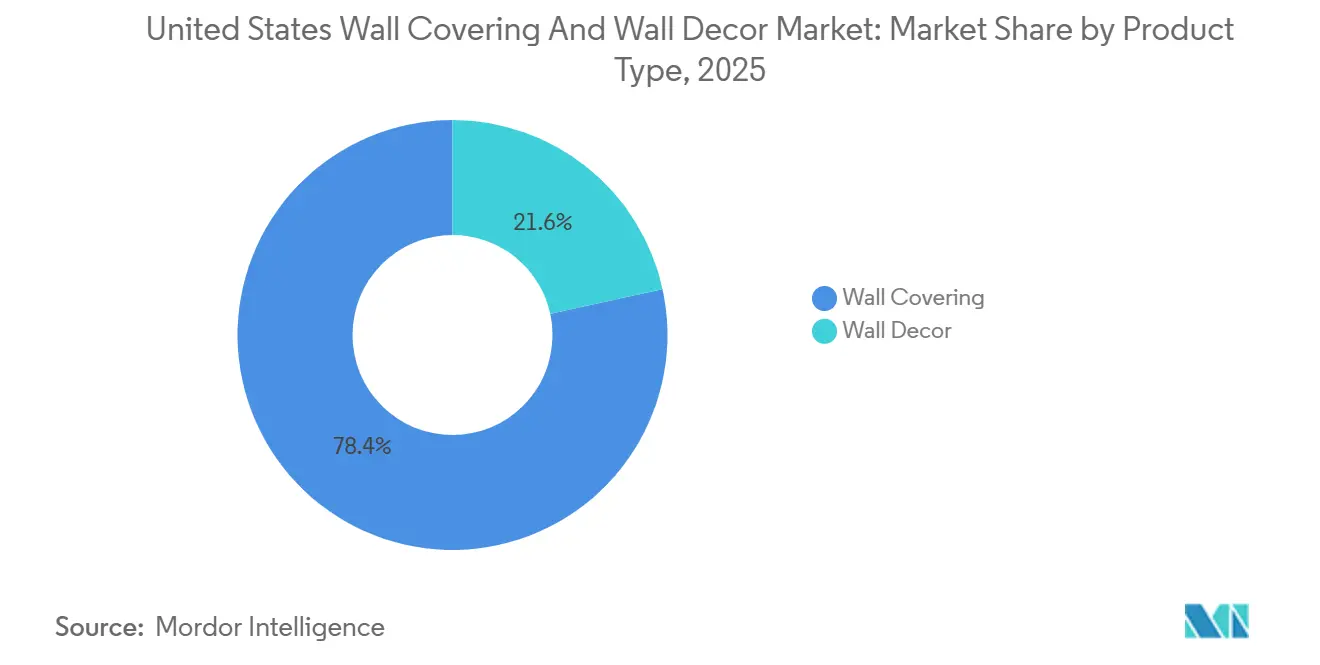
- By product type, wall covering led with 78.42% revenue share in 2025, while wall decor is projected to expand at a 6.42% CAGR through 2031.
- By material, vinyl retained 38.43% of the United States wall covering and wall decor market share in 2025, whereas metal wall coverings are forecast to grow at a 6.64% CAGR to 2031.
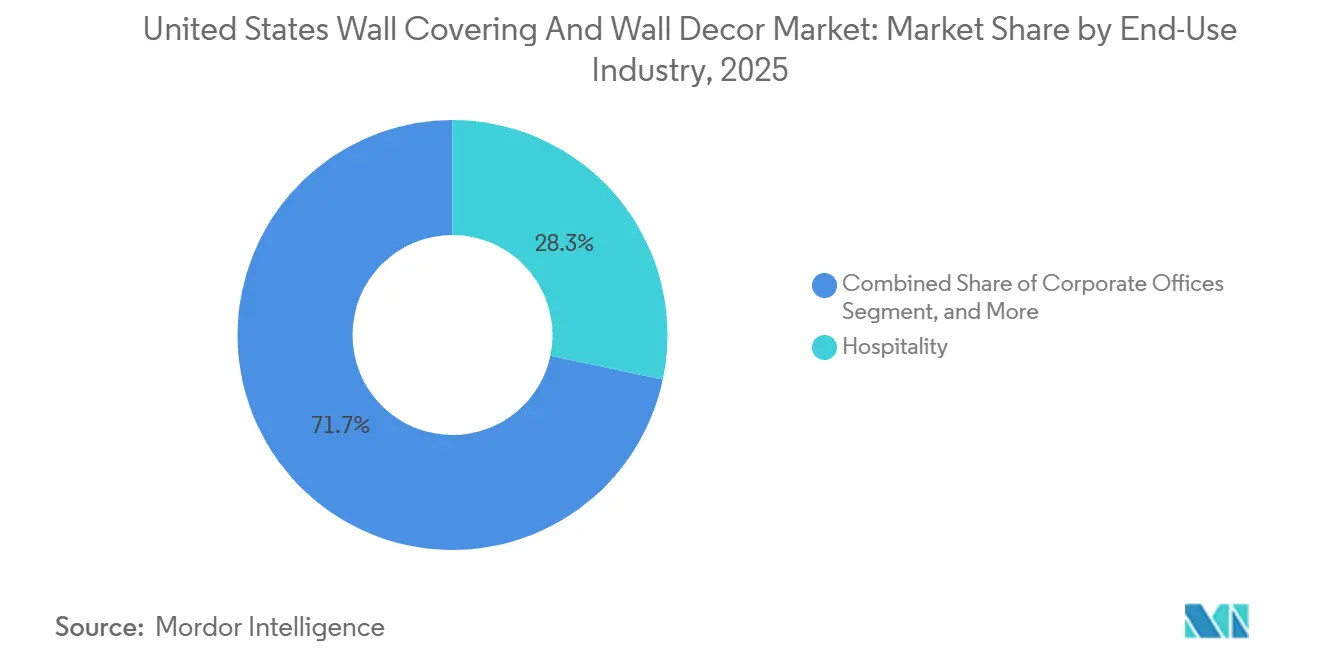
- By end-use industry, hospitality captured 28.32% revenue share in 2025, yet domestic housing is expected to register a 7.38% CAGR over 2026-2031.
- By distribution channel, specialty stores accounted for 31.21% of 2025 sales, while e-commerce is anticipated to post the fastest 7.52% CAGR through 2031.
Note: Market size and forecast figures in this report are generated using Mordor Intelligence’s proprietary estimation framework, updated with the latest available data and insights as of January 2026.
United States Wall Covering And Wall Decor Market Trends and Insights
Drivers Impact Analysis*
| Driver | (~) % Impact on CAGR Forecast | Geographic Relevance | Impact Timeline |
|---|---|---|---|
| Rebounding Residential Construction Activity | +1.2% | Sun Belt metros and national spillover | Medium term (2-4 years) |
| Growing Demand for Digitally Printed Solutions and Online Procurement of Wall Arts | +0.9% | Urban centers and coastal markets | Short term (≤ 2 years) |
| Rising Disposable Incomes and Home Remodeling Spending | +0.8% | Metropolitan statistical areas | Medium term (2-4 years) |
| Surge in Short-Term Rentals Fueling Rapid Refresh Cycles of Interior Aesthetics | +0.7% | Tourism hubs such as New York, Miami, Los Angeles, Nashville | Short term (≤ 2 years) |
| Growth of Peel-and-Stick, Low-VOC Substrates Meeting Renter-Friendly and Sustainability Rules | +0.6% | California and Northeast leadership, national diffusion | Medium term (2-4 years) |
| Integration of Antimicrobial and Acoustic Functionalities into Wall Coverings for Post-Pandemic Healthy Buildings | +0.5% | Healthcare and office projects in major metros | Long term (≥ 4 years) |
| Source: Mordor Intelligence | |||
Rebounding Residential Construction Activity
Housing starts climbed to 1.43 million units in 2025, an uptick that is filtering into finish-material demand as projects move from framing to interiors.[1]U.S. Census Bureau, “Quarterly E-Commerce Report Q3 2025,” census.gov Single-family construction again dominates but multifamily projects supply concentrated volumes that often specify Type II commercial wallcoverings. Remodel spending touched USD 509 billion in 2025, an incremental lift driven by equity-rich homeowners reinvesting in properties. Sun Belt states add extra momentum through favorable migration and employment patterns. The United States wall covering and wall decor market therefore scales with housing completions, making construction starts a leading indicator of unit shipments.
Growing Demand for Digitally Printed Solutions and Online Procurement of Wall Arts
Advances in large-format inkjet systems allow brands to print bespoke runs within days, enabling mass customization at consumer-level price points. Wayfair’s USD 2.728 billion domestic revenue in Q3 2025, with 63% of orders placed via mobile, underscores how digital channels redefine purchase behavior.[2]Wayfair Inc., “Q3 2025 Earnings Release,” investor.wayfair.comMobile augmented-reality tools reduce style uncertainty, nudging buyers to higher basket values. Manufacturers able to integrate API-driven ordering portals now reach the long-tail of design preferences that specialty stores struggled to stock. As a result, the United States wall covering and wall decor market finds incremental volume online without widening brick-and-mortar footprints.
Rising Disposable Incomes and Home Remodeling Spending
Median household earnings in large metros still outpace inflation, allowing upper-income homeowners to pursue discretionary upgrades despite macro volatility. Ninety percent of surveyed homeowners in 2024 planned a renovation within 12 months, prioritizing visual impact zones like kitchens and accent walls. Remodeling decisions typically follow mortgage refinancing or equity withdrawal, so higher valuations catalyze spending. Premium wallpapers with non-woven backings appeal to these customers because they pair upscale aesthetics with easier removal at resale. Income-driven projects thus buoy the United States wall covering and wall decor market even as mid-tier budgets tighten.
Surge in Short-Term Rentals Fueling Rapid Refresh Cycles of Interior Aesthetics
Hosts on Airbnb and similar platforms refresh interiors every 18-24 months to retain listing visibility, far shorter than the 5-7-year cycle in owner-occupied homes. Peel-and-stick wallpaper eliminates contractor labor, letting operators respond quickly to shifting décor trends while avoiding damage fees. Occupancy concentrations in New York, Miami, Los Angeles, and Nashville amplify product turnover, making rental density an accurate proxy for local demand. The phenomenon boosts transaction frequency, and because renters favor bold prints to differentiate spaces, average order values tend to rise, further expanding the United States wall covering and wall decor market.
Restraints Impact Analysis*
| Restraint | (~) % Impact on CAGR Forecast | Geographic Relevance | Impact Timeline |
|---|---|---|---|
| Strong Competition from the Paint Segment | -0.8% | Price-sensitive inland and rural markets | Medium term (2-4 years) |
| Impact of Recent Macro-Economic Volatility on Customer Spending | -0.6% | Middle-income households nationwide | Short term (≤ 2 years) |
| US Tariff Expansion on Specialty Pigments and Vinyl Compounds Elevating Input Costs | -0.5% | Import-dependent manufacturers | Short term (≤ 2 years) |
| Skilled Installer Shortage Escalating Total Cost and Delaying Commercial Projects | -0.4% | High-growth Sun Belt metros | Medium term (2-4 years) |
| Source: Mordor Intelligence | |||
Strong Competition from the Paint Segment
Paint maintains dominance in volume terms because it costs roughly one-third of an entry-level wallpaper installation and requires no specialty skills for application. Budget-conscious renovators often opt for a fresh coat over a patterned wallcovering when inflation stretches project budgets. Paint brands have also launched textured finishes and online visualization tools that narrow wallcovering’s aesthetic gap. This rivalry is acutest in rural counties where per-capita income trails coastal averages, creating a steady drag on the United States wall covering and wall decor market.
Impact of Recent Macro-Economic Volatility on Customer Spending
Consumer sentiment dipped in 2025 as credit card delinquencies rose and real wage growth stalled, driving 74-77% of shoppers to trade down across categories. Mid-tier wallcoverings, the traditional mainstay of specialty stores, bore the brunt of spending cuts, whereas premium and budget lines still found buyers at opposite ends of the income spectrum. Retailers with fixed overhead struggled to flex pricing, causing some independents to exit the market. Although e-commerce platforms used algorithmic promotions to cushion the blow, muted discretionary spending keeps near-term volumes below potential in the United States wall covering and wall decor market.
*Our forecasts treat driver/restraint impacts as directional, not additive. The impact forecasts reflect baseline growth, mix effects, and variable interactions.
Segment Analysis
By Product Type: Wall Covering Dominance Masks Decor Velocity
Wall covering held 78.42% of 2025 revenue, anchored by vinyl wallpaper, laminated panels, and ceramic tile that meet stringent durability codes for hospitality and healthcare installations. Wallpaper’s breadth of print libraries and growing availability in low-VOC inks continue to secure repeat specifications for high-traffic spaces. In contrast, wall decor is forecast to expand at a 6.42% CAGR through 2031, propelled by custom canvas art, framed mirrors, and removable decals that appeal to design-savvy renters. E-commerce brands increasingly bundle wall art with visualization apps, lowering decision friction and lifting basket sizes. The United States wall covering and wall decor market thus shows a volume-heavy core segment coupled with a faster-moving ancillary category.
Growth in digital interiors also fuels demand for peel-and-stick murals, allowing homeowners to trial bold motifs without permanent commitment. Hybrid rooms where a statement wall pairs with coordinating artwork illustrate how cross-category sales converge. Suppliers that curate coordinated collections gain share because they simplify style coherence for consumers ordering online. As these bundles proliferate, the United States wall covering and wall decor market tightens the link between covering and decor, increasing total addressable value per project.


By Material: Vinyl’s Installed Base Versus Metal’s Performance Premium
Vinyl represented 38.43% of 2025 material revenue, benefiting from decades of installed base across corridors, guest rooms, and public areas that require scrubbable surfaces. Innovations in phthalate-free plasticizers aim to preserve this leadership while meeting California CDPH 01350 thresholds.[3]California Department of Public Health, “Standard Method 01350,” cdph.ca.govPaper and non-woven substrates gain popularity in residential makeovers where breathability offsets lower abrasion resistance. Metal wall coverings, though a smaller slice today, are forecast to achieve a 6.64% CAGR through 2031 as architects specify copper or aluminum panels with acoustic backings to satisfy WELL v2 sound criteria.
Noise reduction coefficients between 0.75 and 0.95 position products like Symphony panels as turnkey solutions for open-plan offices. Simultaneously, antimicrobial copper tiles demonstrating 99.9% bacterial reduction within two hours expand uptake in hospitals and long-term care. These performance overlays help manufacturers defend margins against paint substitutions and underpin premiumization inside the United States wall covering and wall decor market.
By End-Use Industry: Hospitality’s Base, Housing’s Velocity
Hospitality contributed 28.32% of 2025 revenue as brand standards require décor refreshes every five to seven years, driving steady baseline volume for print-heavy wallcoverings. Luxury and boutique operators increasingly commission bespoke patterns to reinforce experiential positioning, supporting higher per-yard pricing. Domestic housing, however, is projected to record a 7.38% CAGR through 2031, powered by 1.43 million annual housing starts and rising remodeling outlays. Peel-and-stick coverings resonate with renters and first-time buyers who seek quick upgrades with minimal tools.
Short-term rental density amplifies cycle frequency as hosts refresh units to bolster booking algorithms. Developers in multifamily projects apply antimicrobial, low-VOC wallcoverings in amenity areas to meet WELL certification targets, enriching functional demand. As healthy-building mandates proliferate, the United States wall covering and wall decor market captures both aesthetic and performance spend in residential corridors.

By Distribution Channel: Specialty Store Footprint Versus E-Commerce Velocity
Specialty stores maintained 31.21% share in 2025, leveraging showroom sampling and installer referrals critical to large commercial bids. Trade professionals still rely on in-person texture evaluation before approving high-value specifications. E-commerce, forecast to grow at 7.52% CAGR through 2031, captures consumer orders for digitally printed, peel-and-stick designs delivered direct to doorsteps. Wayfair’s 80.1% repeat customer rate exemplifies trust built through free returns and visualization tech.
Manufacturers increasingly adopt hybrid models, opening limited-service pop-ups that direct shoppers to online catalogs for deeper assortments. Direct-to-consumer microsites also flourish, offering batch-level color consistency and custom sizing unavailable in mass retail. Channel blending therefore widens accessibility, solidifying the growth outlook for the United States wall covering and wall decor market.
Geography Analysis
Residential starts cluster in Texas, Florida, Arizona, and North Carolina where pro-business policies, job growth, and inbound migration stoke demand for entry-level vinyl wallpaper. These Sun Belt states account for a rising share of total completions, positioning local distributors to move volume quickly. Coastal metros such as San Francisco, Los Angeles, Boston, and New York apply stringent emission codes, prompting faster adoption of low-VOC, paper, and biobased substrates. Manufacturers often certify national lines to California CDPH 01350 to avoid dual inventories, effectively propagating the standard countrywide.
Urban cores concentrate hospitality pipelines and short-term rentals that refresh interiors more often than owner-occupied homes. High tourist footfall in Miami Beach and Manhattan translates into recurring projects for boutique hotels seeking Instagram-friendly wall treatments. Conversely, inland rural counties remain paint-centric due to lower incomes and higher DIY culture, limiting wallcovering penetration.
E-commerce erodes geographic disparities by shipping nationwide within days, but freight costs and lead times still favor centralized fulfillment hubs near major logistics corridors. As such, Memphis, Atlanta, and Dallas emerge as strategic distribution nodes, enabling faster delivery and reinforcing the competitive position of the United States wall covering and wall decor market across disparate regions.
Regulatory Landscape
US wall covering and wall decor suppliers operate under overlapping indoor-air, chemical safety, and manufacturing-emissions requirements that influence material selection and production processes. EPA air rules for printing operations apply to facilities using rotogravure and wide-web flexographic printing under NESHAP, driving investments in lower-emitting inks and solvent capture under provisions such as 40 CFR 63.825. On the product and installation side, fire and performance testing regimes follow standards such as CCC-W-408D, while the US Consumer Product Safety Commission's 2022 rulemaking deeming hazardous cords on window coverings a Substantial Product Hazard under the Consumer Product Safety Act shapes assortment decisions in bundled wall decor and window treatments.
Value Chain Analysis
The value chain includes raw materials such as paper and non-woven substrates, vinyl compounds, pigments, inks, adhesives, and protective topcoats. Converting and printing typically use gravure, screen, and growing digital inkjet for short runs, followed by finishing steps such as lamination, embossing, anti-microbial coatings, and acoustic backings. In the US, domestic capacity remains more concentrated in high-performance and custom products, while mass-market volume is more dependent on imports, so tariff-driven input cost pressure increases the value of sourcing flexibility for vinyl compounds and pigments.
Downstream, distributors and specialty stores manage sampling workflows that connect architect specifications to orders, while e-commerce and web-to-print portals shorten lead times for peel-and-stick designs. Installation and after-sales services matter for commercial demand, with installer networks such as the Wallcovering Installers Association supporting documentation needs tied to indoor-air and performance standards. Logistics providers are also increasingly consolidating SKUs into jobsite-ready shipments.
Competitive Landscape
No firm controls more than a single-digit revenue share, keeping the market broadly fragmented. Incumbent paint giants Sherwin-Williams and Benjamin Moore leverage contractor networks to cross-sell branded wallpapers, while regional specialists such as York Wallcoverings focus on design archives that appeal to heritage restorations. Disruptors like Tempaper and Chasing Paper exploit peel-and-stick formats, pairing on-demand digital printing with social-media marketing to engage millennial renters.
Manufacturers procure high-speed inkjet presses that scale short-run economics, integrate web-to-print configurators, and link directly with augmented-reality apps. This vertical stack shrinks lead times from weeks to days, an advantage difficult for conventional gravure printers to match. CertainTeed’s Symphony acoustic series satisfies WELL acoustic metrics, while copper-alloy panels from specialized fabricators target infection-control budgets.
Collaborations between substrate suppliers and finish-technology firms accelerate innovation. For instance, antimicrobial coatings jointly developed with chemical giants ensure regulatory compliance without compromising print fidelity. Companies that bundle certification dossiers with product shipments ease architect workload, winning repeat inclusion in master specifications. Given these dynamics, the United States wall covering and wall decor market rewards agile players that marry design agility with validated performance claims.
United States Wall Covering And Wall Decor Industry Leaders
Benjamin Moore & Co.
York Wall Coverings
Crossville Inc. Tile
F. Schumacher & Co.
Brewster Home Fashion LLC
- *Disclaimer: Major Players sorted in no particular order

Market Opportunities and Future Outlook
Material and chemistry innovations are creating whitespace for customers seeking commercial-grade durability with cleaner ingredients and clearer compliance documentation. In Type II vinyl wallcoverings used in hospitality and other high-traffic end uses, Momentum Textiles & Wallcovering introduced Circon in June 2024 as a bio-sourced, carbon-neutral Type II vinyl developed with Versa Designed Surfaces, illustrating a path for suppliers to differentiate beyond print design. Suppliers that pair low-emission substrates, inks, and logistics with bid packages that include indoor-air and ESG checklists also strengthen their position in competitive tenders.
Circularity and infrastructure programs add execution opportunities across wall decor, including packaging, sampling, and returns-heavy e-commerce models. In January 2026, Circular Action Alliance continued scaling extended producer responsibility (EPR) programs and distributed USD 8 million to recycling facilities for upgrades, which supports recycling-system capability that suppliers can align with through redesigned packaging, consolidated shipments, and take-back initiatives. On performance materials, Len-Tex highlighting its North Walpole manufacturing base and Clean Vinyl Technology positioning supports a premium and compliance-led value proposition for commercial buyers balancing durability, indoor-air considerations, and brand sustainability narratives.
Recent Industry Developments
- June 2026: A collaboration between Benjamin Moore and its retail and design partners extends the Color Trends 2026 palette beyond walls, enabling cross-category integration with wallcoverings and decor programs that support cohesive design cycles. This action ties color strategy to wall decor planning and retail execution, expanding opportunities for coordinated merchandising across categories.
- June 2025: Benjamin Moore announced a multi-year home partnership with Williams-Sonoma brands including Pottery Barn, West Elm, and Rejuvenation to curate color palettes and in-store design experiences. The collaboration reinforces omni-channel merchandising links between wall color, wall decor, and broader home furnishings assortments.
- October 2024: A designer-led collection by F. Schumacher & Co. in partnership with Johanna Ortiz spans fabrics, wallcoverings, and trim. The release supports premiumization and faster pattern turnover, aligning with differentiated, digitally discoverable collections.


Research Methodology Framework and Report Scope
Market Definition and Coverage
This market is counted as the value of wall covering and wall decor products sold in the United States for residential and non-residential interiors, covering items that either finish the wall surface or are mounted on the wall for decoration.
Scope exclusions: We exclude on-site labor and installation services, along with general paint and surface preparation materials.
Segmentation Overview
- By Product Type
- Wall Covering
- Wall Panel
- Wallpaper
- Vinyl Wallpaper
- Non-woven Wallpaper
- Paper-based Wallpaper
- Fabric Wallpaper
- Other Wallpaper Types
- Tile
- Metal Wall Covering
- Other Product Types
- Wall Decor
- Wall Art
- Wall Decal
- Wall Frames (Mirrors, etc.)
- Other Wall Decors
- Wall Covering
- By Material
- Paper-Based
- Fabric/Textile
- Wood-Based
- Vinyl
- Metal
- Plastic
- Other Materials
- By End-use Industry
- Hospitality
- Healthcare
- Retail
- Corporate Offices
- Education
- Domestic Housing
- Industrial Facilities
- Other End-use Industries
- By Distribution Channel
- Specialty Store
- Franchise store
- E-commerce
- Other Distribution Channels
Data Sources, Market Sizing, and Validation
Desk Research
Desk research helped us set the basic demand story and the key checkpoints for the US market, before any interview assumptions were applied. We referred to public sources such as US Census Bureau construction and housing data, Bureau of Labor Statistics price indexes, and US International Trade Commission trade statistics to understand renovation cycles, pricing direction, and import exposure. We also used sources such as the American Institute of Architects (for architecture billings signals), and EPA guidance on indoor materials to understand which product shifts were being discussed in the market.
On the supply side, we used annual reports, investor presentations, and reputable industry press to map product mixes and channel emphasis, especially where wall panels, wallpaper, tiles, and wall art overlap at retail. A paid subscription focused on company financials and another one focused on shipment-level import and export records were used selectively to cross-check revenue pools and product flow assumptions. The sources listed above are illustrative, and many other public references were reviewed to collect data, validate it, and clarify open questions.
Primary Interviews and Surveys
Primary interviews and short surveys were used to convert broad signals into usable sizing inputs, which included typical price ranges, channel markups, renovation-driven demand patterns, and mix shifts between covering versus decor. We spoke with manufacturers, distributors, specialty retailers, installers, and commercial specifiers, and then compared feedback across major US regions to reduce single-region bias and to close gaps left by public data.
Distribution of primary research fieldwork respondents
| Company type | Respondent position |
|---|---|
| Top tier: 32% | CXOs: 12% |
| Mid tier: 52% | Functional/Unit leaders: 32% |
| Smaller Players: 16% | Managers: 56% |
Market-Sizing & Forecasting
The core sizing starts with a top-down build that reconstructs the spending pool from US housing activity and commercial fit-out signals, and then filters it into wall covering and wall decor demand using penetration and replacement cycles. After the big pool is built, we corroborate it with selective bottom-up checks such as sampled price points by product type, channel splits from interviews, and supplier revenue ranges where disclosures exist.
Key inputs used in the model included housing starts and remodeling spend direction, the share of renovation versus new build demand, import intensity by material group, price movement seen through relevant inflation and trade indicators, and distribution channel mix between specialty stores, franchise outlets, and e-commerce. For forecasting, scenario analysis was applied around housing turnover and commercial refurbishment timing, and then the final trajectory was aligned to interview consensus on near-term pricing and mix changes (for example, wall panels versus wallpaper, and frames and decals within decor). Where bottom-up checks were incomplete for small local players, the gap was handled using channel-based scaling factors that were tested against trade flow and retail intensity signals.
Data Validation & Update Cycle
Validation was done through multiple passes, where model outputs were compared against independent signals like construction activity direction, import trends, and implied average selling prices by product type. Large variances were flagged, the assumptions behind them were reviewed, and targeted re-contacts were triggered when a mismatch could not be explained by a clear market event.
Before sign-off, a second analyst review is completed to check arithmetic, unit consistency, and whether assumptions still match the latest public releases. Reports are refreshed annually, with interim updates when material events shift housing demand, pricing, or channel behavior. Before delivery, a final pass is done so clients receive the latest updated view.
Mordor Intelligence's US Wall Covering and Wall Decor Market Sizing Compared With Other Published Estimates
Published numbers for this market can look far apart because each publisher draws the product line differently, uses different price points, and refreshes assumptions at different times. The year selected, the currency conversion timing, and how e-commerce versus store sales are treated also tend to move the final value.
Installation services sit outside Mordor Intelligence's scope, so figures that bundle contractor labor with product sales will naturally land higher even if unit volumes are similar. Another gap driver is how wide the decor bucket is, since some estimates pull in broader home accessories that are not wall-mounted, then apply general retail growth rates without checking renovation cycles and channel markups.
Benchmark comparison
| Source | Market Size | Gaps in Research Methodology |
|---|---|---|
| Mordor Intelligence | USD 14.93 B (2025) | |
| Global Consultancy A | USD 28.40 B (2026) | Uses a broader revenue pool that appears to combine product sales with service-led spending and wider decor retail categories, and it is also reported on a different base year which adds inflation and cycle timing effects. |
| Industry Blog B | USD 12.00 B (2023) | Likely reflects a narrower definition closer to wallcoverings only, and it relies on limited public statistics with simple growth projection, which can miss wall decor add-ons and channel mix effects. |
Overall, the spread in published totals is mainly explained by whether labor and broad home accessory items are included, and by how pricing and channels are updated year to year. Using clear product-only boundaries and checking assumptions against housing, trade, and channel signals keeps the final number traceable to repeatable inputs.


Key Questions Answered in the Report
What is the current value of the United States wall covering and wall decor market?
The market is worth USD 15.63 billion in 2026 and is projected to reach USD 19.98 billion by 2031.
Which product category holds the largest share?
Wall covering accounts for 78.42% of total market share in 2025, reflecting its widespread use in commercial and residential projects.
Which channel is growing the fastest?
E-commerce is forecast to expand at a 7.52% CAGR through 2031, boosted by mobile shopping and digital visualization tools.
Why are metal wall coverings gaining traction?
Copper and aluminum panels deliver antimicrobial and acoustic performance that aligns with WELL and infection-control guidelines.
How often do short-term rental hosts update interiors?
Listings typically refresh décor every 18-24 months, far faster than traditional owner-occupied cycles, favoring peel-and-stick solutions.
What is the main restraint on market growth?
Price competition from paint remains a key headwind, especially in cost-sensitive regions and mid-range renovations.
Page last updated on:


 Your data is secure and never sold or shared.


