
Market Overview
| Study Period | 2020 - 2031 |
|---|---|
| Forecast Data Period | 2026 - 2031 |
| Base Year Market Size (2025) | USD 2.98 Billion |
| Market Size (2026) | USD 3.09 Billion |
| Market Size (2031) | USD 3.69 Billion |
| Growth Rate (2026 - 2031) | 3.64 % |
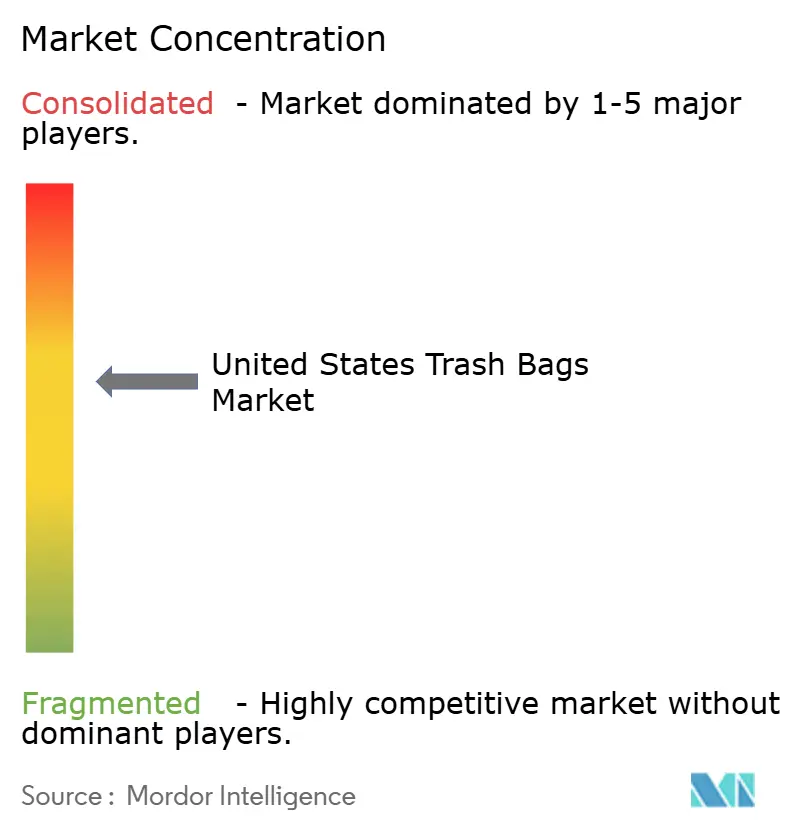
| Market Concentration | Medium |
Major Players *Disclaimer: Major Players sorted in no particular order Image © Mordor Intelligence. Reuse requires attribution under CC BY 4.0. | |
United States Trash Bags Market Analysis by Mordor Intelligence
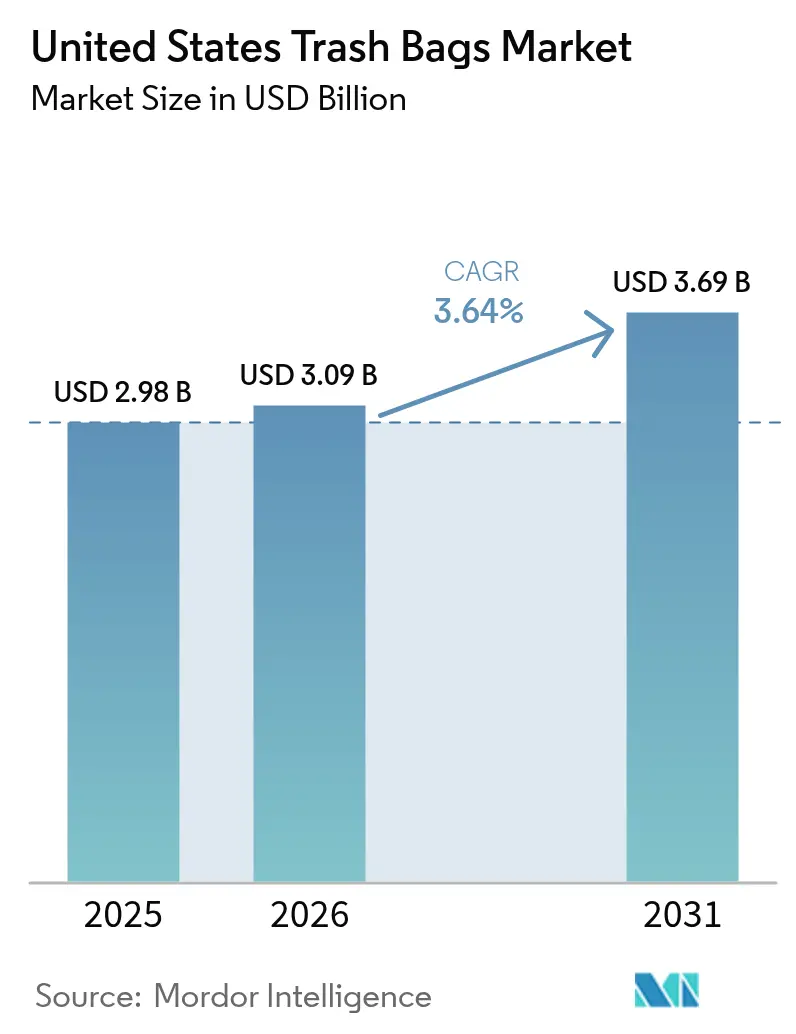
United States trash bags market size in 2026 is estimated at USD 3.09 billion, growing from 2025 value of USD 2.98 billion with 2031 projections showing USD 3.69 billion, growing at 3.64% CAGR over 2026-2031. Waste-segregation mandates from healthcare, foodservice, and municipal sectors are the principal growth engine, while packaging waste-28.1% of the 292.4 million-ton municipal solid waste (MSW) stream in 2024-reinforces steady household and commercial demand.[1] Resin price swings linked to Gulf Coast production constraints add cost volatility, yet material innovation in compostable films and recycled-content polyethylene sustains margin defense. Institutional buyers accelerate adoption of antimicrobial and color-coded containment solutions to comply with Centers for Disease Control and Prevention (CDC) infection-control protocols. Meanwhile, subscription-based e-commerce channels reconfigure procurement patterns, enabling bulk purchasing and automated replenishment for commercial facilities.
Key Report Takeaways
- By material type, Low-Density Polyethylene (LDPE) held 39.85% of the United States trash bags market share in 2025. Bio-based/biodegradable plastics are projected to expand at a 4.52% CAGR through 2031, the fastest growth rate among all materials.
- By capacity, the above-30-gallon segment is advancing at a 4.91% CAGR between 2026 and 2031.
- By end-user, institutional applications are forecast to grow at a 4.74% CAGR, while residential demand retained 64.10% of the United States trash bags market size in 2025.
- By distribution channel, online retail recorded the highest CAGR at 5.05%, in contrast to offline retail’s 54.10% revenue share in 2025.
Note: Market size and forecast figures in this report are generated using Mordor Intelligence’s proprietary estimation framework, updated with the latest available data and insights as of 2026.
Market Trends and Insights
Drivers Impact Analysis of United States Trash Bags Market*
| Driver | (~) % Impact on CAGR Forecast | Geographic Relevance | Impact Timeline |
|---|---|---|---|
| Growing demand for compostable and oxo-biodegradable bags | +0.9% | National, concentrated in CA, OR, WA, VT | Medium term (2-4 years) |
| Rising hygiene and waste-segregation mandates | +0.7% | National, emphasis on healthcare/institutional | Short term (≤ 2 years) |
| E-grocery boom increasing household bag consumption | +0.6% | National, urban concentration | Short term (≤ 2 years) |
| Adoption of antimicrobial additive-infused bags | +0.4% | National, healthcare/foodservice focus | Medium term (2-4 years) |
| State-level EPR nudging thicker recyclable bags | +0.5% | CA, CO, ME, OR, MN, MD | Long term (≥ 4 years) |
| Smart dispenser subscriptions for refill bags | +0.3% | National, commercial facilities | Medium term (2-4 years) |
| Source: Mordor Intelligence | |||
Growing demand for compostable and Oxo-biodegradable bags
Municipal organics diversion mandates create a verified customer base for ASTM D6400-certified liners. Vermont’s Universal Recycling Law, for example, compels businesses that generate more than 26 gallons of food waste weekly to adopt certified compostable containment, while USD 32 million in federal infrastructure grants awarded in 2024 is expanding industrial composting capacity from 185 to a projected 275 facilities by 2027.[2] Despite strong policy pull, polylactic acid (PLA) liners still require ≥ 140 °F industrial composting temperatures and experience moisture sensitivity during transport; laboratory studies show degradation windows ranging from 90 days in optimized facilities to 180 days in less-controlled environments.
Rising hygiene and waste-segregation mandates
CDC infection-control guidance instructs healthcare providers to differentiate general, regulated medical, and pharmaceutical waste streams, prompting purchases of color-coded or antimicrobial bags certified under FDA 21 CFR 178.3297. A 500-bed hospital generates 25–30 pounds of waste per occupied bed each day, 85% of which still falls under “general” MSW, yet cannot commingle with retail refuse due to cross-contamination risk. The Joint Commission requires all 6,090 U.S.-accredited hospitals to document waste-handling protocols, enlarging the addressable institutional volume.
E-grocery boom increasing household bag consumption
E-commerce food sales reached USD 9.3 billion in 2024, and each delivered order introduces 4–7 discrete packaging components into the residential waste stream. Research shows households discard 23–35% more material than in-store shoppers, and 78% place all delivery packaging into conventional trash bags rather than specialized recycling programs. New York City recorded a 12% increase in residential MSW tonnage in direct correlation with on-demand grocery adoption, demonstrating regional intensity in urban markets.
Adoption of antimicrobial additive-infused bags
Silver or copper nanoparticle formulations achieve 99.9% bacterial reduction within 24 hours per ISO 22196 tests, addressing pathogen-control requirements in hospitals and restaurant back-of-house operations. Patent US 11,234,567 codifies a dispersion method that preserves tensile strength, enabling healthcare-compliant films without sacrifice of load-bearing capacity. The National Restaurant Association’s 2024 survey found 67% of establishments prioritize antimicrobial packaging to satisfy revised ServSafe standards.
Restraints Impact Analysis of United States Trash Bags Market*
| Restraint | (~) % Impact on CAGR Forecast | Geographic Relevance | Impact Timeline |
|---|---|---|---|
| Restrictions on single-use plastics | -0.8% | CA, OR, WA, NY, expanding nationally | Short term (≤ 2 years) |
| Volatility in virgin resin prices | -0.5% | National, Gulf Coast production centers | Short term (≤ 2 years) |
| Composting infrastructure curbing conventional bags | -0.4% | Regional, expanding with infrastructure | Medium term (2-4 years) |
| Trash compactors reducing bag consumption | -0.3% | Commercial/industrial facilities | Medium term (2-4 years) |
| Source: Mordor Intelligence | |||
Restrictions on single-use plastics
California’s SB 54 imposes graduated producer fees and market-access limitations that add compliance costs equivalent to 8–12% of product revenue, while 127 plastic regulation bills introduced across 35 states in 2024 indicate broadening policy risk.[3] Producers that fail to meet recycled-content or reduction targets may face shelf-space bans.
Volatility in virgin resin prices
LDPE film-grade prices fluctuated 18–25% per quarter in 2024 as Hurricane Francine temporarily idled six petrochemical complexes, cutting domestic output by 15%. Raw materials account for 65–75% of total manufacturing costs; margin protection, therefore, hinges on dynamic pricing clauses, hedging instruments, or feedstock diversification.
*Our forecasts treat driver/restraint impacts as directional, not additive. The impact forecasts reflect baseline growth, mix effects, and variable interactions.
United States Trash Bags Market Segment Analysis
By Material Type:
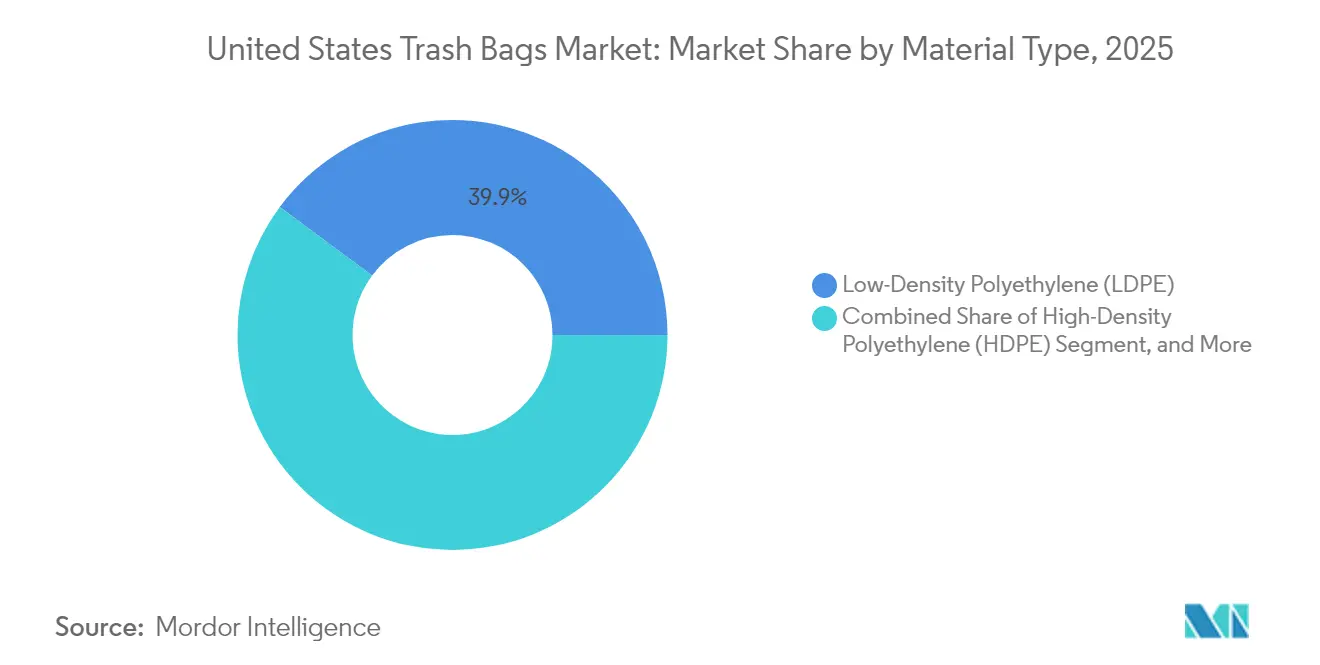
Bio-based Films Gain MomentumLow-Density Polyethylene commanded 39.85% of the United States trash bags market share in 2025, supported by low cost and broad processing infrastructure. Yet bio-based/biodegradable plastics are on track for a 4.52% CAGR, the highest among all materials, propelled by municipal composting mandates. Within this segment, PBAT-PLA blends that meet ASTM D6400 standards can achieve industrial compostability within ninety days and run on existing blown-film lines, mitigating capital outlay for converters. A derivative patent, US 11,456,789, details chain-extending additives that enhance tear resistance to match LDPE. Post-consumer recycled (PCR) polyethylene is another fast-emerging subset because EPR statutes specify minimum PCR thresholds for bags used in curbside programs.
Regulatory oversight guides formulation choices. FDA 21 CFR 174.5 regulates recycled materials in indirect food-contact articles, while ASTM D6400 certification is vital for access to organics diversion tenders. Producers that can combine PCR inclusion and compostability credentials enjoy premium positioning, particularly in California, Oregon, and Vermont, where procurement policies award compliance points for each attribute.

By Capacity/Bag Size:
Large Formats for Commercial EfficiencyThe above-30-gallon category is the fastest-growing band at a 4.91% CAGR, riding on central waste-station designs in hospitals, airports, and educational campuses. Larger liners extend collection intervals and cut janitorial labor by 25-40%, outcomes backed by CDC studies on infection-risk mitigation. Manufacturing these large formats requires multi-layer die heads and tighter gauge-control systems to avoid weak sidewalls; only the top tier of converters now owns such capabilities, reinforcing competitive barriers.
The 13-30-gallon bracket held 38.20% of the United States trash bags market size in 2025, favored for versatility in residential kitchens and commercial restrooms. Up to 3-gallon and 3-13-gallon bags remain niche but indispensable for food-prep zones and biomedical sample transport. Meanwhile, trash-compactor liners in the 2.0-3.0-mil gauge class command higher price points but fewer units sold, slightly diluting overall volume growth for standard gauges.
By End-user:
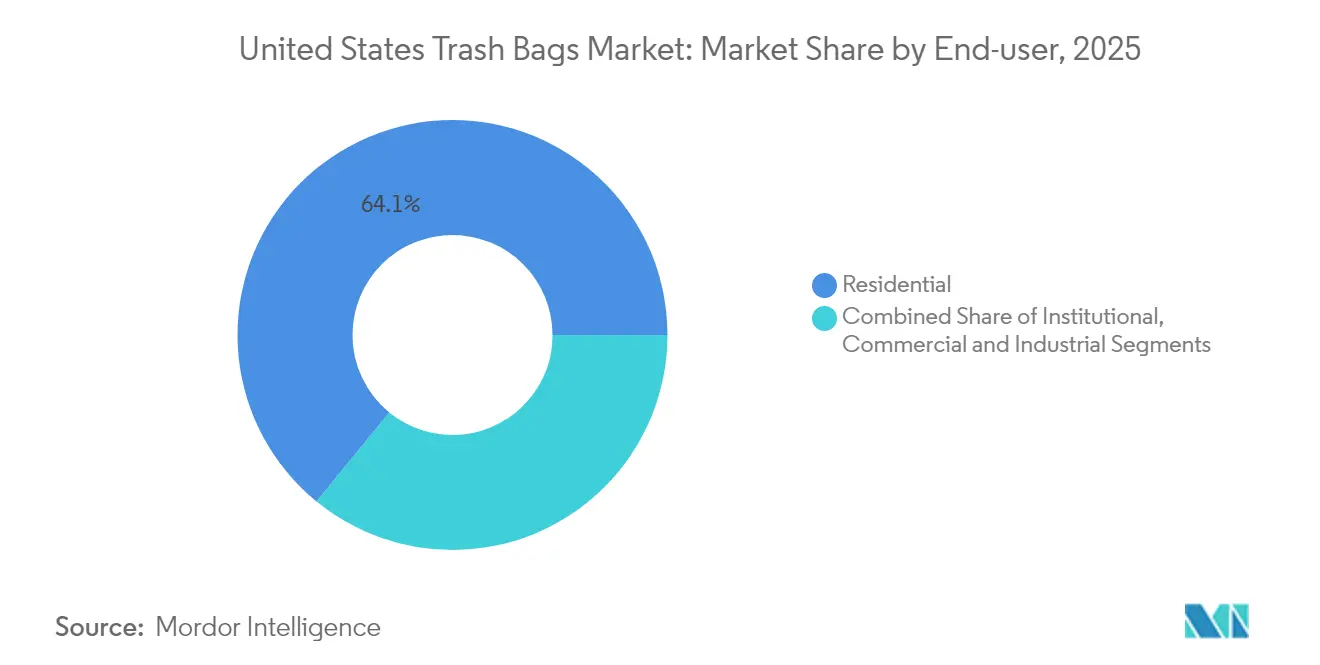
Hospitals Propel Institutional UptakeResidential consumption accounted for 64.10% of 2025 revenue, anchored by routine household disposal. However, institutional facilities-hospitals, long-term care centers, government buildings-are forecast to grow at 4.74% CAGR, notably faster than the aggregate market. A 500-bed hospital may segregate fifteen waste fractions, each needing a distinct liner color, antimicrobial efficacy, or load specification. CDC infection-control protocols and Joint Commission compliance audits hard-wire these requirements into multiyear procurement contracts, creating sticky demand. Commercial and industrial (C&I) users focus on cost-out programs; micro-layered film structures that deliver thinner gauges without tensile loss appeal strongly to big-box retail and quick-service restaurant chains.
Academic work confirms antimicrobial liners can cut surface cross-contamination by 45-60%, helping hospitals justify premiums of 8-15% over conventional products. That cost delta is often recouped through reduced healthcare-associated infection (HAI) penalties.
By Distribution Channel:
Digital Platforms Rewrite LogisticsOnline retail, encompassing both direct-to-consumer and B2B portals, is logging a 5.05% CAGR through 2031 by offering tiered subscription bundles, bulk-order discounts, and real-time tracking. Hospitals adopting centralized e-procurement shaved 30-40% off administrative overhead by automating approvals and consolidating shipments across multiple campuses. Integration with smart dispensers amplifies savings by syncing reorder triggers with consumption data.
Even with these gains, offline retail still controls 54.10% of 2025 revenue by leveraging storefront immediacy and merchandising end-caps. DIY big-box outlets cater to emergency household restocking, especially during weather events when online lead times stretch. Distributors serving C&I accounts add value through technical training and liner-fit audits, a service bundle not easily replicated by pure-play e-commerce entrants.
Geography Analysis
West Coast states form the epicenter of sustainable packaging regulation. California’s SB 54 stipulates a 65% recycling rate and 25% recycled content in all plastic packaging by 2032, pushing local buyers to specify thicker, higher-grade films with PCR content. Oregon and Washington have adopted parallel frameworks, accelerating the shift toward bio-based liners. Vermont’s Universal Recycling Law fuels demand for compostable liners in New England, although those sales remain smaller in absolute dollar terms.
The Northeast balances strong environmental policy with mature recycling infrastructure; 175+ municipalities in Massachusetts now operate curbside organics collection that accepts ASTM D6400-certified bags. Household waste generation averages 4.2 pounds per capita per day, below the 4.9-pound national norm, reflecting higher diversion rates. Although volumes are modest, unit margins are higher because of consumer willingness to pay for certified products.
The Southeast and Gulf Coast constitute the country’s polymer backbone, with Louisiana alone housing 45% of the United States' LDPE capacity. Competitive resin pricing lowers conversion costs, yet recurring hurricane disruptions require robust contingency inventories. Growth corridors in Texas, Florida, and North Carolina-fueled by migration and tourism-are raising MSW tonnage, but fragmented local regulation slows uptake of premium sustainable liners.
Regulatory Landscape
Trash bags policy in the United States is influenced by federal waste-management rules and state-by-state packaging and bag restrictions. At the federal level, the U.S. Environmental Protection Agency (EPA) administers hazardous waste requirements under RCRA, and in March 2026 the EPA proposed eliminating paper hazardous waste manifests in favor of a full transition to the federal e-Manifest system within 24 months of a final rule. This proposal would reinforce digital traceability for regulated waste handling that institutional waste generators and service providers must align with.
State measures around checkout-bag fees and restrictions tightened in 2026, including California (SB 1053), New Mexico (Single-Use Plastic Bag Act), and Washington (carryout bag fee requirements). Illinois enacted the Single-Use Plastic Bag Reduction Act with a July 2026 effective date that prohibits single-use checkout bags at point of sale. While these steps target carryout bags rather than trash bags, they shape polymer film demand, labeling scrutiny, and recycled-content expectations across bag categories, particularly in markets such as California where recycled-content rules for plastic trash bags apply in large procurement cycles.
Value Chain Analysis
The trash bags value chain starts with feedstocks and resin production (LDPE, LLDPE, HDPE, and bio-based polymers such as PLA/PBAT), then moves into compounding, including colorants, antimicrobial additives, and recycled-content blending. Film extrusion and blown-film conversion follow, followed by bag making (sealing, gusseting, and drawstring or closure formats) and finally packaging for retail or institutional channels. Many major U.S. participants run vertically integrated operations, with manufacturers such as Poly-America and Aluf Plastics combining internal compounding, film blowing, and conversion to manage resin volatility and meet specific gauge, strength, and regulatory attribute requirements.
On the demand side, distribution runs through mass retail and club channels, janitorial supply and B2B distributors, and increasing e-commerce procurement for facilities. Purchases are shaped by municipal and institutional waste segregation rules and state sustainability compliance. Regulatory requirements, including packaging EPR adoption across states (including California, Oregon, Colorado, Maine, Minnesota, Maryland, and Washington as enacted by 2025) and recycled-content obligations in California for regulated trash bags, add reporting and material-traceability steps to procurement and supplier qualification. As a result, recycled-resin supply, certification, and chain-of-custody documentation have gained weight alongside conventional film performance specifications.
Competitive Landscape
The United States trash bags market is moderately consolidated. Reynolds Consumer Products and The Clorox Company (Glad) collectively control a significant share of branded retail aisles, while Novolex, Inteplast, and Heritage Bag dominate private-label and institutional contracts. Reynolds invests USD 15 million in an Illinois center dedicated to compostable and recycled-content R&D, aiming to keep Hefty at the performance frontier. The Clorox Company recently introduced Glad ForceFlex Plus bags with 50% PCR and ASTM D6400 certification, positioning the brand as a dual-attribute leader.
Novolex’s acquisition of Advanced Plastics Manufacturing expands PBAT-PLA output by 40%, signaling a strategic intent to service organics-diversion programs. Inteplast’s USD 45 million investment in recycled-content lines in Texas enables a rapid response to PCR mandates in California, Colorado, and Maine. Patent analytics reveal 25% year-on-year growth in filings related to antimicrobial polymers and smart dispensing, with smaller innovators like Crown Poly and Aluf Plastics carving out niches through technological edge.
Overall, the top five players hold roughly 60–65% of revenue, yielding a competitive intensity that supports brand investment yet leaves room for niche entrants with differentiated sustainability or IoT value propositions.
United States Trash Bags Industry Leaders
-
Amcor plc
-
Reynolds Consumer Products Inc.
-
Novolex Holdings, LLC
-
Inteplast Group Corporation
-
Riverside Paper Co., Inc.
- *Disclaimer: Major Players sorted in no particular order
United States Trash Bags Market Companies Covered in this Report
- Amcor plc
- Reynolds Consumer Products Inc.
- Novolex Holdings, LLC
- Inteplast Group Corporation
- Riverside Paper Co., Inc.
- Fast Bags Corp.
- International Plastics, Inc.
- Neway Packaging Corporation
- AR-BEE Transparent Products, Inc.
- Universal Plastic Bag Co.
- The Clorox Company (Glad)
- Poly-America, L.P.
- Advance Polybag, Inc.
- Crown Poly, Inc.
- Aluf Plastics, Inc.
- BioBag Americas, Inc.
- Heritage Bag Company
- Command Packaging LLC
- Green Genius LLC
- PAC Worldwide Corporation
Market Opportunities and Future Outlook
Compliance-driven differentiation is creating whitespace for trash bag suppliers that can pair mechanical performance with verifiable sustainability attributes such as post-consumer recycled content, certified compostability, and clearer labeling. California remains a key anchor market because its recycled-content requirements for regulated plastic trash bags (0.7 mil or greater) formalize minimum postconsumer material thresholds. At the same time, 2026 state actions on carryout bags in California, New Mexico, and Washington tighten the broader bag-policy environment and intensify retailer attention to fees, labeling, and material claims.
Circular feedstock access is also becoming a practical commercial lever as more film-grade recycled polyethylene capacity comes online through collaborations between resin producers and converters. The Nova Chemicals and Novolex mechanical recycling facility in Connersville, Indiana (450,000 square feet), which produces recycled polyethylene resin, illustrates the push toward dedicated film-to-film supply. This supports branded and private-label trash bag lines that need consistent PCR quality. Institutional procurement provides a second opportunity lane, since healthcare and foodservice buyers align liner selection with CDC-oriented waste segregation practices and documented protocols, which favors color-coded, antimicrobial, and specification-driven bags sold through longer-term contracts and e-procurement systems.
Recent Industry Developments in United States Trash Bags Market
- May 2026: Novolex announced the closure of a Hilex Poly plastic bag manufacturing plant in Northern Virginia, affecting more than 100 employees. The closure tightens the regional production footprint while redirecting volume to other assets, which can affect lead times and supplier selection for private-label and institutional bag programs.
- February 2026: Reynolds Consumer Products settled a consumer fraud lawsuit related to "recyclable" labeling on certain Hefty bags and agreed to remove the claim and add an explicit statement that the bags are not recyclable. The resolution raises the bar for on-pack communications and increases pressure on trash bag marketers to substantiate sustainability claims across retail channels.
- December 2024: Novolex announced an agreement to acquire Pactiv Evergreen for USD 6.7 billion. The deal expands scale and packaging portfolio breadth, strengthening negotiating leverage and cross-category customer coverage for U.S. packaging buyers that source trash bags alongside adjacent foodservice and retail packaging formats.
United States Trash Bags Market Report Scope and Research Methodology
Market Definition and Coverage
For this study, the market covers the total value of trash bags sold in the United States across common household and commercial purchase points, counted at the point of sale into the US market in a given year.
Scope exclusions: We exclude trash can hardware, liners that are not positioned for waste disposal (such as specialty packaging films), and any reuse value from second-hand redistribution.
Segments Covered in This Report
- By Material Type
- High-Density Polyethylene (HDPE)
- Low-Density Polyethylene (LDPE)
- Linear Low-Density Polyethylene (LLDPE)
- Bio-based/Biodegradable Plastics (PLA, PBAT, PHA)
- Other Material Types
- By Capacity / Bag Size
- Up to 3 Gallons
- 3–13 Gallons
- 13–30 Gallons
- Above 30 Gallons
- By End-user
- Residential
- Institutional (HoReCa, Healthcare, Education)
- Commercial and Industrial
- By Distribution Channel
- Offline Retail (Supermarkets, Warehouse Clubs, Convenience Stores)
- Online Retail
- B2B / Institutional Sales
Data Sources, Market Sizing, and Validation
Desk Research
Desk research was used to set the market boundaries, build a clean demand map, and find stable reference indicators that can be checked each year. We relied on public statistics and technical references such as US Census Bureau manufacturing and trade tables, US International Trade Commission data, US Environmental Protection Agency municipal solid waste releases, and Bureau of Labor Statistics price series that help interpret resin-linked cost pressure.
To make the model practical, additional context was taken from sources such as SEC filings and investor presentations, association and retailer websites, reputable press coverage on packaging and waste policy, and peer-reviewed papers on plastic film and recycled-content performance. In a few places, paid subscriptions were used for company financial intelligence, patent lookups, and shipment-level import and export checks so assumptions could be stress-tested against observed activity. These sources are illustrative and not exhaustive, and many other references were used for data collection, validation, and clarification.
Primary Interviews and Surveys
Primary work focused on confirming what drives value in the US trash bags space, where pricing really moves, and how channel mix changes across residential and institutional buying. We spoke with a mix of manufacturers, converters, distributors, and large buyers, and we used those inputs to adjust desk assumptions on real purchasing patterns, recycled-content adoption, and promotional intensity across major US regions.
Distribution of primary research fieldwork respondents
| Company type | Respondent position |
|---|---|
| Top tier: 38% | CXOs: 16% |
| Mid tier: 46% | Functional/Unit leaders: 40% |
| Smaller Players: 16% | Managers: 44% |
Market-Sizing & Forecasting
The market was sized using a top-down and bottom-up combination that starts from a US demand pool view, then gets reconciled with supply-side reality checks. On the top-down side, household and commercial waste disposal activity was translated into bag usage intensity using inputs such as municipal solid waste generation, trash collection participation, and the typical mix of bag sizes used in kitchens, yards, and facilities, which then gets priced using observed retail and institutional price ranges.
Selective bottom-up approximations were then used to corroborate totals, mainly through sampled price times volume math across common pack formats, channel checks with distributors and large buyers, and roll-ups from a practical set of suppliers where public financial disclosure exists. When a gap showed up because parts of the market are private or sold through fragmented local routes, it was handled through calibrated expansion factors tied back to import trends, conversion capacity commentary, and primary feedback on the share of untracked sales.
For forecasting, we used scenario analysis anchored to a set of drivers that buyers and suppliers can typically align on, including population and household formation, institutional and commercial occupancy trends, resin cost pass-through timing, recycled-content and biodegradable positioning, and retail promotion cadence. Assumptions were kept conservative where visibility is lower, and were tightened when multiple interviewees pointed to the same direction of change.
Data Validation & Update Cycle
Outputs were checked against independent signals so the final series stays realistic across years, not just in the base year. We compared implied per-household usage, price realization ranges by channel, and trade-linked supply movements, and then we reviewed any large jumps to confirm they were caused by a clear driver such as resin-led inflation or channel mix changes.
Before sign-off, the model is reviewed in steps, starting with internal cross-checks and followed by an analyst review of assumptions that have the biggest impact. If a variance cannot be explained, respondents are re-contacted and the input is corrected before finalizing. Reports are refreshed annually, and interim updates are made when material events occur, followed by a final pre-delivery pass to reflect the latest available data.
Mordor Intelligence's US Trash Bags Market Sizing Compared With Other Published Estimates
Published market sizes for US trash bags can look far apart because the underlying scope and pricing treatment can shift the total quickly, even when people are describing the same end use. Differences usually come from what is counted as a trash bag versus adjacent liners, which channels are included, and whether the reported value reflects list prices or realized prices after promotions.
By tracking channel-level price realization and refreshing key inclusion rules, Mordor Intelligence keeps the US trash bags total tied to actual purchase behavior across retail and institutional routes, rather than blending in broader plastic bag categories or inflated price points. The remaining spread often comes from aggressive growth cases that assume faster recycled-content premiumization, or from older base years that were not rechecked after resin-driven price cycles and policy-driven product mix changes.
Benchmark comparison
| Source | Market Size | Gaps in Research Methodology |
|---|---|---|
| Mordor Intelligence | USD 2.98 B (2025) | |
| Trade Publisher A | USD 2.87 B (2024) | Uses an earlier base year and may not fully capture 2025 price realization shifts from promotions and resin cost pass-through, which can move value without a large change in unit demand. |
| Industry Data House B | USD 3.90 B (2025) | Likely applies a wider scope that blends trash bags with adjacent plastic liners or specialty sacks, and it can also assume higher average prices without separating household packs from institutional contracts. |
Looking across the three numbers, the main driver is not demand direction but what gets counted and how prices are treated by channel and pack type. When scope boundaries, pricing logic, and timing are kept consistent, the resulting market size becomes easier to trace back to clear inputs and to update in a repeatable way each year.
Key Questions Answered in the Report
How large is the United States trash bags market in 2026?
The market is valued at USD 3.09 billion in 2026 with a forecast CAGR of 3.64% through 2031.
Which material dominates liner production?
LDPE holds 39.85% of United States trash bags market share, although bio-based alternatives are the fastest-growing segment.
Why are above-30-gallon bags growing quickly?
Hospitals, airports, and other institutions favor large liners for labor efficiency, giving this segment a 4.91% CAGR forecast.
How are extended producer responsibility (EPR) laws affecting supplier strategy?
EPR mandates push manufacturers to integrate PCR content and produce thicker, mechanically recyclable films to maintain market access.
What advantages do smart dispenser systems offer?
They automate re-ordering, cut inventory labor by up to 80%, and align liner type with waste-stream segregation rules.
Which distribution channel is expanding fastest?
Online retail is advancing at a 5.05% CAGR due to subscription models and platform-based bulk procurement.