
Market Overview
| Study Period | 2020 - 2031 |
|---|---|
| Forecast Data Period | 2026 - 2031 |
| Base Year Market Size (2025) | USD 1.95 Billion |
| Market Size (2026) | USD 2.08 Billion |
| Market Size (2031) | USD 2.89 Billion |
| Growth Rate (2026 - 2031) | 6.78 % |
| Market Concentration | Medium |
Major Players *Disclaimer: Major Players sorted in no particular order Image © Mordor Intelligence. Reuse requires attribution under CC BY 4.0. | |
US Temperature Sensors Market Analysis by Mordor Intelligence
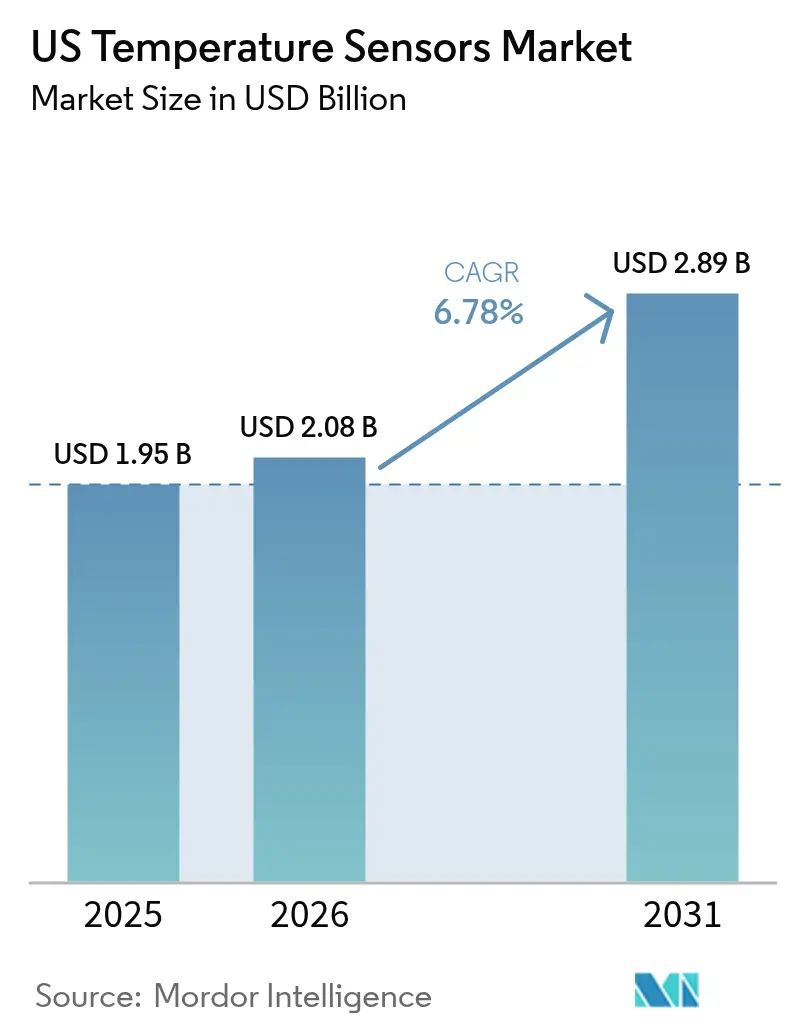
The US Temperature Sensors Market size is expected to grow from USD 1.95 billion in 2025 to USD 2.08 billion in 2026 and is forecast to reach USD 2.89 billion by 2031 at 6.78% CAGR over 2026-2031. Sub-degree accuracy demands, federal incentives that strengthen on-shore semiconductor production, and the diffusion of real-time monitoring across electric-vehicle (EV) value chains and data-center cooling systems keep the growth engine running. Liquidity in private semiconductor investments already past USD 400 billion has unlocked new fabs that rely on in-process thermal diagnostics, while autonomous factories and predictive maintenance programs drive continuous sensor retrofits. Distributed fiber-optic solutions, advanced infrared arrays, and AI-enabled edge devices are widening the competitive moat for suppliers able to pair measurement precision with integrated analytics. At the same time, tighter safety regulations in healthcare, energy storage, and petrochemical sites ensure that replacement cycles remain brisk even in legacy wired installations.
Key Report Takeaways
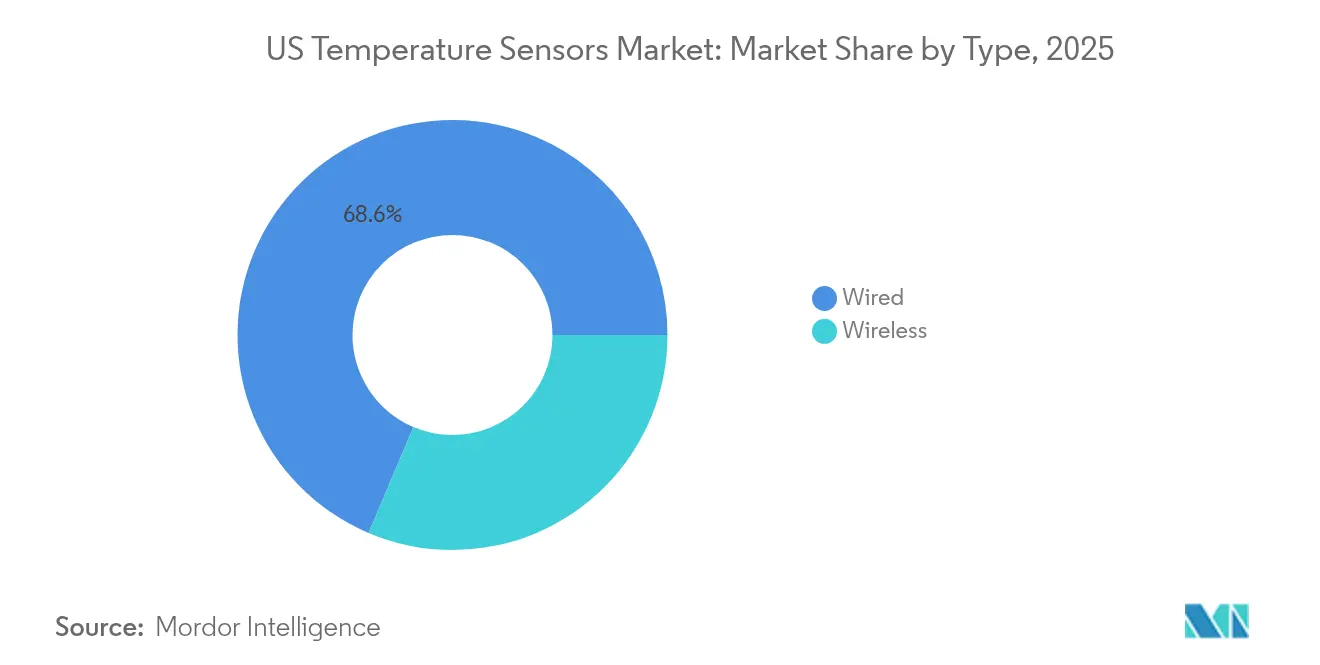
- By type, wired devices led with 68.62% of the US temperature sensors market share in 2025; wireless devices are projected to climb at 10.22% CAGR through 2031.
- By technology, thermocouples captured 31.95% of revenue in 2025, whereas fiber-optic distributed temperature sensing is forecast to expand 11.10% CAGR to 2031.
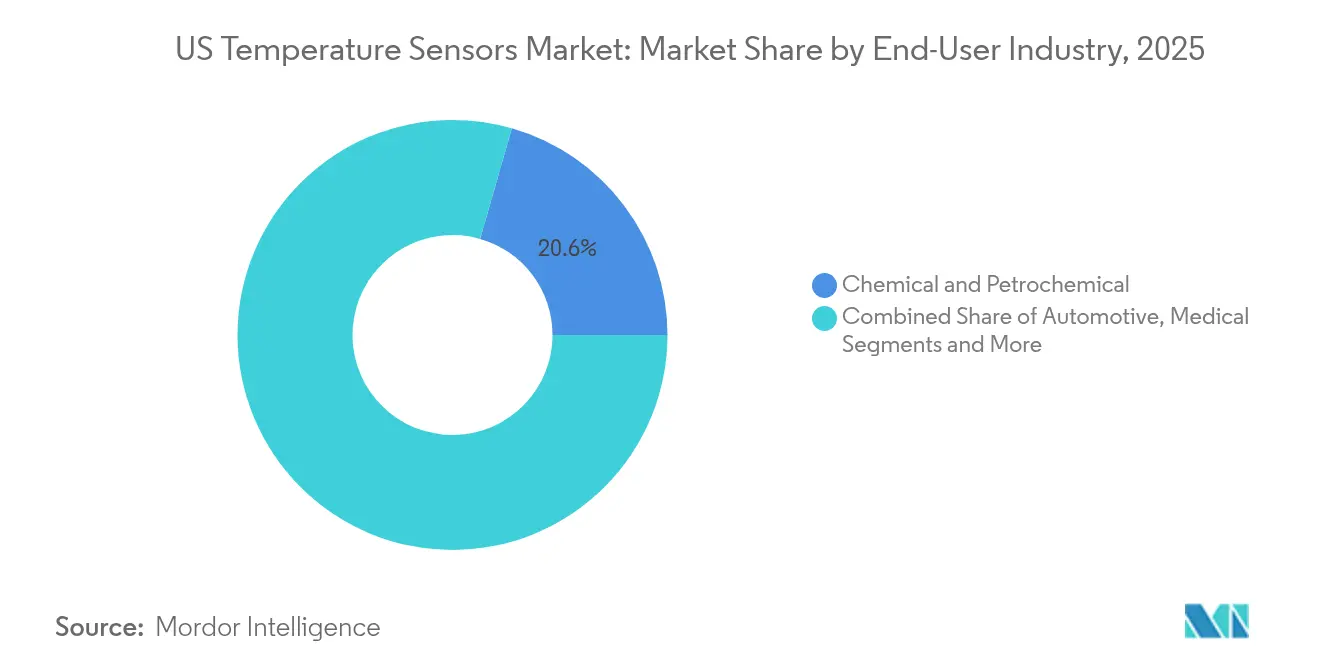
- By end-user industry, chemical and petrochemical facilities commanded 20.55% of 2025 sales, while medical applications are advancing at 10.63% CAGR to 2031.
- By connectivity, contact solutions maintained 85.10% share of the US temperature sensors market size in 2025; non-contact formats are pacing 10.05% CAGR to 2031.
- By application environment, industrial process monitoring accounted for 34.05% of revenue in 2025, with data-center cooling rising fastest at 9.35% CAGR.
Note: Market size and forecast figures in this report are generated using Mordor Intelligence’s proprietary estimation framework, updated with the latest available data and insights as of 2026.
US Temperature Sensors Market Trends and Insights
Drivers Impact Analysis*
| Driver | (~) % Impact on CAGR Forecast | Geographic Relevance | Impact Timeline |
|---|---|---|---|
| Expansion of Industry 4.0 & smart-factory adoption | +1.8% | Nationwide; Midwest manufacturing belt | Medium term (2–4 years) |
| Growing demand for temperature sensing in wearable consumer electronics | +1.2% | West-Coast tech hubs; expanding nationally | Short term (≤2 years) |
| Rising automotive electronics & EV thermal-management requirements | +1.5% | South and West EV corridors | Long term (≥4 years) |
| Adoption of cold-chain IoT sensors for mRNA-vaccine logistics | +0.8% | Pharmaceutical clusters nationwide | Medium term (2–4 years) |
| Rapid growth of data-center liquid-cooling distributed sensing | +1.1% | West hyperscale & East financial hubs | Short term (≤2 years) |
| Federal on-shoring incentives boosting in-fab thermal-process sensors | +0.9% | Arizona, Texas, Ohio, New York | Long term (≥4 years) |
| Source: Mordor Intelligence | |||
Expansion of Industry 4.0 and smart-factory adoption
Industrial digitalization reshapes factory floors by fusing AI, robotics, and connected instrumentation, and temperature sensing sits at the heart of that convergence. Predictive maintenance programs that once sampled a few key assets now blanket entire production lines with hundreds of nodes that flag thermal deviations hours before mechanical breakdowns.[1] Edge AI chipsets embedded in new sensors from Texas Instruments crunch local data streams so millisecond-level alerts can trigger automated responses without cloud latency. Interoperable protocols such as FOUNDATION Fieldbus and PROFINET simplify system integration, while ruggedized housings and extended temperature ranges ensure reliable service in dusty, high-vibration zones. As a result, the US temperature sensors market keeps enjoying replacement sales into heritage PLC networks and fresh demand from green-field smart factories.
Growing demand for temperature sensing in wearable consumer electronics
Miniaturized, low-power die have brought clinical-grade temperature accuracy into everyday devices, letting consumers track core body temperature within ±0.1 °C for early illness detection.[2] Stretchable substrates now conform to skin for days without irritation, and dual-sensor ear-canal designs deliver continuous readings that fit into telehealth workflows. Fifth-generation cellular links and edge computing chips send encrypted streams to healthcare dashboards so clinicians can intervene remotely, a capability valued by aging-in-place programs. For sensor makers, these design wins offer high-volume consumer channels plus technology leverage across industrial IoT where power budgets are equally tight. The resulting pull keeps the US temperature sensors market on a steep innovation curve.
Rising automotive electronics and EV thermal-management requirements
EV battery packs operate within narrow safety margins, turning temperature differentials of 0.1 °C into potential runaway events. New rotor sensors from Continental compress tolerance bands from 15 °C to 3 °C, helping motor designers reduce rare-earth magnet content while sustaining torque.[3] Honeywell’s battery-safety electrolyte sensor warns up to 20 minutes ahead of thermal events, buying crucial reaction time during fast charging. Because next-gen 800 V architectures elevate switching frequencies, temperature nodes must survive stronger electromagnetic fields and meet top-tier ASIL D functional-safety goals. These stringent specs safeguard sensor margins and keep the US temperature sensors market closely tied to EV adoption curves.
Adoption of cold-chain IoT sensors for mRNA-vaccine logistics
Ultra-low-temperature storage has moved from niche biologics to mass immunization programs, forcing distributors to certify product integrity at every hand-off. IoT-enabled sensors now couple with blockchain ledgers to generate immutable temperature records, closing regulatory gaps and simplifying recalls. Satellite IoT connectivity addresses blind spots along rural routes, and multi-sensor units track dry-ice chambers and ambient holds simultaneously.[4] As cell- and gene-therapy volumes climb, revenue prospects for real-time cold-chain sensing grow accordingly within the US temperature sensors market.
Restraints Impact Analysis*
| Restraint | (~) % Impact on CAGR Forecast | Geographic Relevance | Impact Timeline |
|---|---|---|---|
| Volatility in semiconductor & platinum-group metal prices | –0.9% | Nationwide via global supply chains | Short term (≤2 years) |
| Lengthy design-in cycles slow sensor replacement in regulated sectors | –0.6% | Aerospace & medical factories nationwide | Long term (≥4 years) |
| Cyber-security concerns over wireless sensors in critical infrastructure | –0.4% | Power and defense facilities nationwide | Medium term (2–4 years) |
| Shortage of fiber-optic installers curbs distributed sensing roll-out | –0.3% | Rural markets | Medium term (2–4 years) |
| Source: Mordor Intelligence | |||
Volatility in semiconductor and platinum-group metal prices
Price swings in gallium, germanium, and platinum upset cost structures for RTDs and high-precision chip-based probes. China’s command of gallium and germanium refining keeps US buyers vulnerable to export restrictions, while platinum thin films face supply tightness amid intensified fuel-cell and catalytic-converter demand. Budget uncertainty can delay upgrade projects, trimming near-term volumes inside the US temperature sensors market.
Cyber-security concerns over wireless sensors in critical infrastructure
IoT devices extend attack surfaces for hackers targeting defense, power, and chemical assets. RF replay attacks and jamming episodes have prompted the Department of Defense to craft tougher authentication standards, adding cost and development time to wireless nodes. Until secure-by-design frameworks mature, some operators cling to wired systems, moderating the otherwise rapid wireless uptake across the US temperature sensors market.
*Our forecasts treat driver/restraint impacts as directional, not additive. The impact forecasts reflect baseline growth, mix effects, and variable interactions.
Segment Analysis
By Type: Wireless Growth Accelerates Infrastructure Modernization
Wired devices retained 68.62% of 2025 revenue thanks to hard-wired reliability in safety-critical loops and existing DCS cabling, yet wireless nodes are scaling 10.22% CAGR on retrofit ease and lower installation costs. The US temperature sensors market size for wireless products is forecast to reach USD 1.09 billion by 2031, reflecting robust adoption in data centers and food plants. Self-powered harvesters developed at MIT remove battery maintenance barriers and widen use cases in pumps, kilns, and rotating equipment. In sprawling factories, LoRaWAN and 5G NB-IoT enable kilometer-scale reach with milliwatt power budgets, giving plant managers granular heat maps without trenching cable.
Reliability fears that once shadowed wireless have faded as frequency-hopping and AES-128 encryption become standard. Edge microcontrollers now pre-process readings to slash packet payloads, reducing congestion on factory backbones. Meanwhile, wired incumbency endures in nuclear, pharma, and aerospace lines where governance protocols require fixed cabling and analog outputs. Suppliers that bundle mixed-mode gateways bridging 4-20 mA loops with Wi-Fi or Sub-GHz radios capitalize on hybrid roll-outs and expand their stake in the US temperature sensors market.

By Technology: Fiber-Optic DTS Disrupts Traditional Sensing Paradigms
Thermocouples brought in 31.95% of 2025 turnover by covering extreme heat up to 2,300 °C, but distributed fiber-optic systems are rocketing at 11.10% CAGR as industries crave spatial resolution over point checks. The US temperature sensors market size for DTS is projected to exceed USD 525.4 million by 2031. Immune to EMI, fiber lines navigate high-voltage bays and induction furnaces where electronics fail. High-definition units from Luna Innovations achieve sub-millimeter granularity, mapping battery modules and cryogenic pipelines alike.
Resistance Temperature Detectors still dominate pharma cleanrooms and metrology labs that stipulate ±0.1 °C accuracy. Thermistors capture cost-sensitive appliances, while infrared arrays unlock thermal imaging for predictive maintenance. Hybrid transmitters delivering HART, Modbus, or Ethernet protocols simplify integration into digital twins. Vendors that supply full stacks sensing element, head-mount transmitter, and analytics firmware bolster recurring revenue and deepen their position inside the US temperature sensors market.
By End-User Industry: Medical Applications Drive Precision Innovation
Chemical and petrochemical complexes accounted for 20.55% of 2025 shipments as refineries monitor distillation column reflux and cracker furnace tubes. Yet medical deployments are surging 10.63% CAGR, outpacing overall US temperature sensors market growth. Demand stems from wearable patches, implantables, and portable dialysis machines seeking single-digit milliwatt budgets and biocompatible coatings. Sub-50 nW chips demonstrated in 2025 unlock months-long monitoring without battery swaps.
Elsewhere, EV battery plants, wind-turbine nacelles, and LNG export lines all raise unique accuracy, vibration, and corrosion hurdles. Cross-industry knowledge transfer means breakthroughs in one segment ripple quickly into another. Suppliers that master application engineering selecting sheath alloys, ingress ratings, and firmware filters win higher-margin custom orders, lifting overall returns in the US temperature sensors market.
By Connectivity: Non-Contact Sensing Gains Safety-Critical Applications
Contact probes held 85.10% revenue in 2025, underpinned by direct immersion RTDs and thermocouples embedded in process media. Non-contact infrared units, however, are expanding 10.05% CAGR as OSHA and NEC codes tighten safe-distance inspection norms. Robotic IR cameras patrolling data-center aisles spot hotspots behind door panels long before alarms trip.
Laser pyrometers now read molten-metal pours from several meters away, shielding operators from splash hazards. In electric substations, handheld infrared guns flag bushing failures without taking systems offline, while analytics overlays recommend load rebalancing. As predictive safety regimens proliferate, non-contact formats will steadily chip away at contact dominance inside the US temperature sensors market.
By Application Environment: Data Centers Drive Liquid-Cooling Innovation
Industrial process monitoring delivered 34.05% of receipts in 2025, but liquid-cooled data halls headline the growth charts with 9.35% CAGR. Hyperscale operators chasing AI inference throughput are pouring funds into cold-plate and immersion technologies, and every pump loop demands continuous inlet-outlet differential tracking. Fiber DTS strings measure hundreds of points along manifold runs, feeding machine-learning models that adjust flow rates in real time to cut PUE.
Healthcare wearables, EV powertrains, and building-automation HVAC segments add to demand diversity. A single gigafactory may host five distinct temperature-measurement ecosystems battery electrode drying ovens, coolant chillers, inverter stacks, ambient comfort loops, and energy-storage systems each calling for different accuracies, response times, and form factors. Such breadth keeps the US temperature sensors market both resilient and innovation-hungry.
Geography Analysis
The South dominates with 36.85% of 2025 sales, powered by Gulf-Coast petrochemical giants, EV assembly plants, and aggressive CHIPS Act fab construction. Tesla’s Texas expansions and new LNG terminals in Louisiana require high-temperature and cryogenic instrumentation, respectively. Local sourcing incentives drive procurement toward domestic sensor suppliers that can service sites within hours, keeping value capture inside US borders.
In contrast, the West is climbing 9.76% CAGR as Silicon-Valley data centers pivot to liquid cooling and California’s EV ecosystem scales. Renewable-energy mandates proliferate sensor points across solar farms, geothermal wells, and wind turbines. Intel’s foundry projects in Arizona deepen demand for Class 1 clean-room-certified probes, while wildfire-prone grids in California deploy non-contact infrared cameras for transmission-line monitoring.
Midwestern and Northeastern states embrace Industry 4.0 retrofits of legacy plants, rolling out wireless networks to counter skilled-labor shortages and raise OEE metrics. Harsh winter climates require sensors rated to -40 °C, whereas humid Gulf summers demand conformal coatings to fight condensation. Regional weather extremes therefore shape material choices and sealing techniques, giving full-suite suppliers an edge in the US temperature sensors market.
Regulatory Landscape
In the United States, temperature sensors used in commercial measurement and regulated environments are shaped by metrology guidance, safety standards, and sector-specific compliance expectations. NIST Handbook 44, maintained through the National Conference on Weights and Measures (NCWM), provides specifications and tolerances used by many state weights-and-measures programs, and NCWM adopted amendments to Handbook 44 at its 109th Annual Meeting in July 2024. For building automation and appliance-control use cases, UL 60730-2-9 is a recognized safety reference for automatic electrical temperature sensing controls.
For regulated end markets, oversight also extends to inspection and calibration practices. FDA inspection technical guides address temperature sensors used in regulated industry contexts where temperature control and documentation support product quality and patient safety, while EPA requirements such as 40 CFR 1065.215 govern aspects of temperature measurement and calibration in emissions-related testing. In the trade-and-sourcing context, U.S. Customs and Border Protection (CBP) country-of-origin rulings for temperature-measurement articles, including rulings issued in 2026 covering digital stick thermometers and thermistors, affect labeling and can influence qualification and procurement decisions for import-dependent supply chains.
Competitive Landscape
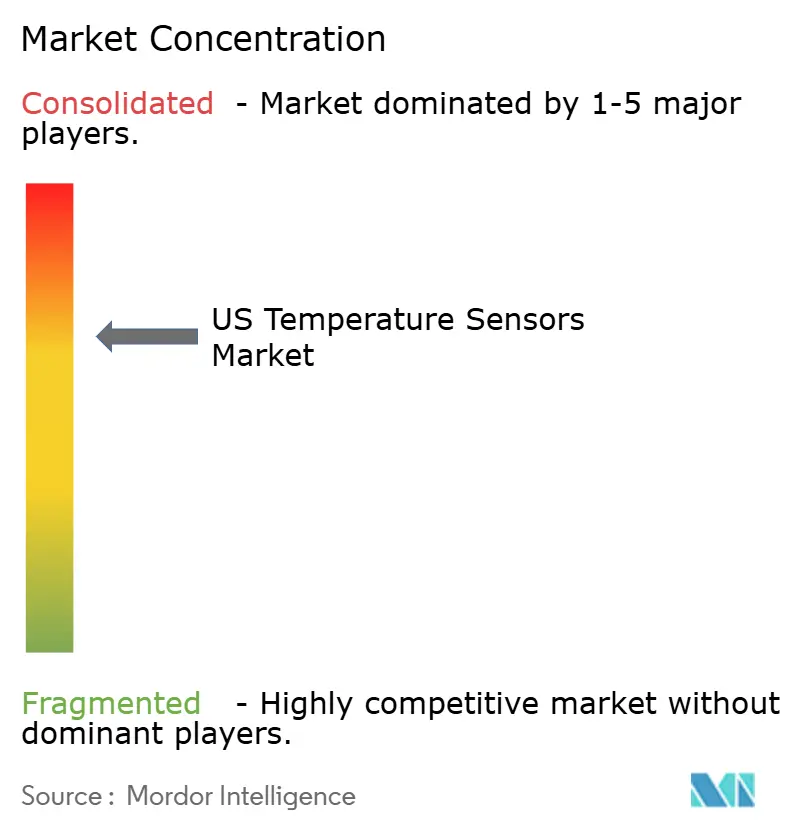
Market structure is moderately concentrated. Heavyweights such as Texas Instruments, Honeywell, and TE Connectivity deploy end-to-end portfolios and fabs that secure silicon supply, shielding them from foundry bottlenecks. Their vertical integration lets them bundle transducers with ASIC signal chains and diagnostics software, deepening customer lock-in. Honeywell’s 2025 deal to automate LG Energy Solution’s Arizona battery plant underscores the shift from component sales to holistic thermal-management platforms.
Niche entrants pursue white spaces in quantum computing, nano-photonics, and extreme-environment sensing. University spin-outs tout integrated thermometry that maintains femto-kelvin stability for quantum bits, highlighting future demand beyond today’s industrial baseline. Cyber-secure firmware and AI-on-sensor chips differentiate mid-tier vendors aiming at critical-infrastructure tenders.
Strategic collaborations are trending: TI and Delta Electronics co-developed a 95%-efficient 11 kW onboard charger that embeds multiple high-speed temperature channels. Supply-chain hedging also gains attention; Polar Semiconductor’s Minnesota expansion insulates automotive sensor programs from Asia-Pacific geopolitics. Collectively, these moves reinforce the technology bar and sustain competitive churn within the US temperature sensors market.
US Temperature Sensors Industry Leaders
-
TEXAS INSTRUMENTS INC.
-
Honeywell International Inc.
-
ANALOG DEVICES INC.
-
Fluke Process Instruments
-
EMERSON ELECTRIC CO.
- *Disclaimer: Major Players sorted in no particular order
Market Opportunities and Future Outlook
Field validation pathways and public testbeds represent a concrete whitespace for suppliers that can pair sensing elements with secure connectivity and analytics. In January 2026, the U.S. Department of Energy (DOE) Office of Critical Minerals and Energy Innovation (CMEI) selected 16 projects totaling USD 155 million to strengthen U.S. National Laboratory capabilities for industrial innovation. The selected work includes data center cooling testbeds at Lawrence Berkeley National Laboratory and industrial combustion research at the National Energy Technology Laboratory (NETL), which creates practical demand for calibrated temperature sensing that is ready for control-loop and distributed-sensing integration.
A second opportunity area centers on structured public-private evaluation that reduces adoption friction in conservative industrial settings. DOE's Industrial Technology Validation (ITV) program, which closed its application period on January 29, 2026, provides a formal mechanism for partnerships between technology developers and industrial host sites to validate sensor and control technologies under real operating constraints. Alongside NETL's ongoing Sensors, Controls, and Other Novel Concepts work, which emphasizes AI/ML-enabled condition-based monitoring and extreme-environment operations (including hydrogen-fueled turbines and advanced manufacturing), the market continues to show pull for temperature sensors built for harsh conditions, cyber-secure wireless deployment in critical infrastructure, and edge processing that converts temperature data into maintenance and optimization decisions.
Recent Industry Developments
- June 2026: Texas Instruments introduced the ISOTMP35R reinforced, isolated temperature-sensing IC with an analog output and up to 5-kV RMS withstand capability. The device targets high-voltage systems where galvanic isolation and proximity measurement are needed, supporting safer thermal monitoring in EV battery packs, traction inverters, and fast-charging power electronics.
- February 2026: Honeywell entered into an amended agreement to acquire Johnson Matthey's Catalyst Technologies business for GBP 1.325 billion, with closing targeted by the end of August 2026. The transaction strengthens Honeywell's footprint in process industries where temperature measurement is foundational to control, safety, and efficiency, and it can expand the installed base for integrated sensing-and-automation offerings.
- November 2024: Texas Instruments committed to achieving 100% renewable electricity for its manufacturing operations by 2030. The commitment supports customer sustainability requirements and can influence supplier qualification decisions for temperature-sensor-related semiconductors and signal-chain components used across industrial and data-center applications.
Research Methodology Framework and Report Scope
Market Definition and Coverage
For this study, the market covers revenues from temperature sensing devices sold and used in the United States across industrial, automotive, medical, building, and other mainstream applications. The scope includes both contact and non-contact sensing approaches, whether the sensor is embedded in equipment or sold as a standalone component.
Scope exclusions: We exclude calibration services, installation labor, and control software unless that value is sold as an inseparable part of the temperature sensing device.
Segmentation Overview
- By Type
- Wired
- Wireless
- By Technology
- Infrared
- Thermocouple
- Resistance Temperature Detector (RTD)
- Thermistor
- Temperature Transmitter
- Fiber Optic
- Others
- By End-user Industry
- Chemical and Petrochemical
- Oil and Gas
- Metal and Mining
- Power Generation
- Food and Beverage
- Automotive
- Medical
- Aerospace and Military
- Consumer Electronics
- Other End-user Industries
- By Connectivity
- Contact
- Non-Contact
- By Application Environment
- Industrial Process Monitoring
- HVAC and Building Automation
- Healthcare and Wearables
- Electric-Vehicle Battery Management
- Data Centers and Telecom
Data Sources, Market Sizing, and Validation
Desk Research
Desk research was used to set market boundaries, identify demand pools, and build the first set of assumptions for volumes and price bands. We relied on public, non-paywalled sources such as US Census Bureau manufacturing and trade statistics, Bureau of Labor Statistics price and wage series, Federal Register documents, and NIST publications tied to measurement standards, plus USITC data to frame import and export context. For technology direction, we reviewed peer-reviewed engineering journals.
Alongside these, company filings, investor presentations, credible press coverage, and association websites were used to map product positioning and typical end-use exposure. Where needed, paid subscriptions that cover company financials and intelligence, patent databases, shipment-level trade records, and news and financials were used to cross-check timelines, product refresh cycles, and manufacturing footprint signals. These desk research sources are illustrative only, and other references were also used for data collection, validation, and clarification.
Primary Interviews and Surveys
Primary work focused on validating what is actually purchased and replaced in the US, and clarifying how the sensor mix changes across process industries, HVAC, automotive, and medical uses. We interviewed manufacturers, distributors, system integrators, and large end users, and we used these inputs to firm up price ranges, replacement timing, and adoption of contact versus non-contact sensing. Feedback was also used to test assumptions on domestic production versus imports and to confirm which application areas were showing demand acceleration.
Distribution of primary research fieldwork respondents
| Company type | Respondent position |
|---|---|
| Top tier: 28% | CXOs: 20% |
| Mid tier: 52% | Functional/Unit leaders: 39% |
| Smaller Players: 20% | Managers: 41% |
Market-Sizing & Forecasting
The core sizing logic starts with a top-down build that reconstructs demand from US end-use activity and equipment intensity, and then translates that demand into sensor value using typical unit counts and price bands. To keep totals realistic, we corroborated with selective bottom-up approximations, such as rolling up sampled supplier revenues, channel checks with distributors, and simple volume times average selling price calculations for common sensor families.
A few market fingerprints used as inputs (illustrative) included industrial production and capacity utilization trends, facility build activity that needs tight thermal monitoring, adoption of EV and battery thermal management systems, data center cooling investments, and import patterns for electronics components. Pricing was handled through blended ASP logic that accounts for shifts between thermocouples, RTDs, thermistors, and infrared solutions, since mix changes often move value more than unit growth. For forecasting, we used scenario analysis supported by a light multivariate regression on the most stable demand indicators, and then reviewed the forward path with interview feedback before finalizing the curve. Where bottom-up signals were incomplete, we handled gaps by using conservative coverage ratios and then rebalancing to top-down totals after reasonableness checks.
Data Validation & Update Cycle
Outputs were validated through triangulation across demand indicators, pricing logic, and supplier and channel feedback, so no single data series was allowed to determine the final number alone. We ran variance checks across years, compared implied unit volumes to plausible equipment bases, and flagged outliers where the mix shift appeared too sharp to be operationally feasible.
Before sign-off, the model and assumptions went through multi-step analyst reviews, and follow-up calls were triggered when primary feedback diverged from the desk story or when new public signals appeared. Reports are refreshed annually, and interim updates are made when material events occur, such as policy shifts, supply disruptions, or notable technology transitions. Right before delivery, a final pass is completed so clients receive the most current view available at that time.
Mordor Intelligence's US Temperature Sensors Market Market Size Measured Against Other Published Estimates
Published market sizes for US temperature sensors can differ even when the topic label looks the same, because firms often count different items and then apply different pricing and timing assumptions. The most common differences come from what is treated as a sensor versus a broader sensing module, whether embedded sensors are counted at component value or at system value, and how imports, domestic shipments, and replacement demand are blended.
In our view, larger gaps usually show up when a study combines US-only demand with regional supply signals, applies aggressive ASP expansion without checking the product mix, or uses a base-year pricing snapshot that is not refreshed after cost swings. The table points to this scope and pricing treatment spread, where embedded-only value and component-level ASP logic are kept separate from system electronics rollups and refreshed annually through interview checks, which keeps totals closer to end-use demand signals under Mordor Intelligence.
Benchmark comparison
| Source | Market Size | Gaps in Research Methodology |
|---|---|---|
| Mordor Intelligence | USD 1.95 B (2025) | |
| Industry Publisher A | USD 2.41 B (2024) | Uses a different base year and appears to apply a broader definition that can pull in module-level value, while the treatment of product mix and embedded component valuation is not clearly separated. |
| Trade Platform B | USD 2.08 B (2026) | Reports a forward year point that can be mistaken as the current baseline, and the method summary does not clarify whether the value is captured at component ASP or at a higher system or instrument level. |
Taken together, the spread is mainly explained by year selection, what gets counted as sensor value, and how ASP evolution is handled as the mix shifts across contact and non-contact technologies. By keeping the demand pool tied to US end-use signals and cross-checking price bands with channel feedback, the final estimate stays traceable to steps that can be repeated and updated as conditions change.
Key Questions Answered in the Report
What is the current size of the US temperature sensors market?
The US temperature sensors market size reached USD 2.08 billion in 2026 and is forecast to climb to USD 2.89 billion by 2031.
Which segment is growing fastest within the US temperature sensors market?
Wireless sensors show the highest momentum, expanding at a projected 10.22% CAGR through 2031 on the back of retrofit flexibility and lower installation costs.
How are federal incentives affecting demand for temperature sensors?
The CHIPS Act’s 25% investment credit has spurred over USD 400 billion in fab construction, sharply increasing orders for high-precision in-process temperature probes.
Why is fiber-optic distributed temperature sensing gaining popularity?
Fiber DTS offers thousands of measurement points along a single cable, is immune to electromagnetic interference, and meets the fine-grained monitoring needs of data centers, battery packs, and high-voltage equipment.
Which US region generates the largest revenue for temperature sensors?
The South leads with 36.85% market share thanks to petrochemical clusters, EV assembly plants, and new semiconductor fabs that require extensive thermal monitoring.
What cybersecurity challenges face wireless temperature sensors?
IoT nodes in critical infrastructure must withstand RF replay and jamming attacks; adherence to emerging federal authentication standards is essential before widespread deployment.