
Market Overview
| Study Period | 2020 - 2031 |
|---|---|
| Forecast Data Period | 2026 - 2031 |
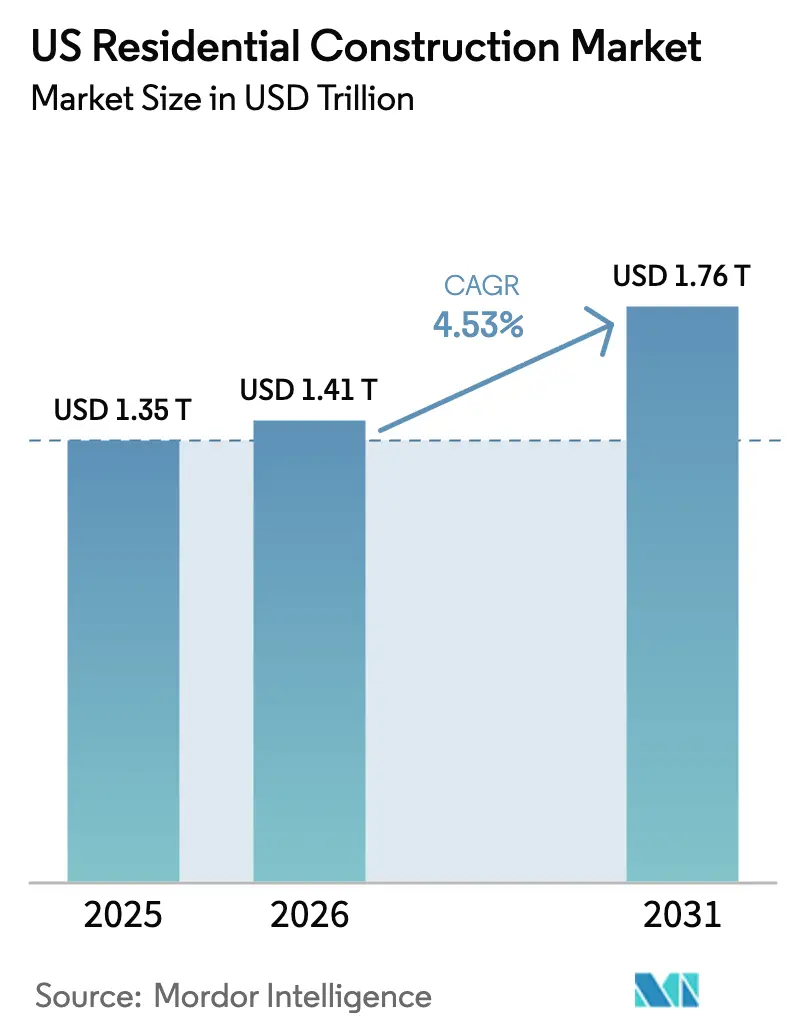
| Base Year Market Size (2025) | USD 1.35 Trillion |
| Market Size (2026) | USD 1.41 Trillion |
| Market Size (2031) | USD 1.76 Trillion |
| Growth Rate (2026 - 2031) | 4.53% CAGR |
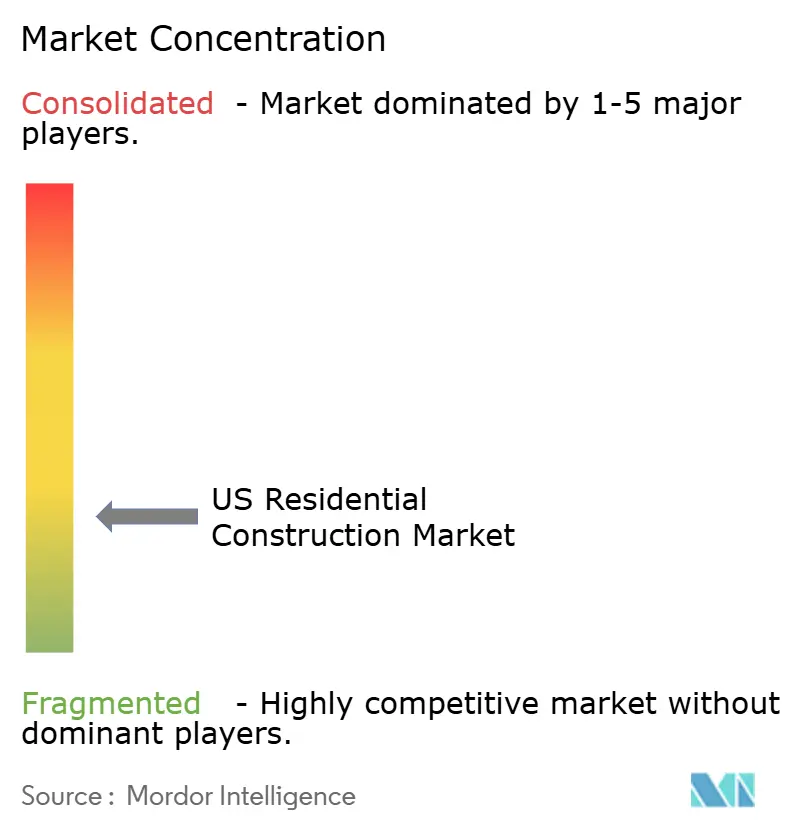
| Market Concentration | Low |
Major Players *Disclaimer: Major Players sorted in no particular order Image © Mordor Intelligence. Reuse requires attribution under CC BY 4.0. | |
US Residential Construction Market Analysis by Mordor Intelligence
The US residential construction market size in 2026 is estimated at USD 1.41 trillion, growing from 2025 value of USD 1.35 trillion with 2031 projections showing USD 1.76 trillion, growing at 4.53% CAGR over 2026-2031. Robust demographic momentum, larger institutional capital allocations, and accelerated technology adoption anchor this expansion, even as developers navigate cyclical mortgage-rate shifts. Migration toward Sun Belt metros, supportive zoning reforms, and federal energy-efficiency incentives widen the demand base. Builders increasingly differentiate through prefabrication, 3-D printing, and data-driven project management platforms, while shifting insurance and water-supply risks compel geographic diversification. Collectively, these forces recast the US residential construction market as a strategic infrastructure opportunity rather than a short-cycle, rate-sensitive play.
Key Report Takeaways
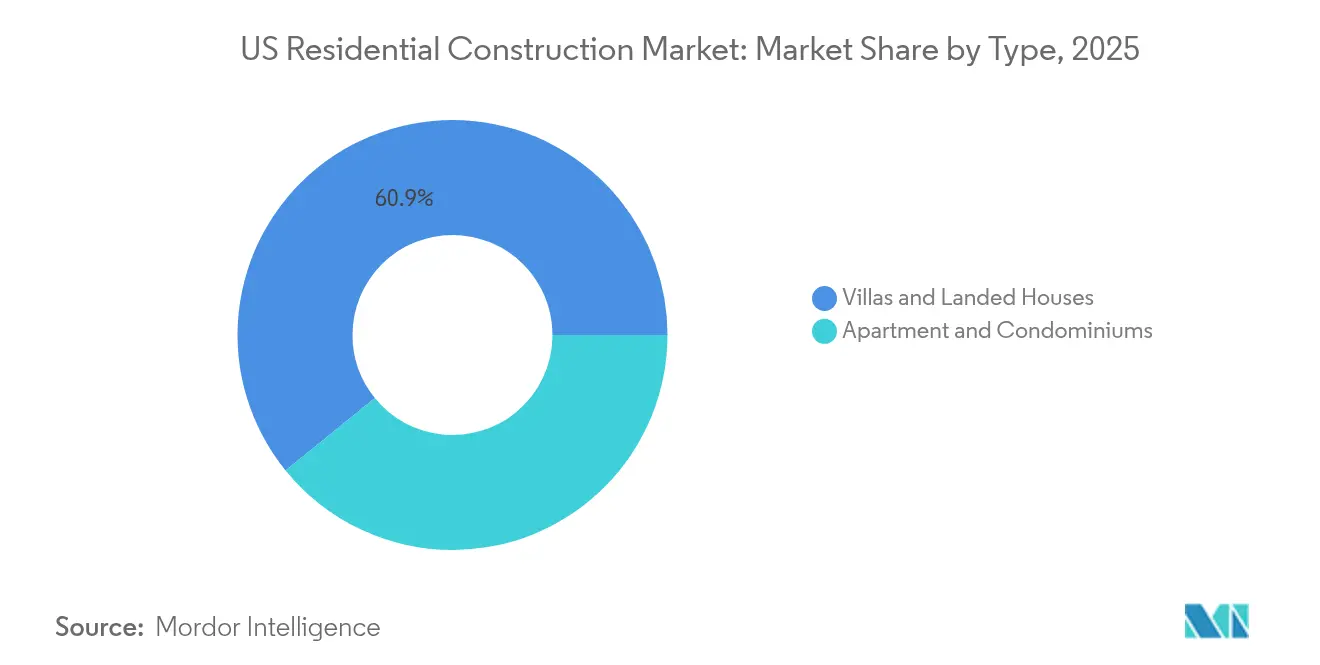
- By type, villas and landed houses accounted for 60.85% of the US residential construction market size in 2025; apartments and condominiums are forecast to expand at a 6.02% CAGR through 2031.
- By construction type, new-build activity represented 69.05% of the US residential construction market share in 2025, whereas renovation is projected to grow at a 5.61% CAGR through 2031.
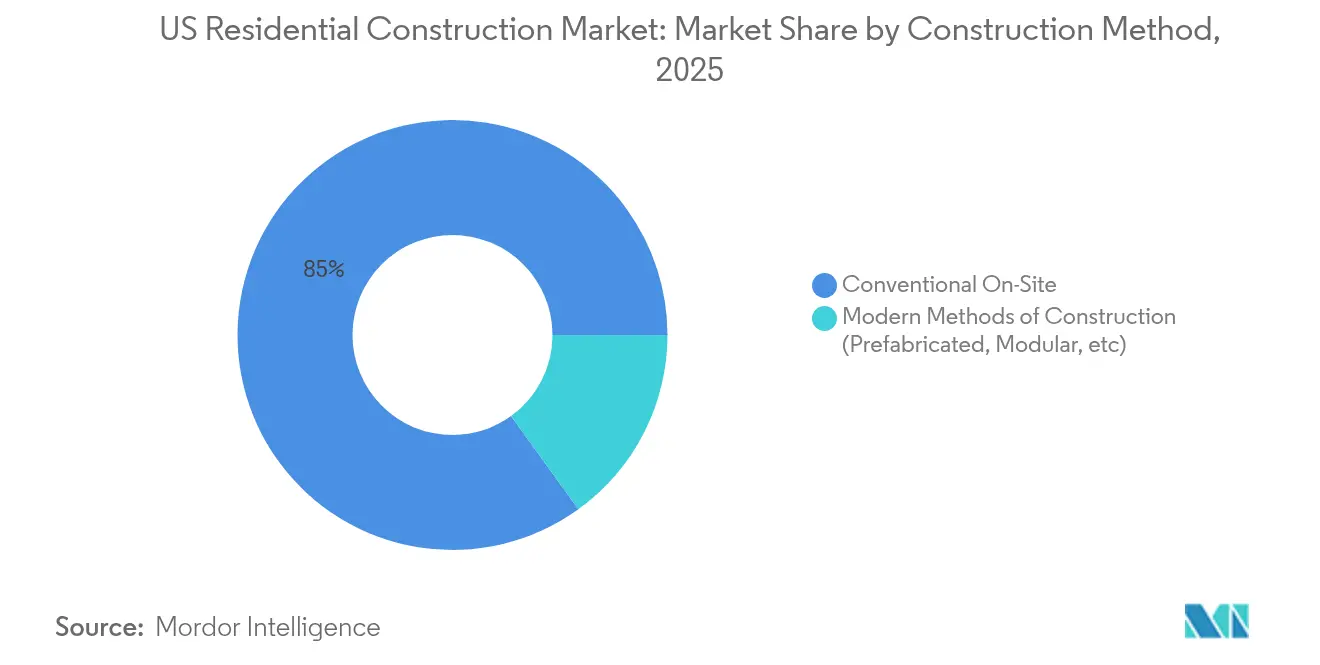
- By construction method, conventional on-site techniques comprised 84.95% of the US residential construction market size in 2025; modern methods of construction are growing at a 7.62% CAGR through 2031.
- By investment source, private capital captured 91.92% of the US residential construction market share in 2025, while public funding is set to rise at a 6.63% CAGR through 2031.
- By region, the Southeast held 41.12% of the US residential construction market share in 2025, while the West is advancing at a 5.71% CAGR through 2031.
Note: Market size and forecast figures in this report are generated using Mordor Intelligence’s proprietary estimation framework, updated with the latest available data and insights as of 2026.
US Residential Construction Market Trends and Insights
Drivers Impact Analysis*
| Driver | (~) % Impact on CAGR Forecast | Geographic Relevance | Impact Timeline |
|---|---|---|---|
| Falling mortgage rates improve affordability | +1.2% | National, with stronger impact in Northeast and West | Medium term (2-4 years) |
| Millennial household formation surge | +0.8% | National, concentrated in Southeast and West growth corridors | Long term (≥ 4 years) |
| Institutional build-to-rent capital inflows | +0.7% | Southeast and West primary markets, expanding to secondary metros | Medium term (2-4 years) |
| Aging housing stock fuels remodeling | +0.6% | National, with emphasis on Northeast and Midwest legacy markets | Long term (≥ 4 years) |
| State-level zoning reforms for higher density | +0.5% | West Coast states, expanding to Northeast progressive municipalities | Long term (≥ 4 years) |
| IRA heat-pump tax credits accelerate retrofits | +0.4% | National, with higher adoption in cold-climate regions | Short term (≤ 2 years) |
| Source: Mordor Intelligence | |||
Falling Mortgage Rates Improve Affordability
Mortgage rates trending down from 7% to near-6% by late 2025 restores roughly 15% additional buying power, stimulating new-home demand across price points. The easing rate backdrop loosens the “rate-lock” that kept existing owners sidelined, pushing more buyers toward new construction. First-time purchasers now form the majority of funded loans and favor energy-efficient, tech-ready dwellings. Builders respond with smaller footprints and smart-home packages, especially in job-rich secondary metros. The combined effect is a broader, more resilient demand curve, cushioning the US residential construction market against future rate volatility.
Millennial Household Formation Surge
Millennials aged 28-43 will contribute roughly 70% of new household creation through 2030, driving structural demand that transcends short-term economic swings. Their preference for walkable, amenity-rich communities accelerates higher-density projects near transit nodes. The cohort’s digital expectations make touchless entry, solar integration, and app-based maintenance indispensable. Sun Belt metros such as Austin and Raleigh draw outsized interest due to lower living costs and robust job pipelines. This demographic wave underpins long-run volume visibility across both single-family and multifamily segments[1]U.S. Department of the Treasury, “IRA Home Energy Rebates,” home.treasury.gov.
Institutional Build-to-Rent Capital Inflows
Institutional investors deploy more than USD 50 billion annually into single-family rental and build-to-rent (BTR) communities, reshaping product standards and volume requirements. BTR developments favor standardized floor plans, durable finishes, and centralized maintenance, raising per-unit costs but enhancing lifecycle economics. Capital concentration in Sun Belt metros pushes construction capacity to its limits, prompting greater use of modular and panelized solutions. Investors’ focus on predictable cash flows further lifts demand for low-carbon, low-maintenance materials. As a result, the BTR wave embeds a new, stable customer segment within the US residential construction market.
Aging Housing Stock Fuels Remodeling
The median US home is roughly 40 years old, and 38% of dwellings pre-date 1980, requiring major system upgrades. Energy-efficiency retrofits spurred by federal credits average USD 25,000-50,000 and include heat-pump installations now eligible for 30% tax incentives. Renovations frequently reach project values on par with new builds in land-constrained metros, effectively expanding construction workloads. Contractors that balance renovation and ground-up pipelines can mitigate cyclical swings, while specialized trades HVAC, insulation, and electrical, see sustained demand and wage premiums. The retrofit boom thus adds a secular layer to the US residential construction market growth profile.
Restraints Impact Analysis*
| Restraint | (~) % Impact on CAGR Forecast | Geographic Relevance | Impact Timeline |
|---|---|---|---|
| Skilled-labor shortages | -0.9% | National, with acute impacts in high-growth Sun Belt markets | Medium term (2-4 years) |
| Volatile material costs | -0.6% | National, with regional variations based on transportation costs | Short term (≤ 2 years) |
| Insurance-premium spikes in climate-risk zones | -0.4% | Coastal regions and wildfire-prone areas in West | Long term (≥ 4 years) |
| Water-scarcity building moratoriums | -0.3% | Southwest region, particularly Arizona and Nevada | Long term (≥ 4 years) |
| Source: Mordor Intelligence | |||
Skilled-Labor Shortages
Construction payrolls remain nearly 400,000 workers below their 2007 peak, inflating wages by 15-20% in fast-growing metros. Scarcity in specialized trades elongates schedules and forces builders to retain larger in-house teams or pay premium rates to subcontractors. Immigration policy uncertainty compounds regional gaps, particularly in Texas and Florida. These pressures accelerate investment in robotics, prefabrication, and 3-D printing, yet ramp-up periods limit near-term relief. Consequently, labor scarcity drags on projected output and margins across the US residential construction market.
Volatile Material Costs
Lumber prices have oscillated between USD 300 and 1,200 per thousand board feet since 2023, undermining cost visibility. Steel, concrete, and copper likewise swing on global supply disruptions and tariff shifts, adding 8-12% budget risk. Large public builders hedge with forward contracts, whereas small contractors absorb margin shocks or reprice jobs mid-cycle. Regional freight disparities further widen delivered-cost gaps, nudging development toward material-adjacent markets. Persistent volatility tempers risk appetite within the US residential construction market.
*Our forecasts treat driver/restraint impacts as directional, not additive. The impact forecasts reflect baseline growth, mix effects, and variable interactions.
Segment Analysis
By Type: Apartments Lead Urban Density Shift
Apartments and condominiums captured 39.15% of 2025 output, trailing single-family formats yet posting the segment’s fastest 6.02% CAGR to 2031, powered by zoning liberalization and institutional capital demand. Investor appetite for scale-ready, rent-generating assets and millennial preferences for walkable communities converge to lift multifamily pipelines in transit-oriented corridors. Projects increasingly integrate co-working lounges, EV-ready parking, and centralized package lockers to serve digital lifestyles.
Single-family construction adapts through smaller lots, paired homes, and community amenities that mimic urban convenience. Builders such as D.R. Horton have rolled out detached rental lines in Texas and Florida, reflecting cross-pollination between segments. Land availability and appraisal norms still anchor villas and landed houses at 60.85% of 2025 volume, but higher-density formats steadily chip away as municipalities pursue housing-supply mandates. Overall, product-mix evolution widens the addressable US residential construction market.


By Construction Type: Renovation Accelerates
New-build activity retained a 69.05% share in 2025, yet renovation projects expanded faster at a 5.61% CAGR on the back of aging stock and tax-credit support. Energy-retrofit packages, kitchen expansions, and accessory-dwelling-unit conversions push typical budgets above USD 75,000, rivaling entry-level new builds. Contractors specializing in occupied-home workflows gain pricing power and repeat business.
Project pipelines swell in legacy Northeast and Midwest neighborhoods where land scarcity curtails ground-up development. Builders such as Lennar have launched dedicated remodeling divisions to hedge cycle risk and meet customer demand. The robust retrofit niche, therefore, deepens the resilience of the US residential construction market size.
By Construction Method: Modern Techniques Gain Ground
Conventional on-site processes accounted for 84.95% of 2025 output, but modern methods, modular, panelized, and 3-D printed, are growing at a 7.62% CAGR to 2031. Off-site fabrication slashes on-site labor by up to 40% and curtails weather delays, appealing in high-wage and climate-variable regions.
Large national builders partner with tech startups to scale panel plants and robotic framing lines. HUD’s USD 600,000 research grants for 3-D printed homes in Alaska spotlight policy support. Although code acceptance and freight logistics still constrain adoption, modern techniques are poised to lift quality and speed, reinforcing productivity across the US residential construction industry.
By Investment Source: Private Capital Dominates
Private entities funded 91.92% of 2025 spending, but public investment is accelerating at a 6.63% CAGR via HUD grants and state housing bonds. Federal programs such as the USD 225 million PRICE initiative target manufactured-housing community upgrades, catalyzing contractor demand in affordability-constrained regions.
Public–private partnerships pair municipal land with builder expertise to meet inclusionary mandates. States like California layer tax-exempt bonds and density bonuses, while Florida leans on private BTR ecosystems. The blended financing mix enlarges the funnel of shovel-ready projects, enhancing liquidity across the US residential construction market.
Geography Analysis
The Southeast maintained a 41.12% share in 2025, buoyed by corporate relocations, population inflows, and pro-growth zoning. Florida’s metro corridors from Orlando to Tampa lead permit issuances, while Georgia and North Carolina attract logistics and tech employers that underpin housing demand. Streamlined approvals and abundant developable land allow large master-planned communities to scale rapidly, sustaining volume even amid credit-cycle noise.
In contrast, the West posts the fastest 5.71% CAGR through 2031 despite elevated regulatory overhead. California’s density mandates, Oregon’s duplex allowances, and Colorado’s water-conservation incentives reshape format mix toward townhomes and mid-rise apartments. Phoenix developers navigate water-availability tests yet still launch 10,000-plus unit pipelines, often leveraging modular-frame solutions to offset labor scarcity. Technology-sector wages in Seattle and Silicon Valley support premium pricing, cushioning margin risks from stringent green-building codes.
The Northeast’s resurgence shows 57.9% monthly and 109.3% year-over-year housing-start gains, reversing years of underbuilding. Pennsylvania’s chronic shortage triggers by-right approvals and infrastructure earmarks, while Massachusetts expands transit-oriented zoning to spur mixed-use blocks. Retrofits of pre-war housing in New York City and Boston absorb specialized trades, limiting labor leakage to new-build tracts. The Midwest and Southwest maintain steady trajectories near the national average, balancing affordability and available acreage without the boom-and-bust extremes seen elsewhere. Altogether, regional diversity distributes risk and opportunity across the US residential construction market.
Regulatory Landscape
Federal housing policy in 2026 focuses on speed, transparency, and density. The 21st Century ROAD to Housing Act became law in July 2026, authorizing HUD-led measures to expand NEPA exemptions for infill and rehabilitation and to modernize FHA loan limits. Executive Order 14394, issued March 13, 2026, directs HUD to publish best practices for state and local governments to remove administrative barriers, including wet-signature requirements.
Competitive Landscape
Competition remains fragmented, with regional specialists holding strong municipal relationships while national giants exploit scale advantages in land and procurement. D.R. Horton, Lennar, and PulteGroup leverage bulk-buy power to hedge commodity swings, whereas local firms win on bespoke design and customer intimacy. Technology adoption differentiates across the board: AI-driven estimating, VR sales tours, and BIM-enabled clash detection compress cycle times and error rates[3]U.S. Securities and Exchange Commission, “D.R. Horton 10-K,” sec.gov.
Strategic acquisitions accelerate consolidation; Sekisui House’s USD 4.9 billion purchase of M.D.C. Holdings created the fifth-largest builder and imported Japanese zero-energy techniques to U.S. sites. Asahi Kasei’s takeover of ODC Construction secures specialty framing capacity in Florida’s tight labor market. Simultaneously, boutique firms form land-bank JVs or convert to BTR specialists, catering to institutional mandates while avoiding volume race dynamics.
Product innovation also reshapes contestable ground. Manufactured-housing leaders roll out HUD-compliant models with site-built aesthetics, expanding affordability reach. Builders in wildfire zones adopt steel framing, cementitious siding, and fire-resistant landscaping to restore insurer confidence. Overall, competitive intensity pivots from sheer lot counts toward technology, risk management, and capital-partner alignment, a shift that strengthens the structural underpinnings of the US residential construction market.
US Residential Construction Industry Leaders
D.R. Horton
Lennar Corp.
PulteGroup
NVR
Taylor Morrison
- *Disclaimer: Major Players sorted in no particular order

Market Opportunities and Future Outlook
The ROAD to Housing Act supports federal grants tied to pattern books of preapproved housing designs, aimed at streamlining permitting. It also directs HUD to develop national guidelines and pilots for single-stair multifamily buildings up to six stories.
Separately, AI infrastructure investments create a $269B+ addressable market for construction in 2026. Against skilled-labor bottlenecks, modular and prefabricated systems are gaining traction, supporting premium pricing for standardized, high-quality components.
Recent Industry Developments
- July 2026: A leading US homebuilder reported fiscal 2026 third-quarter results, closing 84,655 homes in the last twelve months ending June 30, 2026. The result highlights scale and market momentum that can shape land strategy and supplier negotiations.
- July 2026: An all-cash proposal to acquire Beazer Homes USA for 32.00 per share was revised. The maneuver points to continued consolidation dynamics in the single-family homebuilding sector.
- June 2026: First America Homes expanded into the Dallas-Fort Worth market with the acquisition of 81 homesites at Leonard Trails, Anna, TX. This adds to its land pipeline in a growth corridor.


Research Methodology Framework and Report Scope
Market Definition and Coverage
This market covers the value of residential construction activity in the United States, including new build and renovation work that results in delivered housing structures and related on-site construction services across major US regions.
Scope exclusions: We exclude commercial buildings, civil infrastructure, and pure real estate transactions that do not represent construction or renovation work.
Segmentation Overview
- By Type
- Apartment & Condominiums
- Villas and Landed Houses
- By Construction Type
- New Construction
- Renovation
- By Construction Method
- Conventional On-Site
- Modern Methods of Construction (Prefabricated, Modular, etc)
- By Investment Source
- Public
- Private
- By Region
- Northeast (New York, Massachusetts, Pennsylvania, etc.)
- Midwest (Illinois, Ohio, Michigan, etc.)
- Southeast (Florida, Georgia, North Carolina, etc.)
- West (California, Washington, Colorado, etc.)
- Southwest (Texas, Arizona, New Mexico, etc.)
Data Sources, Market Sizing, and Validation
Desk Research
Desk research is used to set the measurable edges of the market and to build the first demand and activity picture that a model can stand on. We rely on public construction and housing time series and definitions from sources such as the US Census Bureau (housing starts, permits, and construction spending), the US Bureau of Labor Statistics (construction employment and cost inflation signals), and the US Bureau of Economic Analysis (macro and price deflators that impact value reporting).
To keep assumptions grounded, we also review sources such as HUD releases, Federal Reserve data on mortgage rates and credit conditions, and industry material from groups such as the NAHB for builder sentiment and pipeline indicators. In addition, company filings, investor presentations, and reputable press help validate pricing behavior, backlog trends, and mix shifts between single-family and multifamily activity. Where needed, paid subscriptions for company financials and intelligence, news and financials, and patent databases are used to cross-check large-project announcements, ownership structures, and technology adoption signals. These examples are illustrative, and many other sources were also referenced for data collection, validation, and research clarification.
Primary Interviews and Surveys
Primary work is used to pressure-test the desk assumptions and to fill gaps that do not show up cleanly in public tables, especially around renovation intensity, pricing pass-through, and regional mix. We speak with a spread of builders, specialty contractors, distributors, project managers, and housing ecosystem experts across the United States so the model reflects how work is actually contracted, delivered, and priced in different cycles.
Distribution of primary research fieldwork respondents
| Company type | Respondent position | Region |
|---|---|---|
| Top tier: 32% | CXOs: 12% | |
| Mid tier: 47% | Functional/Unit leaders: 36% | |
| Smaller Players: 21% | Managers: 52% |
Market-Sizing & Forecasting
For sizing, we start with a top-down build that reconstructs residential construction value using US housing activity signals and construction spending patterns, and then adjusts the total to match the defined residential-only boundary. The results are corroborated with selective bottom-up approximations, such as sampled ASP x volume checks by housing type and region, and supplier and channel checks that help confirm whether the implied pricing and workload are realistic.
The model is guided by practical inputs that can be tracked consistently over time, such as housing starts and building permits, construction put-in-place trends, mortgage rate direction and affordability signals, labor and materials cost movement, and the split between new construction and renovation activity. Where public data is not cleanly separated, for example renovation intensity within broader spending totals, we use interview-led correction factors and then re-check the outputs against independent indicators like builder sentiment and employment trends.
Forecasting is built using scenario analysis supported by variable-level expectations gathered in primary discussions, and it is anchored to the pace of permitting, starts, and expected cost inflation rather than a single macro assumption. When a local data series is thin or breaks due to reclassification, the gap is handled through short-run smoothing and by borrowing directionality from higher-frequency indicators, before the final totals are rebalanced back to the national picture.
Data Validation & Update Cycle
Validation is done through multiple passes that check math, direction, and real-world fit before results are finalized. We compare outputs against independent signals like permits-to-starts relationships, construction employment changes, and reported spending trends, and then investigate variances that look too large for the cycle stage or region mix.
If an anomaly is found, assumptions are revisited and, when needed, experts are re-contacted to confirm whether the change is structural or temporary. An internal review step is completed before sign-off so definitions, units, and currency treatment are consistent across the time series. Reports are refreshed annually, with interim updates for material events, and a final pre-delivery pass is completed so clients receive the latest updated view.
Mordor Intelligence's US Residential Construction Market Size Compared Against Other Published Estimates
It is normal to see different market values for US residential construction because publishers do not always count the same types of work, and they may not anchor the math to the same public activity series. Differences also come from how renovation is treated, whether regional mix is explicitly modeled, and whether values are reported in nominal dollars or adjusted for construction cost inflation.
By tracking housing starts and permits alongside construction spending series, and then refreshing renovation share and regional pricing assumptions through interview checks, Mordor Intelligence keeps the estimate tied to measurable US residential activity instead of broad building totals. The biggest gaps usually show up when a study mixes residential with non-residential construction, uses a single national average price without regional adjustment, or relies on older cost curves that do not match the current labor and materials environment.
Benchmark comparison
| Source | Market Size | Gaps in Research Methodology |
|---|---|---|
| Mordor Intelligence | USD 1.41 T (2026) | |
| Industry Association A | USD 1.32 T (2026) | Applies a narrower activity definition by emphasizing new construction pipelines, and it tends to undercount renovation value where spend is embedded in broader residential improvement totals. |
| Global Consultancy B | USD 1.55 T (2026) | Uses a wider boundary that blends adjacent construction categories and assumes faster price escalation, which inflates value when regional mix and cost pass-through are not re-validated for the year. |
The spread in published values is mainly explained by how renovation is captured, how strictly residential-only boundaries are enforced, and how pricing is updated for the current cycle. Our approach stays repeatable because each step can be traced back to observable housing activity and a small set of pricing and mix assumptions that are actively checked and rechecked.


Key Questions Answered in the Report
What is the current size of US residential construction in 2026?
Spending stands at USD 1.41 trillion in 2026.
What growth rate is forecast for US residential construction through 2031?
Total spending is projected to reach USD 1.76 trillion by 2031, translating into a 4.53% CAGR.
Which region leads US residential construction output?
The Southeast accounts for 41.12% of 2025 activity and maintains the top regional position.
Which product segment is expanding the fastest?
Apartments and condominiums are advancing at a 6.02% CAGR through 2031, outpacing all other formats.
How much of total spending is funded by private capital?
Private investors provide 91.92% of 2025 outlays, making them the dominant funding source.
Which construction method is gaining ground the quickest?
Modern methods of construction—such as modular and panelized building—are growing at a 7.62% CAGR through 2031.
Page last updated on:


