
United States Mortgage/Loan Brokers Market Size and Share
Market Overview
| Study Period | 2020 - 2031 |
|---|---|
| Forecast Data Period | 2026 - 2031 |
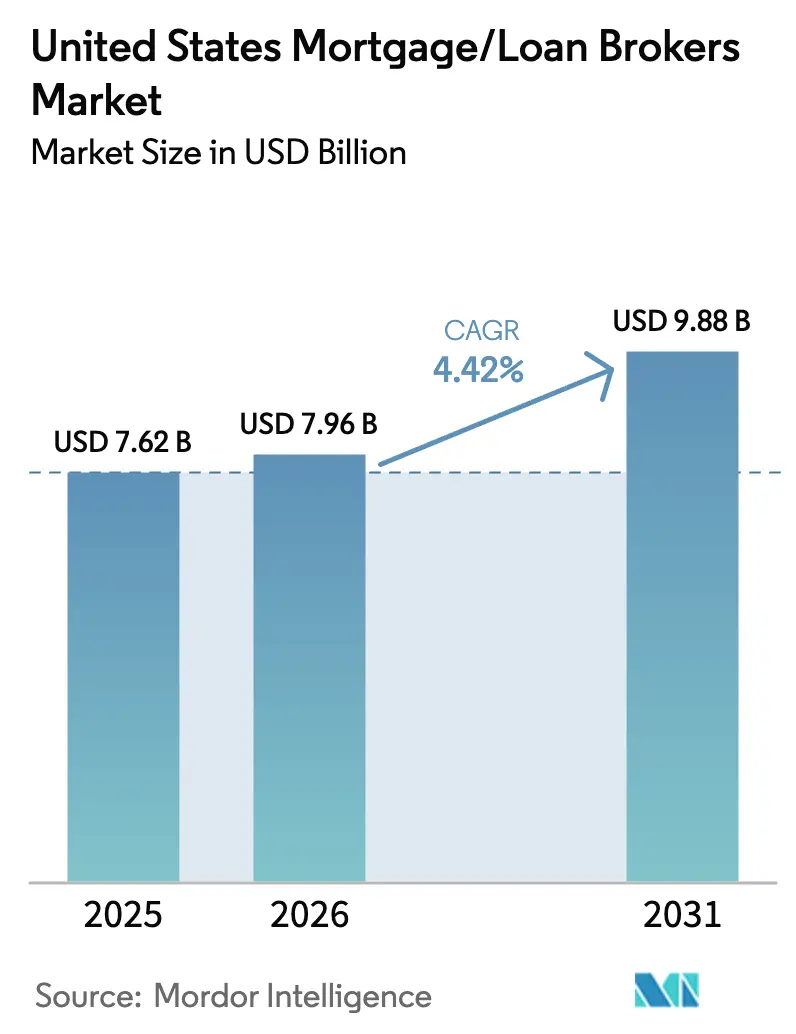
| Base Year Market Size (2025) | USD 7.62 Billion |
| Market Size (2026) | USD 7.96 Billion |
| Market Size (2031) | USD 9.88 Billion |
| Growth Rate (2026 - 2031) | 4.42 % |
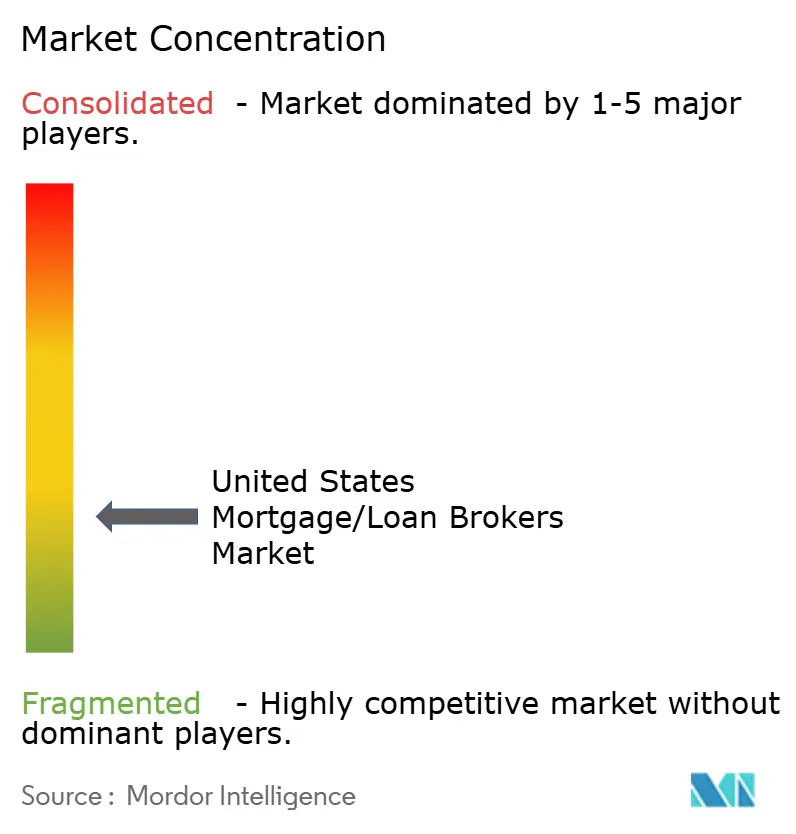
| Market Concentration | Low |
Major Players *Disclaimer: Major Players sorted in no particular order Image © Mordor Intelligence. Reuse requires attribution under CC BY 4.0. | |
United States Mortgage/Loan Brokers Market Analysis by Mordor Intelligence
The United States mortgage/loan brokers market size is expected to grow from USD 7.62 billion in 2025 to USD 7.96 billion in 2026 and is forecast to reach USD 9.88 billion by 2031 at 4.42% CAGR over 2026-2031. This growth trajectory reflects brokers’ ability to remain relevant despite rising compliance costs and rapid digitization, enabling them to bridge borrowers and a fragmented lender landscape. Technology adoption is no longer optional, as 79% of mortgage professionals identify eClosing capabilities as a critical differentiator, while 72% believe artificial intelligence (AI) will reshape lending workflows. Demographic momentum also underpins demand: millennials are now the largest group of homebuyers and, at a median age of 38, often require specialized guidance on down-payment assistance and alternative income documentation[1]. Wholesale lenders have deepened ties with brokers, illustrated by United Wholesale Mortgage’s technology-heavy, broker-first model, which accelerates approvals and improves pricing. Interest-rate volatility that pushed 30-year fixed rates toward 7% in 2024 has re-weighted business toward purchase loans, but it also created openings for niche products such as renovation and construction-to-permanent mortgages.
Key Report Takeaways
- By loan type, conventional conforming mortgages led with 64.12% of the United States mortgage/loan brokers market share in 2025, whereas non-qualified products are projected to grow at a 4.75% CAGR through 2031.
- By borrower profile, repeat and second-home buyers accounted for 44.05% share of the United States mortgage/loan brokers market size in 2025; real-estate investors represent the fastest-growing group at 5.53% CAGR.
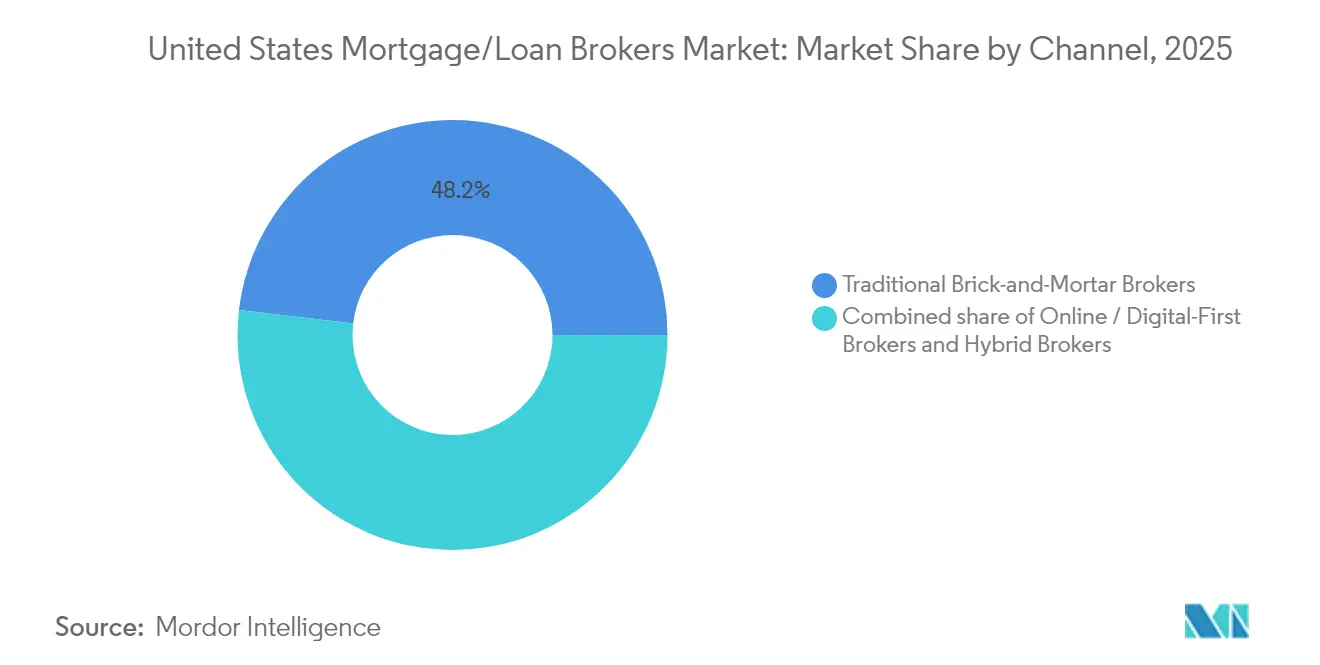
- By distribution channel, brick-and-mortar brokers held 48.15% revenue share in 2025, while online and digital-first brokers are expected to expand at a 4.90% CAGR to 2031.
Note: Market size and forecast figures in this report are generated using Mordor Intelligence’s proprietary estimation framework, updated with the latest available data and insights as of 2026.
Market Trends and Insights
Drivers Impact Analysis of United States Mortgage/Loan Brokers Market*
| Driver | (~) % Impact on CAGR Forecast | Geographic Relevance | Impact Timeline |
|---|---|---|---|
| Demographic tailwind of millennial home-buyers | +0.8% | National, with concentration in metropolitan areas | Medium term (2-4 years) |
| Persistent low-to-moderate mortgage rates | +0.6% | National | Short term (≤ 2 years) |
| Expansion of wholesale lender programs for brokers | +0.7% | National, with stronger impact in competitive markets | Medium term (2-4 years) |
| Digitisation lowering application friction | +0.5% | National, with faster adoption in tech-forward regions | Long term (≥ 4 years) |
| AI-driven pre-qualification tools raising broker conversion | +0.4% | National, with early gains in major metropolitan areas | Medium term (2-4 years) |
| Growing demand for green-home mortgage products | +0.3% | West Coast, Northeast, and environmentally conscioUnited States markets | Long term (≥ 4 years) |
| Source: Mordor Intelligence | |||
Demographic tailwind of millennial buyers
Millennials are reaching prime purchase age and already form the largest cohort of homebuyers, yet affordability challenges have lifted the median first-time-buyer age to 38. These borrowers gravitate toward brokers for help with down-payment grants, non-traditional income verification, and nuanced lender comparisons. Their preference for digital processes dovetails with broker investments in mobile apps and eClosing portals, shortening approval cycles and reducing fallout. Because many millennials buy in high-cost metros, demand for jumbo and non-conforming loans rises, allowing brokers to command premium fees. Persistent student-debt burdens and variable gig-economy income further heighten reliance on broker guidance.
Expansion of wholesale-lender programs for brokers
Nonbank lenders captured 83.2% of agency originations by late 2024 and rely on brokers as cost-effective distribution partners[2]. United Wholesale Mortgage’s AI-enabled broker tools illustrate how deeper technology integration can cut time-to-close and sharpen pricing. Larger menus, marketing subsidies, and compliance resources from wholesale lenders make it easier for small and midsize brokers to compete with direct-lending fintechs. Heightened competition among wholesalers has improved broker compensation and service-level agreements. These enhancements reinforce the perceived value of brokers in complex loan scenarios.
AI-driven pre-qualification tools raising broker conversion
A 2024 survey showed 72% of mortgage executives consider AI transformative for underwriting and lead conversion. AI engines instantly parse credit, employment, and income data to determine eligibility, enabling brokers to deliver same-day conditional approvals. Machine-learning models flag documentation gaps early, allowing borrowers to resolve issues before lock expiration. Self-employed applicants benefit because algorithms evaluate cash-flow consistency rather than traditional W-2s. As subscription prices drop, even boutique brokers can deploy predictive analytics, closing the technology gap with nationwide players.
Growing demand for green-home mortgage products
Government-sponsored enterprises now buy loans under programs such as HomeStyle Energy, which funds energy-efficiency upgrades at concessional rates[3]. State and municipal incentives amplify savings, motivating eco-conscious buyers in California, Massachusetts, and Washington to seek specialized financing. Brokers versed in green certifications and rebate stacks can monetize advisory roles while enhancing borrower affordability through lower utility bills. Millennials and Gen Z consumers express strong preferences for sustainable housing finance, aligning demographic and environmental tailwinds. Rising energy-efficiency premiums in home values further cement this niche.
Restraints Impact Analysis of United States Mortgage/Loan Brokers Market*
| Restraint | (~) % Impact on CAGR Forecast | Geographic Relevance | Impact Timeline |
|---|---|---|---|
| Heightened CFPB & state regulatory scrutiny | -0.9% | National, with varying state-level intensity | Short term (≤ 2 years) |
| Interest-rate volatility suppressing refinance volume | -1.2% | National | Short term (≤ 2 years) |
| Fintech direct-lending models bypassing brokers | -0.6% | National, with stronger impact in tech-savvy demographics | Medium term (2-4 years) |
| Rising cyber-security & data-compliance costs | -0.4% | National, with higher impact on smaller brokers | Short term (≤ 2 years) |
| Source: Mordor Intelligence | |||
Interest-rate volatility is suppressing refinance volume.
Thirty-year fixed rates hovered near 7% throughout 2024, erasing most conventional refinance incentives. Brokers that once relied on serial refis now chase purchase business, which typically requires deeper borrower counseling and higher acquisition costs. Rate locks became pricier, and indecisive borrowers often delay closings, shrinking pipelines. With existing-home sales down and new-construction starts unpredictable, competition for purchase leads intensifies among brokers and fintechs alike. Firms must pivot to niche products such as renovation, DSCR, or reverse mortgages to stabilize revenue.
Heightened CFPB & state regulatory scrutiny
The Consumer Financial Protection Bureau has broadened examinations of nonbank mortgage companies, levying multimillion-dollar penalties for pricing discrimination and disclosure lapses[4]. Many states added licensing tiers and cybersecurity mandates, forcing brokers to expand compliance staff or outsource costly legal reviews. FHA also shortened incident-reporting windows for cyberbreaches, raising technology overhead. Smaller independents struggle to absorb these expenses, accelerating consolidation toward capital-rich networks. Documentation creep lengthens processing times, eroding profitability for volume-based brokers.
*Our forecasts treat driver/restraint impacts as directional, not additive. The impact forecasts reflect baseline growth, mix effects, and variable interactions.
United States Mortgage/Loan Brokers Market Segment Analysis
By Loan Type:
Conforming anchors volume while specialty loans outpaceConventional conforming mortgages represented 64.12% of the United States mortgage/loan brokers market share in 2025, supported by standardized underwriting and liquidity from the secondary market. The United States mortgage/loan brokers market size for conforming products is projected to reach USD 6.34 billion by 2031, mirroring steady demand for mainstream financing. Jumbo and non-conforming loans thrive in metros where median prices surpass federal limits, allowing brokers to capture higher fees on complex files. FHA, VA, and USDA loans remain essential for underserved or rural borrowers, expanding broker reach into niche geographies. Rate shifts have bolstered renovation and construction-to-permanent loans, enabling owners to upgrade existing homes rather than move.
Specialty products—non-qualified mortgages, reverse, renovation, and construction-to-permanent loans—are growing at a 4.75% CAGR, the fastest among all loan types. Flexible underwriting appeals to self-employed borrowers and investors who cannot meet agency guidelines yet exhibit strong cash flow. Reverse mortgages gain traction as baby boomers monetize equity without monthly payments, a trend brokers exploit through senior-focused advisory practices. Renovation financing satisfies demand amid tight housing supply, merging purchase and rehab funds into a single closing. Because these loans carry wider spreads, brokers can offset shrinking refi volume and enhance profitability.


By Borrower Type:
Investor appetite widens broker scopeRepeat and second-home buyers controlled 44.05% of the United States mortgage/loan brokers market share in 2025, reflecting equity-rich owners upgrading or adding vacation properties. Investors, however, exhibit a robust 5.53% CAGR through 2031, buoyed by cash-flow-based DSCR products that evaluate rental income over personal debt-to-income ratios. The United States mortgage/loan brokers market size for investor lending is forecast to cross USD 1.73 billion by 2031. Brokers adept at analyzing rent rolls and cap rates can differentiate themselves in this segment. First-time-buyer activity remains constrained by down-payment hurdles and high prices, yet targeted assistance programs present advisory opportunities.
Investor momentum fuels the development of portfolio loans and fix-and-flip credit lines, forcing brokers to master valuation techniques and exit strategies. Seniors increasingly consider reverse mortgages to supplement retirement, demanding specialized counseling and compliance safeguards. Refinancing borrowers have largely vanished given current rates, compelling brokers to re-tool lead-generation strategies from database recapture to purchase-centric prospecting. Each borrower archetype carries unique disclosure and licensing requirements, underscoring the need for segment-specific expertise. Successful brokers segment marketing by lifecycle stage to optimize conversion.
By Channel:
Digital acceleration re-shapes service modelsBrick-and-mortar brokers still generated 48.15% of 2025 volume, underpinned by local referral networks and face-to-face interactions that resonate in complex transactions. Yet the fastest-growing route is digital-first, projected at 4.90% CAGR as tech-savvy borrowers favor online self-service portals. The United States mortgage/loan brokers market size tied to digital channels could exceed USD 4.46 billion by 2031. Hybrid models that blend physical presence with end-to-end digital workflows are emerging as best practice, offering convenience without sacrificing human touch. High-volume digital brokers leverage AI chatbots and automated verifications to cut cycle times to under 15 days.
Regulatory parity across channels keeps compliance burdens similar, but digital operators shoulder extra cybersecurity and e-signature duties. Cost advantages from leaner footprints let pure-play online brokers price aggressively, pressuring traditional shops to modernize. Conversely, complex jumbo or construction loans often revert to relationship-heavy models, preserving relevance for community-based brokers. The channel shift also broadens geographic reach, enabling digital brokers licensed in multiple states to capture demand spikes irrespective of physical location. Investment in omnichannel capabilities will likely define future winners.
Geography Analysis
Regional dynamics remain pivotal for the United States mortgage/loan brokers market, with high-cost metros on the coasts producing elevated average loan balances that boost commission revenue. California, New York, and Washington, D.C. require jumbo expertise and non-conforming solutions, translating into larger per-file earnings for brokers familiar with complex underwriting. Environmental ordinances in California also drive demand for green mortgage products, reinforcing brokers that specialize in energy-efficient lending. Regulatory overlays add another dimension; California’s additional licensing and disclosure rules heighten entry barriers for out-of-state firms, indirectly concentrating share among compliant incumbents.
The Southeast, led by Texas and Florida, benefits from inbound migration and relatively affordable housing, generating brisk purchase activity. Population inflows sustain demand for FHA and VA loans, while robust rental markets attract investors seeking DSCR financing. These states feature business-friendly regulations and lower closing costs, allowing brokers to operate with thinner margins yet higher volume. Rural regions across the Midwest and Great Plains lean on USDA programs, rewarding brokers versed in government-backed lending and property eligibility mapping. Though transaction counts are lower, brokers build durable relationships through personalized service.
Interest-rate sensitivity varies by region; Sunbelt markets witness stronger purchase resilience, whereas high-tax Northeastern states saw sharper volume contractions when rates climbed. Tech-sector exposure on the West Coast introduces cyclical demand swings tied to employment volatility. Local zoning and appraisal norms further complicate underwriting, emphasizing the need for geographic mastery. Brokerages expanding via remote-licensing strategies must still invest in regional compliance and appraiser networks to maintain service quality. Ultimately, regional heterogeneity underscores why national brands pair centralized technology with localized expertise.
Regulatory Landscape
Mortgage and loan broker activity in the United States is governed by overlapping federal and state requirements that shape licensing, disclosures, and ongoing supervision. At the federal level, key compliance anchors include TILA and RESPA, and the Consumer Financial Protection Bureau (CFPB) has increased its focus on nonbank and mortgage-company examinations in recent years, including findings tied to disclosure and fair-lending controls, as reflected in its 2024 supervisory highlights. State mortgage-broker licensing regimes add further operational overhead, while agencies and prudential regulators continue to emphasize mortgage-banking risk management expectations for supervised entities.
The policy environment shifted in 2026, with Executive Order 14393 (March 2026) directing regulators to prioritize access to mortgage credit and consider removing duplicative requirements. The CFPB’s 2026 agenda also signals more emphasis on revisiting existing rules and reducing compliance cost burdens rather than launching new initiatives. Litigation and enforcement risk remains a practical constraint for market participants, with disputes involving large originators such as CrossCountry Mortgage drawing attention to closing-table rate disclosure and fee-transparency practices under state UDAP statutes and federal frameworks including TILA, RESPA, and FCRA, reinforcing the need for tight broker controls across lead generation, pricing, and third-party settlement services.
Value Chain Analysis
The mortgage broker value chain connects borrower acquisition and advisory work to a multi-party origination stack that includes wholesale lenders, settlement-service providers, and secondary-market outlets. Brokers typically source leads through real-estate agent referrals, builders, digital marketing, and relocation channels, then route applications to lenders while coordinating underwriting, appraisal, title, and closing. Technology platforms supporting POS (point-of-sale), income/employment verification, eClose, and document collection increasingly sit at the center of execution. Cost and latency in data and verification remain friction points, and industry estimates put ecosystem data-related spend (credit, property/MLS, tax, and verification services) at about USD 31 billion annually, which is pushing workflow automation and vendor consolidation.
Downstream, funded loans move into either portfolio retention or securitization, followed by servicing (payment processing, escrow, loss mitigation, and customer retention), where control of MSRs can affect recapture and cross-sell economics. Vertical integration into servicing has become more visible, including CrossCountry Mortgage’s move to expand internal servicing capacity through the RoundPoint platform tied to its Two Harbors transaction, tightening the loop between origination, servicing, and retention. For brokers, the chain also depends on wholesaler support, including pricing engines, scenario desk, and compliance resources, as well as the performance of third-party partners such as appraisers and title/settlement firms, making service-level reliability and data security key determinants of cycle time and pull-through.
Competitive Landscape
The United States mortgage/loan brokers market is moderately fragmented but moving toward consolidation as compliance and technology costs climb. Rocket Companies set a transformative precedent by acquiring Redfin for USD 1.75 billion and proposing a USD 9.4 billion takeover of Mr. Cooper, creating an end-to-end real-estate-to-servicing ecosystem. Such vertical integration pressures stand-alone brokers to partner with prop-tech platforms or risk disintermediation. Three strategic archetypes dominate: tech-centric brokers deploying AI and e-close stacks, regional specialists serving high-value metros, and integrated real-estate brands bundling search, agency, and loan origination.
United Wholesale Mortgage exemplifies a broker-aligned wholesaler, rolling out the ChatUWM AI platform that automates borrower Q&A and document intake. Guaranteed Rate reinforced its sales force by onboarding veteran loan officers from rivals, a talent-acquisition play responding to contracting origination volumes. Fintech challengers such as Better.com advance embedded-finance APIs that let builders or real-estate portals offer point-of-sale mortgages, sidestepping traditional brokers. In response, networks like AIME (Association of Independent Mortgage Experts) provide compliance and technology toolkits at scale, helping independents retain autonomy.
Size now confers regulatory insulation; larger brokerages spread fixed compliance costs over higher volume and invest in cyber-defense. Smaller shops combat scale disadvantages by niching into reverse mortgages, non-QM lending, or multicultural markets. Pricing competition remains intense, yet service differentiation—human guidance on complex files—still commands loyalty. Market share is fluid as lenders recalibrate pricing and repurchase risk, underscoring brokers’ role as borrower advocates shopping multiple outlets. The next consolidation wave may hinge on AI adoption rates and capital access.
United States Mortgage/Loan Brokers Industry Leaders
-
CrossCountry Mortgage, LLC
-
Fairway Independent Mortgage Corporation
-
Guaranteed Rate, Inc.
-
Guild Mortgage Company
-
Caliber Home Loans, Inc.
- *Disclaimer: Major Players sorted in no particular order
United States Mortgage/Loan Brokers Market Companies Covered in this Report
- CrossCountry Mortgage, LLC
- Fairway Independent Mortgage Corporation
- Guaranteed Rate, Inc.
- Guild Mortgage Company
- Caliber Home Loans, Inc.
- NFM Lending
- C2 Financial Corporation
- loanDepot, Inc.
- Finance of America Mortgage LLC
- Movement Mortgage, LLC
- United Wholesale Mortgage (UWM)
- Rocket Pro TPO
- AmeriSave Mortgage Corporation
- Freedom Mortgage Corporation
- PRMG, Inc. (Paramount Residential Mortgage Group)
- Cornerstone Home Lending
- Planet Home Lending
- New American Funding
- Cardinal Financial Company
- Draper and Kramer Mortgage Corp.
Read Analysis of United States Mortgage/Loan Brokers Companies
Market Opportunities and Future Outlook
Opportunity is building around product and process niches where broker advice and lender choice can materially affect borrower outcomes. Manufactured housing financing is one area of whitespace following the enactment of the 21st Century ROAD to Housing Act (H.R. 6644) in July 2026, which introduced parity standards and removed the permanent chassis requirement for FHA-insured channels. That change expands the addressable set of homes that can fit conventional mortgage pathways. Brokers that build specialized lender panels, appraisal and title playbooks, and borrower education for manufactured housing can differentiate in a segment where eligibility interpretation and property standards are central to approval outcomes.
Market structure is also shifting toward platforms that connect origination with servicing and retention, changing how leads are priced and how repeat business is captured. CrossCountry Mortgage’s planned acquisition of Two Harbors Investment Corp. (all-cash, expected to close in August 2026) expands internal servicing scale, which points to larger originators and broker-adjacent firms investing across the loan lifecycle rather than competing only at the point of sale. Separately, the March 2026 Executive Order 14393 and the CFPB’s 2026 posture toward revisiting rules and reducing duplicative burdens create room for brokers and wholesalers to expand offerings where compliance intensity previously constrained throughput, including non-QM and specialty underwriting, provided firms reinforce controls around disclosures, fee transparency, and fair-lending governance.
Recent Industry Developments in United States Mortgage/Loan Brokers Market
- July 2026: Fairway Independent Mortgage Corporation launched Fairway SAFE, an initiative focused on protecting seniors from financial exploitation. The program aligns with growing reverse-mortgage and senior-borrower advisory activity, giving the company a clearer trust and compliance-oriented positioning in a tightly scrutinized borrower segment.
- May 2026: CrossCountry Mortgage reaffirmed and improved the economics of its Two Harbors transaction through updates to the merger terms, continuing its push to expand servicing-linked capabilities tied to the RoundPoint platform. The move supports scale advantages in retention and recapture while raising the competitive bar for broker and lender networks that rely on third-party servicing infrastructure.
- April 2026: Two Harbors Investment Corp. and CrossCountry Mortgage announced an amended merger agreement that increased the per-share cash consideration to USD 11.30. The revised terms helped keep the deal on track and highlighted continued consolidation activity that connects origination capacity with MSR and servicing assets.
United States Mortgage/Loan Brokers Market Report Scope and Research Methodology
Market Definition and Coverage
This market covers the fees and commissions earned by mortgage and loan brokers in the United States for arranging mortgage loans between borrowers and lenders, spanning both purchase and refinance activity, and reported in USD value.
Scope exclusions: Direct mortgage lending revenue, servicing income, and title, appraisal, insurance, and other settlement services are excluded unless they are billed as a broker fee.
Segments Covered in This Report
- By Loan Type (Value)
- Conventional Conforming
- Non-Conforming / Jumbo
- FHA-Insured
- VA-Guaranteed
- USDA / Rural Housing
- Others (Non-QM, Reverse Mortgage,Renovation, Construction-to-Perm)
- By Borrower Type (Value)
- First-time Home Buyers
- Repeat & Second Home Buyers
- Real-Estate Investors
- Others (Refinance Borrowers,Seniors / Reverse Borrowers)
- By Channel (Value)
- Online / Digital-First Brokers
- Traditional Brick-and-Mortar Brokers
- Hybrid Brokers
Data Sources, Market Sizing, and Validation
Desk Research
Desk research is used to set the market boundary, define the demand pool, and build the first version of the model inputs that we later check through interviews. We mainly rely on public housing and mortgage activity series, such as U.S. Census Bureau housing statistics, the Federal Reserve Economic Data series, and Consumer Financial Protection Bureau mortgage datasets that reflect origination patterns.
To tighten the assumptions, we also review sources like U.S. Bureau of Labor Statistics employment and wage data for loan officers and related roles, government-sponsor enterprise publications on mortgage market trends, and trade association releases that discuss broker channel activity and borrower behavior. Company filings, investor presentations, and reputable financial press are screened to understand pricing practices, sensitivity to rate cycles, and product-mix changes. Where needed, we validate corporate-level benchmarks and patent signals through approved paid databases for company financials, news, and patents. These desk sources are illustrative, and we use additional public and paid references to cross-check data points and resolve definitional issues.
Primary Interviews and Surveys
Primary work focuses on confirming how broker fees are charged and recognized, how the mix of purchase versus refinance changes broker revenue, and how lenders and wholesale channels influence paid compensation. We speak with a mix of broker owners, branch managers, operations leaders, and lending-side stakeholders, keeping the discussions US-focused but balanced across large metro areas and smaller markets so pricing and volume differences are not missed. When gaps appear in public data, these interviews help us choose realistic ranges for broker penetration, funded loan counts, and the timing of rate-driven demand shifts.
Distribution of primary research fieldwork respondents
| Company type | Respondent position |
|---|---|
| Top tier: 26% | CXOs: 12% |
| Mid tier: 53% | Functional/Unit leaders: 32% |
| Smaller Players: 21% | Managers: 56% |
Market-Sizing & Forecasting
We build the market using a top-down logic that reconstructs the broker revenue pool from mortgage origination activity and channel participation, then translates that into broker-paid fee value for the year. In practice, the model starts with indicators like total home purchase versus refinance volumes, rate-driven application swings, and the broker share of originations, which are then converted into revenue using broker compensation assumptions.
To keep the totals realistic, the outputs are corroborated with selective bottom-up checks, including sampled fee ranges from disclosures and public commentary, channel checks on typical basis point compensation, and sanity checks against the scale of broker establishments and staffing. Key inputs in the model include mortgage rate levels and spreads, housing turnover signals, loan type mix (conforming versus jumbo and other categories), and the share of production that runs through wholesale and broker channels. For forecasting, we typically apply scenario analysis around rate paths and housing activity, then smooth the trajectory using a time-series approach when the historical pattern is stable, with the final curve adjusted to what primary respondents expect for fee pressure and volume recovery. When a bottom-up check is incomplete, the gap is handled using conservative ranges and then narrowed through re-contacts and additional desk checks.
Data Validation & Update Cycle
Model outputs are checked against independent signals, including directionally matching origination volumes, broker channel commentary, and observed fee behavior during similar rate periods. Outliers are flagged, and the drivers are reviewed step-by-step so we can determine whether the issue comes from a volume assumption, a mix shift, or a pricing input.
Before sign-off, the work goes through multi-step internal reviews, and interview callbacks are triggered when a key variable moves outside the expected band. Reports are refreshed annually, with interim updates when major policy, rate, or housing market events change the demand picture. Right before delivery, we do a final pass to ensure the latest public releases and any new interview learning are reflected in the numbers.
Mordor Intelligence's US Mortgage Brokers Market Size Versus Other Published Estimates
Published market sizes for US mortgage brokers often look different because the boundary is not always treated the same, and the same term can cover either pure brokerage fees or a wider loan intermediation revenue pool. Differences also come from how refinance cycles are handled, the assumed broker share of originations, and the way fee rates are carried forward during fast rate changes.
Key gap drivers usually come down to whether a source links the revenue pool to observable origination and housing activity signals, and whether fee assumptions are updated to match the current mix of loan types and channels. Some estimates also blend mortgage brokers with broader loan brokerage lines under NAICS-style coverage, which can push totals up if non-mortgage products are included. Timing matters too, because FX is not relevant here, but the chosen base year and refresh cadence can shift results when volume is moving quickly.
Benchmark comparison
| Source | Market Size | Gaps in Research Methodology |
|---|---|---|
| Mordor Intelligence | USD 7.62 B (2025) | |
| Industry Data Provider A | USD 17.10 B (2022) | Uses an industry revenue construct aligned to NAICS 52231 style coverage, which can include non-mortgage loan brokerage revenue and a wider establishment set, and it is anchored to an older census baseline year. |
| Sector Publication B | USD 9.10 B (2026) | Maps the category to a broader loan brokers definition and applies a near-term revenue cycle view that can overweight rate-driven volume swings and does not clearly separate broker-only fee income from adjacent intermediation services. |
Origination trend lines, broker channel share checks, and fee rate benchmarks are the anchors that keep Mordor Intelligence tied to mortgage-broker fee income rather than broader loan brokerage revenue. When scope and year are aligned, the spread typically narrows, and the remaining difference is mostly explained by how fee rates and channel mix are projected through the rate cycle.
Key Questions Answered in the Report
What is the projected size of the United States mortgage/loan brokers market in 2031?
It is forecast to reach USD 9.88 billion by 2031, reflecting a 4.42% CAGR from 2026.
Which loan category is expanding fastest?
Non-qualified mortgages, including reverse, renovation, and construction-to-permanent loans, are growing at a 4.75% CAGR.
Why are investors an attractive segment for brokers?
Investor demand is driven by DSCR loans that qualify based on rental income, propelling a 5.53% CAGR through 2031.
How are digital-first brokers affecting competition?
They cut cycle times with AI and eClose tools, growing at a 4.90% CAGR and pressuring traditional shops to modernize.
What regulatory trend is most challenging for brokers?
Heightened CFPB and state scrutiny increases compliance costs, disadvantaging smaller independents and accelerating consolidation.