
Market Overview
| Study Period | 2021 - 2031 |
|---|---|
| Forecast Data Period | 2026 - 2031 |
| Historical Data Period | 2021 - 2024 |
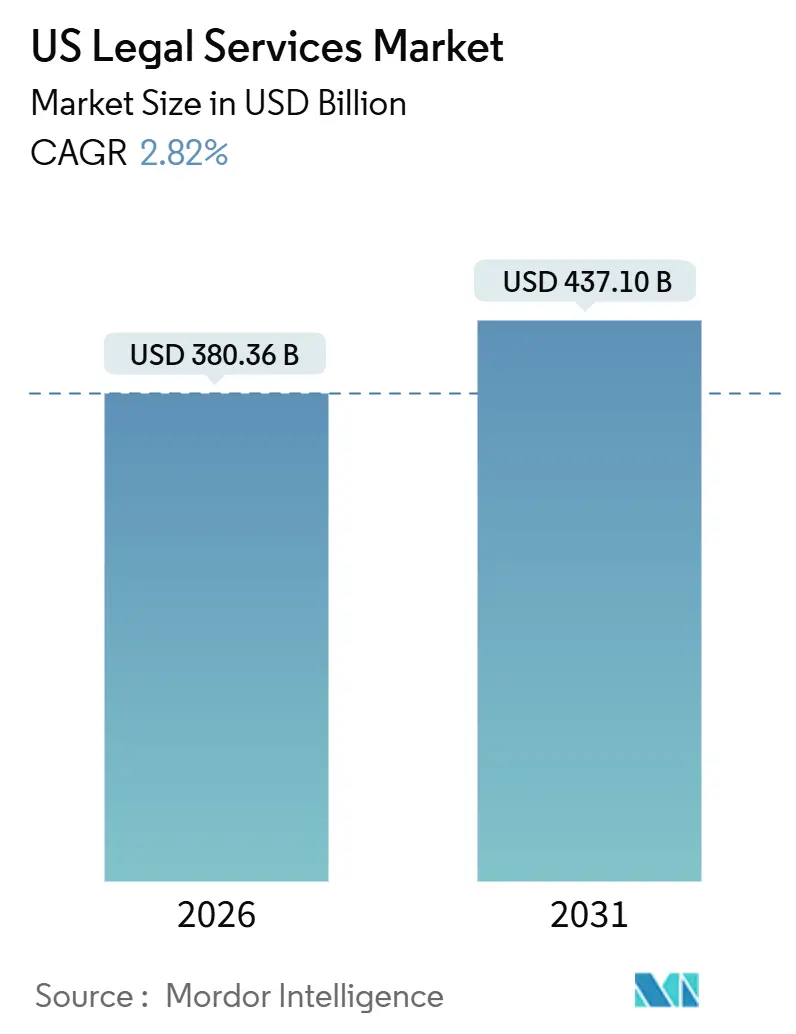
| Market Size (2026) | USD 380.36 Billion |
| Market Size (2031) | USD 437.10 Billion |
| Growth Rate (2026 - 2031) | 2.82 % |
| Market Concentration | Low |
Major Players *Disclaimer: Major Players sorted in no particular order Image © Mordor Intelligence. Reuse requires attribution under CC BY 4.0. | |
United States Legal Services Market Analysis by Mordor Intelligence
The United States legal services market size is USD 380.36 billion in 2026 and is projected to reach USD 437.10 billion by 2031, reflecting a 2.82% CAGR through the forecast period. Growth in the United States legal services market is shaped by competing forces that include the shift toward subscription-based models, the buildup of in-house teams, and deepening demand for counsel on complex transactions and disputes. Corporate clients are pushing for outcome-based pricing and digital convenience while reserving premium billable hours for high-stakes matters that require specialized expertise. Alternative Legal Service Providers offer cost efficiency for standardized tasks, creating a complementary layer for e-discovery, document review, and contract support. The surge in fully digital service delivery and broader adoption of remote legal workflows is shifting how firms attract and retain clients in the United States legal services market.
Key Report Takeaways
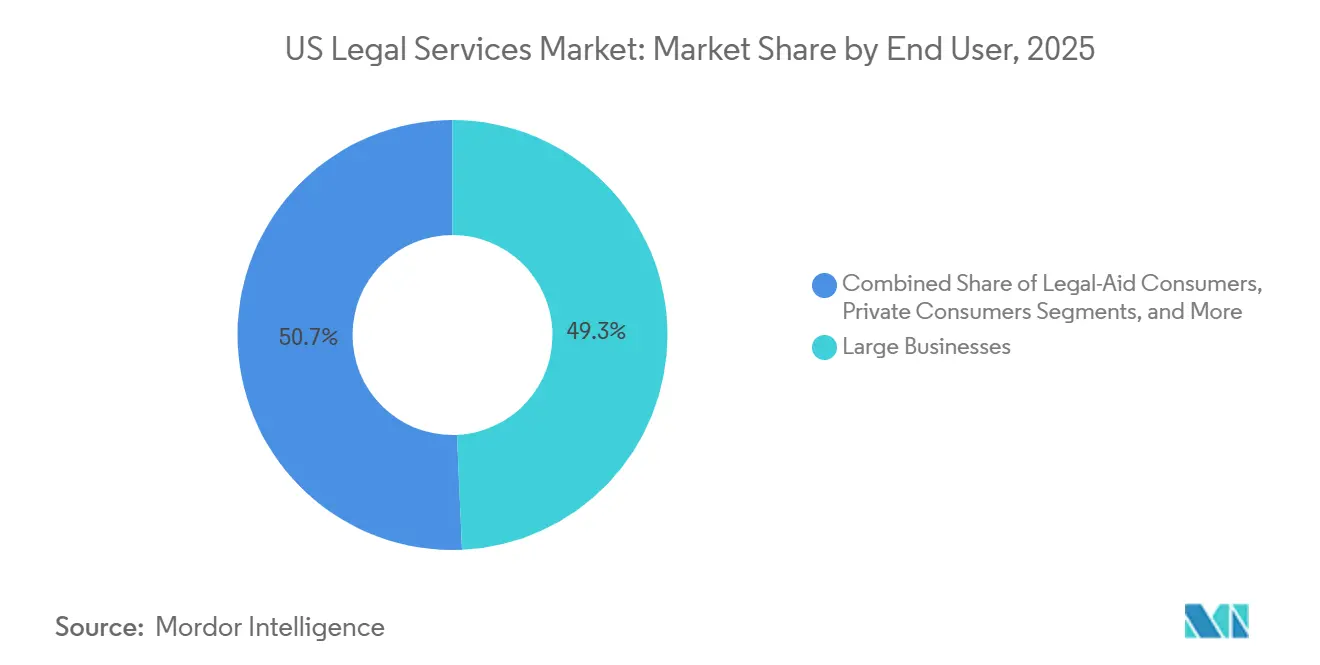
- By end-user, Large Businesses led with 49.31% of the United States legal services market share in 2025, while SMEs are projected to record the highest growth with a 3.61% CAGR through 2031.
- By application, Corporate, Financial, and Commercial Law held 43.52% of the United States legal services market share in 2025, and Other Applications are forecast to expand at a 4.57% CAGR within the United States legal services market size through 2031.
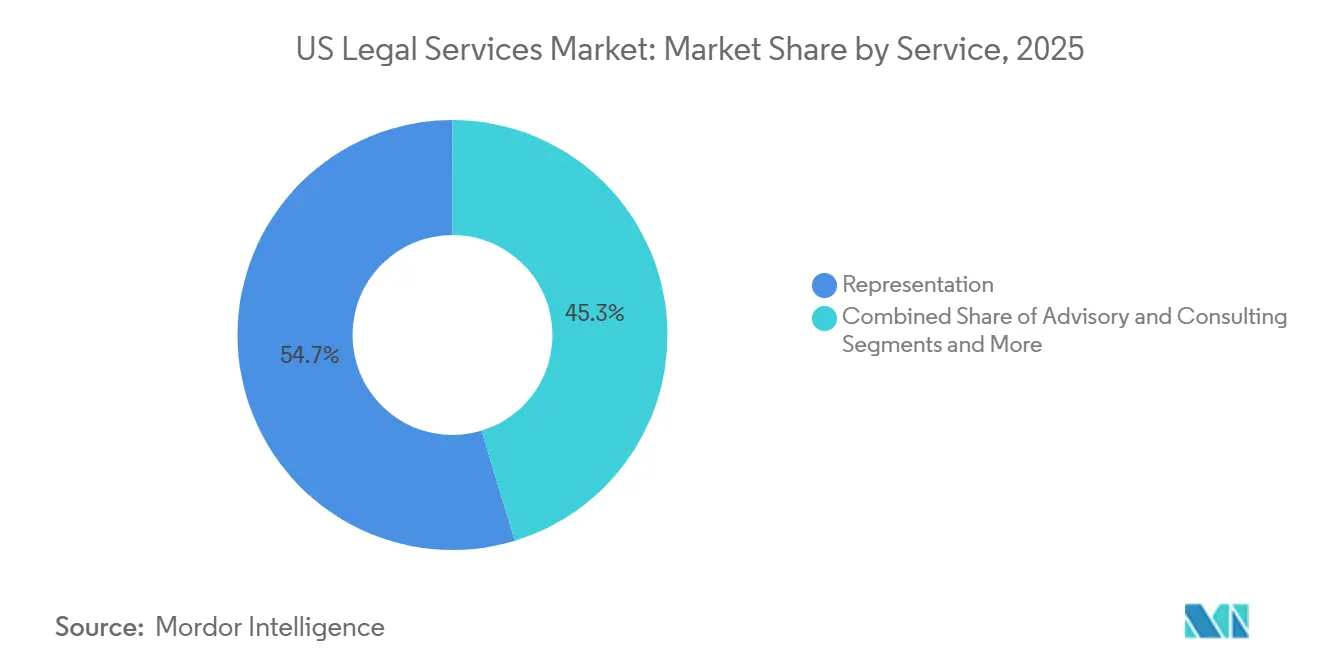
- By service, Representation captured 54.66% of the United States legal services market share in 2025, while Legal Research and Support Services are projected to post the fastest growth at a 4.23% CAGR within the United States legal services market.
- By mode of delivery, Traditional In-Person accounted for 70.42% of the United States legal services market share in 2025, while Fully Digital or Virtual delivery is projected to grow at a 6.13% CAGR within the United States legal services market.
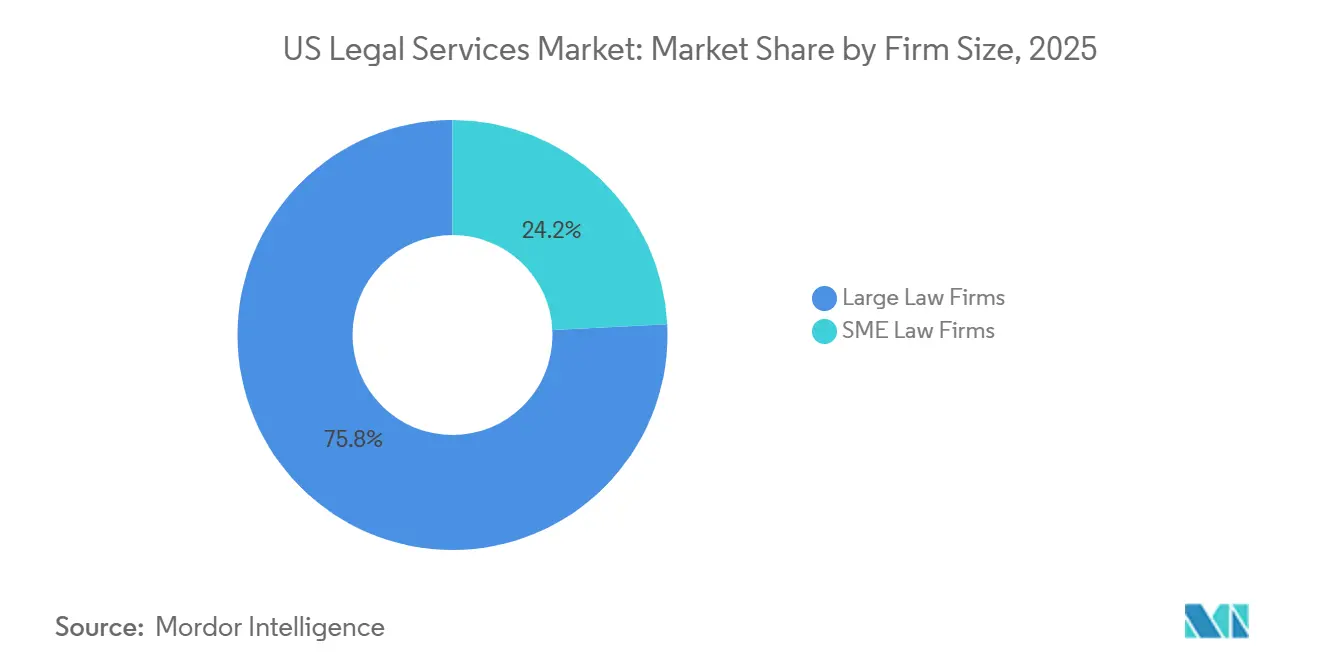
- By firm size, Large Law Firms held 75.77% of the United States legal services market share in 2025, and SME Law Firms are projected to grow at a 4.01% CAGR through 2031.
Note: Market size and forecast figures in this report are generated using Mordor Intelligence’s proprietary estimation framework, updated with the latest available data and insights as of January 2026.
United States Legal Services Market Trends and Insights
Drivers Impact Analysis*
| Driver | (~) % Impact on CAGR Forecast | Geographic Relevance | Impact Timeline |
|---|---|---|---|
| Digital-first consumer behavior is driving DIY and unbundled legal demand | +0.6% | Global, with tech-forward states (California, Texas, Arizona) leading adoption | Medium term (2-4 years) |
| Corporate demand for ESG-linked legal advisory & compliance | +0.7% | National, with early gains in California and New York, and concentrated around Fortune 500 headquarters | Long term (≥ 4 years) |
| Near-shoring of routine work to lower-cost US states | +0.4% | Midwest and Southern states (Texas, North Carolina, Tennessee), with spillover to smaller Sunbelt metros | Medium term (2-4 years) |
| AI-powered contract analytics reducing turnaround time | +0.8% | Global adoption, highest penetration in large firms (51+ lawyers), and corporate law departments | Short term (≤ 2 years) |
| Rise of subscription-based "legal-as-a-service" models | +0.3% | National, particularly benefiting SME and consumer segments lacking traditional legal access | Medium term (2-4 years) |
| Regulatory Complexity and Litigation Risk from Evolving Data Privacy & Cybersecurity Laws | +0.5% | National, with outsized impact in California (CCPA/CPRA), Virginia, Colorado, and states adopting sector-specific privacy regimes; spillover demand from multinational clients | Short to medium term (1-3 years) |
| Source: Mordor Intelligence | |||


Digital-First Consumer Behaviour Driving DIY and Unbundled Legal Demand
Digital-first client behavior is expanding accessible entry points for legal assistance as consumers increasingly compare providers across online channels and prioritize speed, transparency, and predictable costs. The ABA’s Task Force on Law and Artificial Intelligence highlights that AI’s growing integration into legal practice, particularly in document drafting and other routine tasks, is reshaping expectations around legal service delivery, increasing consumer comfort with self-service tools, and accelerating demand for do-it-yourself and unbundled legal offerings [1]American Bar Association, “Task Force on Law and Artificial Intelligence,” American Bar Association, americanbar.org. This shift is already evident in market performance, with LegalZoom reporting Q1 2025 revenue of USD 183.1 million and a subscriber base of 1.92 million, underscoring the commercial traction of platforms that bundle filings and document generation for small businesses and entrepreneurs[2]LegalZoom, “LegalZoom Reports Strong First Quarter 2025 Financial Results,” LegalZoom Investor Relations, investors.legalzoom.com. At the same time, AI-enabled automation of low-complexity work is compressing traditional revenue streams that historically subsidized broader firm activities, prompting new pricing and delivery models. Subscription-based “legal-as-a-service” offerings with low monthly fees and transparent add-on pricing are converting latent demand from middle-income consumers who have traditionally deferred legal spend. Public polling by the National Center for State Courts further indicates widespread concern over unequal access to justice, encouraging regulators and bar associations to cautiously accommodate non-traditional delivery channels.
Corporate Demand for ESG-Linked Legal Advisory & Compliance
Regulatory and investor-driven ESG requirements are generating sustained demand for legal advisory and compliance services across the United States legal services market. California’s SB 253 mandates large companies operating in the state to disclose Scope 1 and Scope 2 emissions by 2026, triggering immediate legal work related to emissions accounting, governance frameworks, and assurance readiness. At the federal level, the introduction of a methane emissions charge for qualifying oil and gas operators is increasing the need for compliance planning, risk mitigation, and enforcement defense. In parallel, the rollout of new disclosure regimes in international markets such as Australia and Spain is pushing multinational companies to harmonize ESG reporting across jurisdictions, often requiring legal coordination to align data, attestations, and audit processes. Despite evolving federal policy signals, investor-led diligence, transaction structuring, and financing requirements continue to underpin ESG-related legal mandates, particularly in project finance and private equity.
Near-Shoring of Routine Work to Lower-Cost US States
Routine legal activities such as document review, e-discovery, and contract abstraction are increasingly being shifted from high-cost coastal markets to lower-cost regional hubs, including Austin, Raleigh, and Nashville. This domestic near-shoring strategy allows firms to preserve data sovereignty and quality control while reducing delivery costs for standardized work. Lower living expenses in these destination metros enable providers to offer more competitive pricing to corporate clients without compromising supervision or compliance standards. Industry observations indicate that midsize firms and Am Law Second Hundred practices have captured a growing share of transactional work as price-sensitive clients rebalance routine mandates away from higher-cost providers. In parallel, local bar associations and academic institutions are strengthening paralegal and legal operations talent pipelines to support this geographic shift. Collectively, these trends enhance efficiency within the United States legal services market by freeing higher-cost coastal talent to focus on strategic advisory work while relocating repeatable tasks to more cost-effective domestic locations.
Rise of Subscription-Based "Legal-as-a-Service" Models
Subscription-based legal services are gaining significant traction by offering predictable, transparent pricing that appeals to cost-conscious clients, particularly entrepreneurs and small businesses. Providers structure plans with clearly defined monthly fees and per-service charges, often leveraging modern workflows and AI-powered automation to deliver counsel efficiently while maintaining profitability. Small-business subscriptions that bundle regular access to legal advice across HR, contracts, and risk management demonstrate recurring engagements can replace traditional episodic matters. Firms adopting flat-fee pricing report higher levels of AI adoption, reflecting strong alignment between automation and predictable service delivery. Large-scale platforms illustrate robust consumer demand for packaged offerings that integrate filings, templates, and ongoing compliance support. Adoption is particularly pronounced among solo practitioners and small to mid-sized firms, while larger partnerships often retain traditional billable-hour structures that can slow flat-fee expansion. The United States Bureau of Labor Statistics projects employment of lawyers to grow by approximately 4% from 2024 to 2034, reflecting continued demand for legal services even as routine tasks are automated or outsourced, enabling alternative delivery models such as subscription-based legal services.[3]United States Bureau of Labor Statistics, “Lawyers,” Occupational Outlook Handbook
Restraints Impact Analysis*
| Restraint | (~) % Impact on CAGR Forecast | Geographic Relevance | Impact Timeline |
|---|---|---|---|
| Growing in-house legal teams at Fortune 1000 firms | -0.6% | National, concentrated in metros hosting Fortune 500 headquarters (NYC, Silicon Valley, Chicago) | Long term (≥ 4 years) |
| Persistent talent shortage is inflating associate salaries | -0.4% | National, most acute in high-cost metros (NYC, San Francisco, Boston, DC) | Medium term (2-4 years) |
| State-level regulatory barriers to non-law-firm ownership | -0.2% | 48 jurisdictions uphold bans; Arizona, Utah, and DC exceptions create a regional competitive advantage | Long term (≥ 4 years) |
| Cybersecurity and confidentiality concerns around cloud tools | -0.3% | National, particularly firms handling CUI, healthcare (HIPAA), or cross-border data transfers | Short term (≤ 2 years) |
| Source: Mordor Intelligence | |||
Growing In-House Legal Teams at Fortune 1000 Firms
Corporate legal departments are increasingly shifting work in-house, aiming to optimize internal resources while managing outside counsel spending. Larger enterprises benefit from economies of scale, often allocating a smaller share of revenue to external legal services compared to mid-market peers. In many organizations, internal personnel costs can surpass expenditures on outside counsel, prompting a rebalancing of budgets and priorities. As alternative legal service providers (ALSPs) gain adoption, legal leaders continue to leverage panel diversification and cost-control strategies, reallocating standardized or routine tasks from traditional law firms to a mix of in-house teams and specialized providers. These dynamics reinforce a multitrack procurement model in the United States legal services market, where complex matters remain with top-tier firms while routine work is concentrated in lower-cost channels.
Persistent Talent Shortage Inflating Associate Salaries
Ongoing talent scarcity is creating challenges for legal hiring as demand in key practice areas remains strong and recruitment cycles lengthen. Many firms, including prominent litigation boutiques and regional practices, have increased first-year associate salaries to reflect workload intensity and early trial exposure, indicating that compensation pressure extends beyond the largest firms. The United States Bureau of Labor Statistics projects substantial annual lawyer openings, sustaining competition for junior and mid-level hires. To retain talent, firms are investing in mentorship, trial rotations, and peer support programs, particularly in litigation practices where early courtroom experience can be limited. These factors increase cost structures for providers and can constrain capacity in high-demand areas, contributing to ongoing wage pressure and selective price increases in the United States legal services market.
*Our forecasts treat driver/restraint impacts as directional, not additive. The impact forecasts reflect baseline growth, mix effects, and variable interactions.
Segment Analysis
By End-User: SMEs Propel Affordable Access Models
Large Businesses accounted for 49.31% in 2025, while SMEs are projected to grow at a 3.61% CAGR between 2026 and 2031, making SMEs the fastest-growing client segment in the United States legal services market. Private consumers and legal-aid clients continue to drive meaningful volumes in areas such as family law, probate, and personal-injury services, where flat fees and online portals reduce barriers to entry. Programs like the ABA’s Free Legal Answers provide scalable access across 48 states and the Virgin Islands, raising awareness among consumer groups that have historically underutilized legal services. Government and public sector clients maintain steady demand across administrative law, enforcement defense, and regulatory matters, reflecting the ongoing need for specialized counsel. Corporate legal teams continue to balance internal capacity with external experts, reserving top-tier counsel for high-stakes disputes and transformational transactions.
SMEs benefit from bundled packages that integrate contract review, HR guidance, and risk management at fixed monthly rates, allowing businesses without in-house legal teams to access reliable support. Corporate law departments have reported rising matter volumes while maintaining flat budgets, creating pressure to separate high-value external work from standardized internal tasks. Legal aid and pro bono initiatives are increasingly leveraging online triage and volunteer matching platforms, expanding access for civil matters beyond traditional law firm engagements. The shift toward subscription and digital-first models aligns with evolving compliance needs and budget discipline among small enterprises. Collectively, these dynamics are expanding the client mix and reinforcing lower-friction service adoption across the United States legal services market.


By Application: Emerging Specialties Outpace Legacy Practices
Corporate, Financial and Commercial Law held 43.52% of overall applications in 2025 and continues to reflect concentration in major financial and regulatory hubs such as New York, Los Angeles, Chicago, and Washington, D.C., within the United States legal services market. Established categories such as personal injury, property, family, employment, and criminal law remain active and are supported by workflows that streamline filings, disclosures, and case management. Broader adoption of technology in these practices helps smaller firms manage higher volumes while maintaining standards of review and client communication. New coverage categories introduced by major rankings in 2025, including AI and Corporate Governance, signal greater demand for specialized counsel as novel regulatory domains mature. These shifts help reposition workload from legacy transactional areas toward forward-looking compliance and risk advisory in the United States legal services market.
Other Applications are projected to expand at a 4.57% CAGR through 2031, led by demand for cybersecurity oversight, AI liability analysis, and evolving data privacy requirements. The Federal Trade Commission updated COPPA rules in 2025 to require greater transparency and impose tighter data-sharing limits, which increased advisory demand for platforms that serve minors or collect sensitive data. The United States Department of Justice also finalized its rule on bulk data transactions in early 2025 that restricts data flows to certain jurisdictions, which now appears in cross-border diligence and contract negotiations. New practice profiles around AI, governance, and auditor liability reflect how regulatory complexity drives new buyer needs, rather than mere re-labeling of legacy commercial work. This mix of requirements supports a selective reallocation of engagement hours toward emerging domains in the United States legal services market.
By Service: Research & Support Accelerate Through AI
Representation services captured a 54.66% share in 2025 as courtroom advocacy, depositions, arbitrations, and mediations continue to require high-touch advisory and persuasion in the United States legal services market. Technology is increasingly used to support these activities, assisting with case-law summarization, exhibit management, and witness preparation while maintaining attorney oversight of strategy and outcomes. Advisory and consulting offerings, including transactional structuring, legal opinions, and regulatory interpretation, are seeing growth as corporate clients adopt capped or fixed-fee arrangements to manage costs and align incentives. Notarial services, though specialized, benefit from the expansion of remote online notarization, reducing time-to-close for eligible transactions. Across these services, technology supplements attorney work without diminishing accountability for client outcomes, reinforcing the high-value, professional nature of representation and advisory services.
Legal Research and Support Services are projected to grow at a 4.23% CAGR, the fastest rate among service categories, due to AI-enabled contract review, e-discovery, and regulatory-change monitoring. Industry surveys in 2026 show that a growing share of firms adopted AI tools in 2025 and plan further increases, especially for transcript summarization, deposition exhibit handling, and trial preparation. Contract lifecycle management and review platforms continue to shorten cycle times and redirect attorney time to higher-value tasks, with legal professionals reporting tangible business benefits from these tools. Professional guidance on AI use from bar associations and courts is expanding as providers operationalize compliance, confidentiality, and billing standards in an AI-infused workflow. These developments reinforce ongoing investment in research and support capabilities within the United States legal services market.
By Mode of Delivery: Fully Digital Channels Surge
Traditional In-Person delivery accounted for a 70.42% share in 2025 as clients continued to prioritize face-to-face interactions for high-stakes litigation, complex negotiations, and sensitive family-law matters in the United States legal services market. Hybrid work arrangements are now widespread, with legal professionals splitting time between office and remote settings as firms adjust staffing, culture, and workflows to maintain flexibility. Cloud-based technologies, including video conferencing, e-signatures, and e-filing, support remote collaboration while preserving in-person engagement for critical moments. Mature client portals allow firms to handle triage, updates, and routine interactions online, reserving direct meetings for matters that deliver the highest client value. This approach enhances access to legal services while reducing friction for routine tasks.
Digital clinics and subscription platforms highlight the growing adoption of fully virtual delivery models. Programs like the ABA’s Free Legal Answers provide virtual legal support across 48 states and the Virgin Islands, connecting clients with licensed attorneys for civil matters. Consumer-facing platforms such as LegalZoom and Rocket Lawyer offer subscription-based access to document templates and lawyer Q&A, appealing to budget-conscious users. Regulatory sandboxes in states like Arizona, Utah, and Washington allow limited non-lawyer ownership, expanding service capacity under defined oversight. Privacy and data protection requirements, including state and federal rules for minors’ information, necessitate encryption, auditing, and vendor diligence, supporting a measured and secure expansion of virtual channels in the United States legal services market.
By Firm Size: SME Firms Leapfrog Through Technology
Large Law Firms held 75.77% share in 2025, supported by deep subject-matter expertise, global footprints, and brand strength that wins mandates for complex transactions and high-stakes disputes in the United States legal services market. Concentrations of Am Law 200 attorneys in major cities, particularly New York and Washington, D.C., provide a professional base that supports premium practices. These firms invest heavily in knowledge management, cross-border capabilities, and practice-specific technology to enhance collaboration and efficiency at scale. Clients rely on these platforms for critical, high-value matters while diversifying their legal panels for routine or standardized work. This results in a barbell distribution of legal services, with premium work concentrated at large firms and standardized matters spread across alternative channels.
SME Law Firms are projected to grow at a 4.01% CAGR domestically as lightweight tech stacks, lower overhead, and process redesign enable competitive pricing without compromising quality. Smaller practices can implement AI-native tools quickly and standardize workflows across intake, research, and drafting, which helps them win recurring work from small and midsize businesses. Subscription offerings and flat-fee scoping are especially aligned with SME client expectations for price certainty and responsiveness. As corporate buyers expand their use of ALSPs and internal teams for standardized work, SME firms that specialize in advisory and dispute tactics for local markets are positioned to benefit. This dynamic supports a more balanced competitive field within the United States legal services market.
Geography Analysis
The Northeast region dominates the United States legal services market, accounting for 32.15% of total market share, driven by its concentration of major financial, corporate, and regulatory hubs such as New York City, Boston, and Washington, D.C. The region hosts a high density of large law firms, multinational corporations, investment banks, and federal institutions, which generate consistent demand for complex corporate, litigation, and regulatory legal services. Its mature legal infrastructure, strong client base, and presence of global headquarters reinforce its continued market leadership.
At the same time, growth markets such as Texas, Florida, North Carolina, and Tennessee are increasing their share of legal activity. Firms and corporate clients are drawn to these regions by expanding talent pools, lower housing costs, and business-friendly environments. Texas has emerged as a major legal hub, with national firms expanding to serve energy, private equity, and technology clients. Florida’s large attorney population and favorable cost-of-living dynamics support associate retention and lateral hiring. North Carolina and Tennessee have benefited from near-shoring trends in e-discovery and contract review, supported by local legal ecosystems that maintain attorney oversight.
In contrast, the Southeast region is projected to be the fastest-growing market, with a CAGR of 4.21% over the next five years. Rapid population growth, business relocations, rising startup activity, and expanding real estate and infrastructure development in states such as Florida, Georgia, and North Carolina are driving demand for legal services. Lower operating costs and increased corporate migration from higher-cost regions further support accelerated growth.
Regulatory Landscape
Regulation of legal services in the United States remains primarily state-based through supreme courts and bar regulators, with most jurisdictions continuing to align ethics frameworks to the ABA Model Rules of Professional Conduct. A central competitive constraint is the continued restriction on non-law-firm ownership and fee sharing in most states, while a limited set of jurisdictions maintain carve-outs such as Arizona and Utah-style sandbox or ABS pathways that allow defined nonlawyer participation under supervision.
Recent state actions highlight widening divergence in operational rules that affect multi-state service delivery and partnerships with Alternative Legal Service Providers. California made changes effective January 1, 2026 (Cal. Bus. & Prof. Code 6156) that restrict fee sharing involving certain out-of-state alternative business structures. New York implemented 22 NYCRR Part 161 effective June 1, 2026 to set a no-disclosure default for AI use in court filings while enabling court-specific certification approaches aimed at preventing AI fabrication. In June 2026, Illinois passed HB 5487 to regulate nonlawyer-owned entities and tighten limits on lawyer dealings with such businesses, while the FTC endorsed proposals associated with the Ohio Supreme Court (July 2026), as well as Florida and Texas, to reduce or end reliance on the ABA as the exclusive accreditor for law schools. Over time, these shifts can reshape entry pathways and competition for legal talent.
Value Chain Analysis
The legal services value chain begins with demand origination and intake (corporate counsel panels, litigation triggers, regulatory change, and consumer digital channels), followed by matter scoping, conflict checks, and engagement terms that increasingly include fixed-fee, subscription, or outcome-linked components alongside traditional hourly billing. Core delivery spans advisory, transaction execution, and representation, supported by research, drafting, e-discovery, and litigation support. These activities are increasingly coordinated with ALSPs and specialized vendors for standardized work such as document review and contract abstraction.
Enablers across the chain include talent pipelines (law schools, laterals, paralegals, and legal operations roles), technology platforms for knowledge management and AI-assisted workflows, and governance controls for confidentiality and quality. Large firms are investing in AI governance, training, and integration into practice management systems to manage ethical and security risks as AI use expands in research and support services. Regulatory divergence across states (for example, California restrictions versus Arizona ABS models) adds complexity to interstate delivery, fee arrangements, and partner ecosystems. At the premium end of the chain, top firms such as Kirkland & Ellis and Latham & Watkins remain key intermediaries in large M&A and private equity matters, concentrating high-value advisory work while pushing repeatable tasks into lower-cost delivery layers.
Competitive Landscape
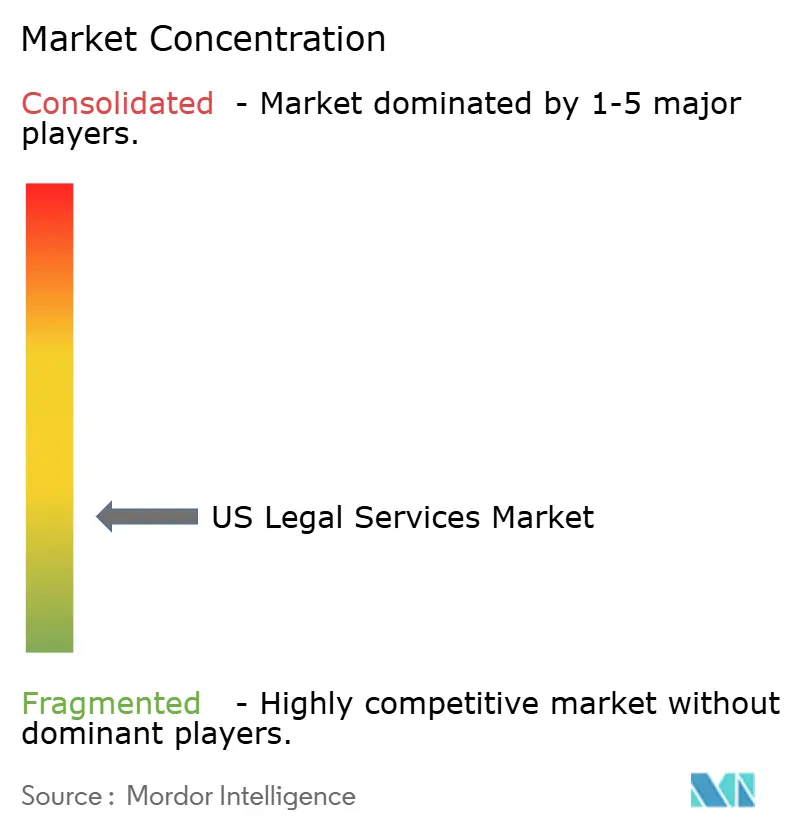
The United States legal services market features a fragmented landscape where large law firms and SME providers coexist, with brand, scale, and specialized expertise driving premium engagements while cost-effective options expand for standardized tasks. Corporate legal departments increasingly rely on alternative legal service providers (ALSPs) for routine work, outsourcing defined assignments to lower-cost providers as part of panel diversification strategies. ALSPs have reached substantial revenue levels, reflecting sustained growth and growing client willingness to prioritize value over brand for repeatable services. Mergers among large and mid-sized firms continue, expanding geographic reach and adding complementary capabilities to manage complex cross-border transactions and investigations. These strategies also support multinational in-house teams that prefer a smaller number of external providers per matter.
Transatlantic combinations are growing as firms seek scale in intellectual property, finance, and global disputes to provide coordinated counsel across North America, Europe, and Asia. Recent mergers have positioned entities among the top firms by revenue and headcount in the United States and the United Kingdom. Law firms with structured AI strategies report faster returns and measurable workflow benefits compared with those adopting tools without formal programs. Professional guidance on AI usage and billing is shaping how firms price time saved through automation, with ethics opinions clarifying expectations for reasonableness and client value. These trends illustrate how investment in capabilities and policy alignment influence competitive positioning within the market.
Regulatory developments are reshaping competition, as seen with Arizona’s approval of an Alternative Business Structure for KPMG Law United States, allowing non-lawyer ownership under defined safeguards[4]Maryland State Bar Association, “KPMG Law US ABS Approval,” MSBA, msba.org. Corporate buyers continue to balance traditional law firms, ALSPs, and internal teams to match task complexity with cost and capability, often engaging specialized providers for document review, contract abstraction, and litigation support. The introduction of agentic AI tools will differentiate providers able to integrate automation without compromising quality or client oversight. Technology-enabled service models are driving experimentation with workflow design, efficiency, and value-based pricing.
United States Legal Services Industry Leaders
Latham & Watkins LLP
Kirkland Kirkland & Ellis LLP& Ellis LLP
Skadden, Arps, Slate, Meagher & Flom LLP
Cravath, Swaine & Moore LLP
Wachtell, Lipton, Rosen & Katz
- *Disclaimer: Major Players sorted in no particular order

Market Opportunities and Future Outlook
Demand whitespace is most visible where buyers want faster turnaround and price certainty without sacrificing attorney oversight, especially for SMEs that do not have in-house legal teams and for corporate departments operating with constrained budgets. Subscription legal services, unbundled offerings, and digitally delivered support align with this need. Market evidence includes consumer platforms scaling paid subscriptions, for example LegalZoom reported Q1 2025 revenue of USD 183.1 million with 1.92 million subscribers, which supports room for packaged compliance, contract, and employment-law support built around standardized workflows.
Complexity-driven advisory remains a high-value expansion lane as regulatory and transaction environments evolve, pulling work toward specialized practices in privacy, cybersecurity, AI-related risk, and ESG-linked disclosures. California SB 253 creates concrete compliance work as large companies operating in the state prepare for Scope 1 and Scope 2 emissions disclosures by 2026, and cross-border data restrictions finalized by the US Department of Justice in early 2025 are being incorporated into diligence and contracting. This expands demand for repeatable compliance playbooks and monitoring. On the transactions side, evidence of increased deal activity and concentration at top firms, including global M&A activity reaching USD 2.85 trillion in H1 2026 and continued leadership by firms such as Kirkland & Ellis and Latham & Watkins in M&A rankings through Q2 2026, supports opportunities for firms and ALSPs to productize deal execution support, integration planning, and related regulatory diligence. This is strengthened further when combined with AI-enabled contract analytics and scalable legal operations.
Recent Industry Developments
- July 2026: Latham & Watkins LLP adds Jennifer Ying Lan as a partner in the Capital Markets and Public Company Representation practices in New York. The appointment strengthens counsel coverage for major corporate equity and debt transactions.
- July 2026: Kirkland & Ellis LLP advised Digital Realty on its acquisition of Columbia Capital for approximately $485 million. The deal represents a major M&A in data-center and infrastructure spaces, expanding cross-border capabilities.
- July 2026: Kirkland & Ellis LLP advised Travel + Leisure Co. on a definitive agreement to acquire Spinnaker Resorts. The acquisition expands advisory in consumer and entertainment asset deals and related regulatory considerations.


Research Methodology Framework and Report Scope
Market Definition and Coverage
This market is defined as revenue earned in the United States from providing legal advice and representation, including ongoing counsel, dispute support, and transactional work delivered by law firms and similar providers.
Scope exclusions: We exclude court filing fees, government legal departments, in-house counsel payroll and overheads, and software-only legal technology subscriptions.
Segmentation Overview
- By End-User
- Legal-Aid Consumers
- Private Consumers
- SMEs
- Charities and NGOs
- Large Businesses
- Government and Public Sector
- By Application
- Corporate, Financial and Commercial Law
- Personal Injury
- Commercial and Residential Property
- Wills, Trusts and Probate
- Family Law
- Employment Law
- Criminal Law
- Other Applications
- By Service
- Representation
- Advisory and Consulting
- Notarial Services
- Legal Research and Support Services
- By Mode of Delivery
- Traditional In-Person
- Hybrid (Blended)
- Fully Digital / Virtual
- By Firm Size
- Large Law Firms
- SME Law Firms
- By Geography
- Northeast
- Southeast
- Midwest
- Southwest
- West
Data Sources, Market Sizing, and Validation
Desk Research
Desk research starts with public data that helps us anchor the size of the lawyer-services economy and its direction over time. Common reference points include sources such as the US Census Bureau (NAICS receipts), Bureau of Labor Statistics employment and wage series for legal occupations, and BEA national accounts for professional services.
To add real-world context, we also review sources such as SEC filings and investor presentations of publicly listed legal-services related firms, bar association and court system publications, and peer-reviewed journals that discuss billing patterns and practice mix. Where available, paid subscriptions are used selectively for company financials and intelligence, and for shipment-level import and export checks on legal-process related outsourcing. The desk sources listed here are illustrative only, and many other public and paid references were also used to collect, validate, and clarify inputs.
Primary Interviews and Surveys
Primary work is used to pressure-test the desk view with people who see pricing and demand week to week. We spoke with partners, practice leaders, operations heads, and procurement-side buyers across corporate and individual client work, and then reconciled differences by geography, practice area intensity, and delivery mode.
These conversations helped validate fee-rate movement, utilization direction, the share of work shifted to alternative providers, and which parts of demand were being deferred instead of lost, which are all important for keeping the model realistic.
Distribution of primary research fieldwork respondents
| Company type | Respondent position |
|---|---|
| Top tier: 25% | CXOs: 14% |
| Mid tier: 55% | Functional/Unit leaders: 30% |
| Smaller Players: 20% | Managers: 56% |
Market-Sizing & Forecasting
Sizing is built using a top-down approach where official industry receipts and legal-employment indicators are used to reconstruct the total revenue pool, which is then adjusted for shifts in mix between corporate and consumer work. After that, the totals are corroborated using selective bottom-up approximations, such as sampled price per hour or per matter multiplied by estimated case and advisory volumes, plus channel checks on outsourcing and document-heavy work.
Inputs that mattered most in the model include billed-rate and realization direction, lawyer headcount and utilization, litigation and dispute intensity signals, transactional cycle activity, and the pace of work being unbundled to alternative providers. Because some data series lag, gaps are handled by using short, explicit assumptions that are then rechecked with primary respondents before the numbers are finalized.
Forecasting relies mainly on scenario analysis, where macro conditions and legal demand drivers are translated into a few clear paths for volume and pricing, and then the final path is selected based on what practitioners expect for staffing, client budgets, and matter flow over the next few years.
Data Validation & Update Cycle
Validation is done through a set of cross-checks that compare model outputs with independent signals, such as government receipts, employment totals, and widely tracked law-firm demand and pricing indicators. If a segment shows an unusual jump, we revisit the driver assumptions, re-check the math, and, when needed, re-contact participants to confirm what changed and whether it is temporary.
Before sign-off, the work goes through multiple analyst reviews so inputs, conversions, and growth logic are consistent across years. Reports are refreshed annually, and interim updates are triggered when material events affect legal demand, pricing, or delivery models. Right before delivery, a final pass is completed so clients receive the most current view.
Mordor Intelligence's US Legal Services Market Size Versus Other Published Estimates
Published market values for US legal services can vary because each publisher draws the market box differently and then uses different price and volume shortcuts. Differences also show up when the base year is not the same, when inflation assumptions are applied unevenly, or when older inputs are carried forward without being rechecked.
Some external figures are built around a narrow law-firm only definition, and others loosely extend into adjacent legal-support activities and long-horizon projections. The 2026 market size in this study is set to USD 380.36 B because Mordor Intelligence limits the count to legal service revenue and keeps in-house legal payroll, court fees, and software-only subscriptions outside the total.
Benchmark comparison
| Source | Market Size | Gaps in Research Methodology |
|---|---|---|
| Mordor Intelligence | USD 380.36 B (2026) | |
| Industry Data Publisher A | USD 422.40 B (2026) | Uses a law firms industry lens (NAICS 54111) and can capture receipts that behave like legal services but do not cleanly map to billed legal work as defined in this study, which tends to lift the total. |
| Business Media Outlet B | USD 292.08 B (2024) | States a US legal services total without a clear inclusion list and anchors on an earlier year, so differences can come from missing later price increases, practice mix shifts, and inconsistent treatment of alternative providers. |
The spread is mainly explained by definition and timing, not by one single growth assumption. When scope is kept consistent and inputs are tied back to receipts, employment, and validated pricing movement, the result becomes easier to reproduce and to use for planning decisions.


Key Questions Answered in the Report
What is the current size and growth outlook for the United States legal services market?
The United States legal services market size is USD 380.36 billion in 2026 and is projected to reach USD 437.10 billion by 2031 at a 2.82% CAGR, reflecting steady but measured expansion across client segments and delivery models.
Which client segment is growing fastest in the United States legal services market?
SMEs are the fastest-growing end-user segment, with a projected 3.61% CAGR to 2031 due to demand for predictable subscription offerings, digital compliance support, and on-demand advisory.
Which application areas are expected to grow fastest through 2031?
Other Applications, including cybersecurity counsel, ESG governance, and AI liability, are projected to expand at a 4.57% CAGR as new rules and assurance needs drive advisory demand.
Which service category is growing fastest in the United States legal services market?
Legal Research and Support Services are projected to grow at a 4.23% CAGR, supported by AI-enabled document review, e-discovery, and regulatory-change monitoring that reduce cycle times while maintaining attorney oversight.
How is delivery shifting between in-person and virtual channels?
Traditional In-Person held a 70.42% share in 2025, but Fully Digital or Virtual channels are projected to grow at a 6.13% CAGR through 2031, due to high adoption of cloud tools, e-signatures, and e-filing.
How are firm-size dynamics evolving among providers?
Large Law Firms held a 75.77% share in 2025 for complex mandates, while SME Law Firms are projected to grow at a 4.01% CAGR, using lightweight tech stacks and flat-fee offerings to compete effectively.
Page last updated on:


 Your data is secure and never sold or shared.


