US LED Lighting Market Size and Share
Market Overview
| Study Period | 2020 - 2031 |
|---|---|
| Base Year For Estimation | 2025 |
| Forecast Data Period | 2026 - 2031 |
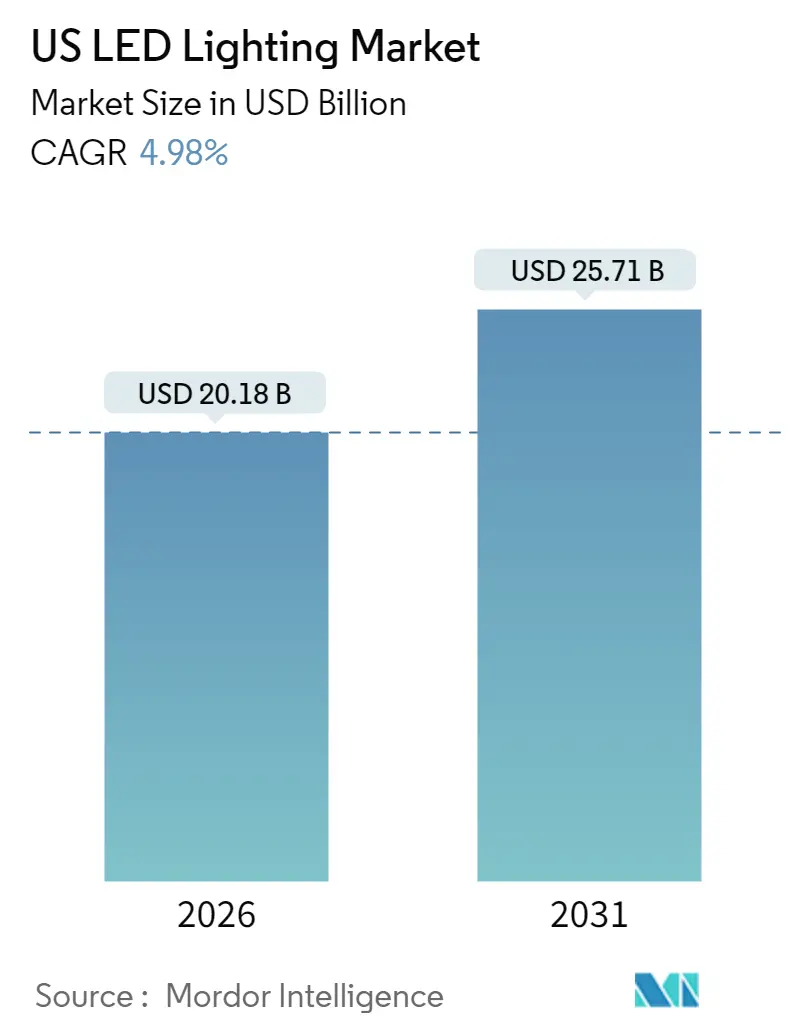
| Market Size (2026) | USD 20.18 Billion |
| Market Size (2031) | USD 25.71 Billion |
| Growth Rate (2026 - 2031) | 4.98% CAGR |
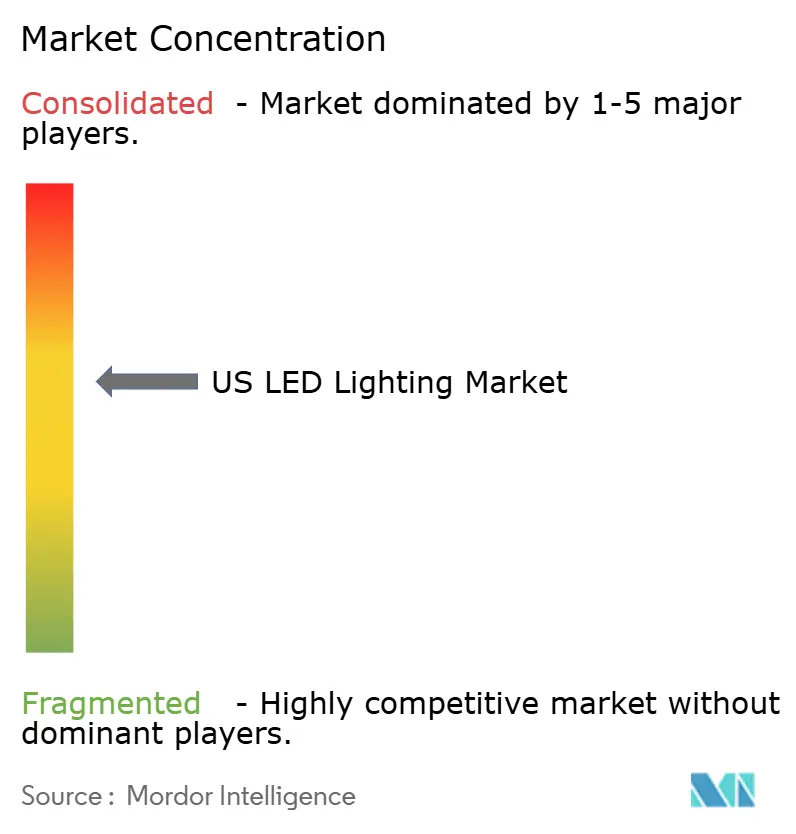
| Market Concentration | Medium |
Major Players *Disclaimer: Major Players sorted in no particular order Image © Mordor Intelligence. Reuse requires attribution under CC BY 4.0. | |
US LED Lighting Market Analysis by Mordor Intelligence
The United States LED lighting market size in 2026 is estimated at USD 20.18 billion, growing from 2025 value of USD 19.22 billion with 2031 projections showing USD 25.71 billion, growing at 4.98% CAGR over 2026-2031. Federal rules that eliminated incandescent and halogen lamps in 2023, followed by bans on most fluorescent tubes in California, Vermont, and Washington, created replacement demand that continues to lift unit volumes. Municipal building codes now give more credit for controllable fixtures than for bare efficacy gains, pushing architects to specify luminaires that include sensors and networked drivers. Fortune 500 companies are increasingly replacing legacy lighting to meet their carbon targets, even when payback calculations are unfavorable, redirecting procurement priorities toward verified emission reductions. At the same time, tariffs of 25% on Canadian and Mexican imports, along with an additional 10% surcharge on Chinese sub-components, are nudging manufacturers to diversify their suppliers or reshore sub-assembly, reshaping the competitive landscape.
Key Report Takeaways
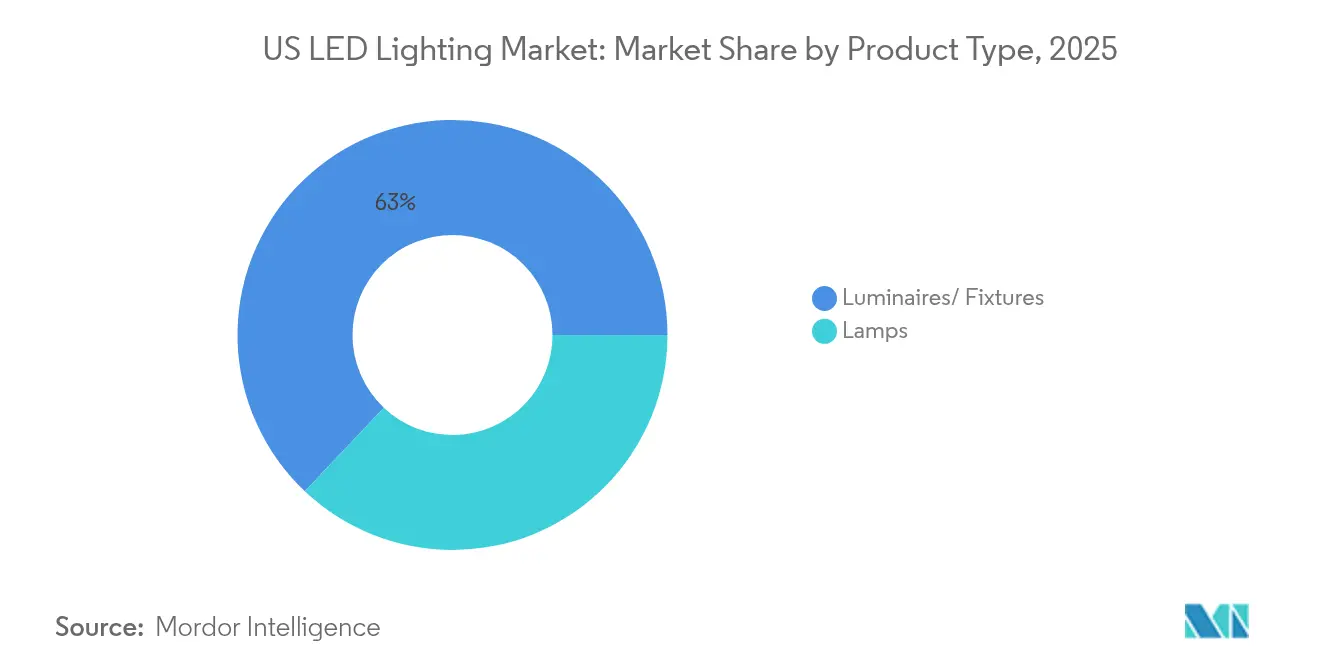
- By product type, luminaires and fixtures captured 62.95% of the United States LED lighting market share in 2025, while lamps recorded the fastest 6.72% CAGR through 2031.
- By distribution channel, wholesale and retail accounted for 54.85% of the United States' LED lighting market in 2025, and e-commerce is forecasted to expand at a 5.21% CAGR through 2031.
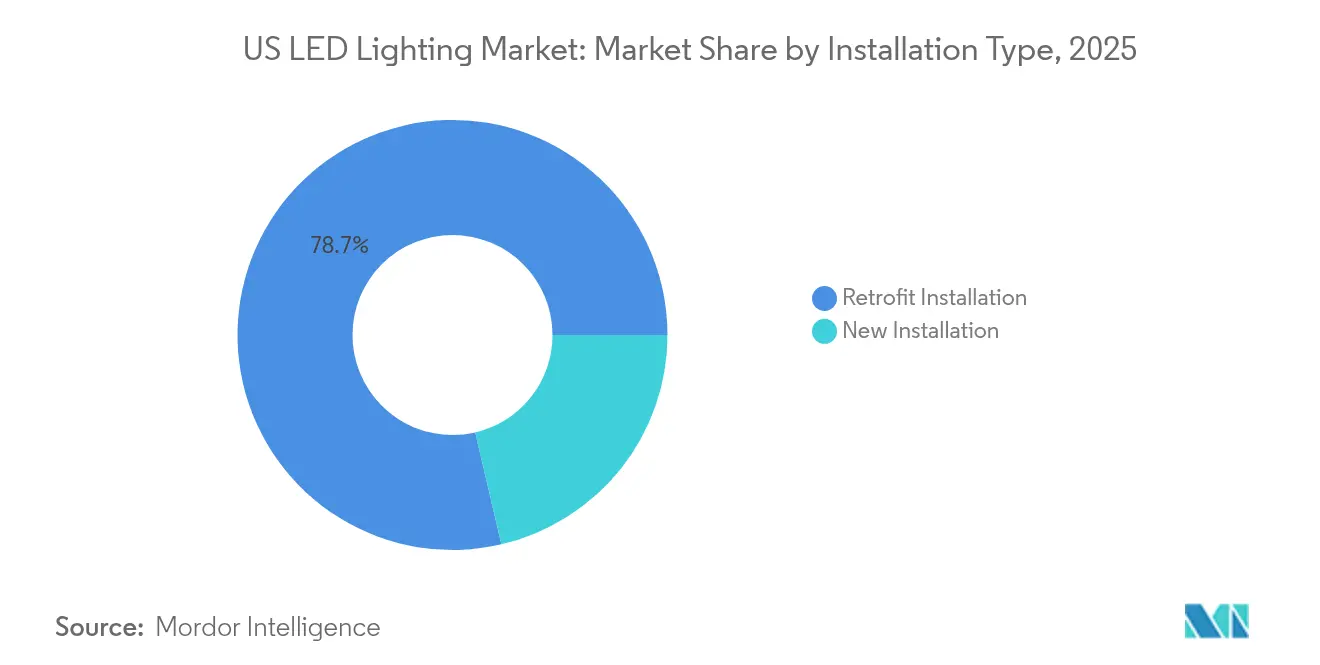
- By installation type, retrofits accounted for 78.65% of the United States LED lighting market size in 2025, whereas new installations are projected to grow at a 5.62% CAGR to 2031.
- By application, residential held 20.55% of the United States' LED lighting market in 2025, and highway and roadway applications are projected to advance at a 7.46% CAGR through 2031.
- By end user, indoor environments accounted for 63.75% of the United States' LED lighting market share in 2025, while outdoor applications are projected to rise at a 7.18% CAGR through 2031.
Note: Market size and forecast figures in this report are generated using Mordor Intelligence’s proprietary estimation framework, updated with the latest available data and insights as of January 2026.
US LED Lighting Market Trends and Insights
Drivers Impact Analysis
| Driver | (~) % Impact on CAGR Forecast | Geographic Relevance | Impact Timeline |
|---|---|---|---|
| Accelerated phase-out of legacy lighting standards | +1.2% | National, with early implementation in California, Vermont, and Washington | Short term (≤ 2 years) |
| Federal and state incentive programs for energy efficiency | +0.8% | National federal programs, concentrated state programs in California, New York, and Massachusetts | Medium term (2-4 years) |
| Declining LED prices and higher luminous efficacy | +0.6% | Global supply chain benefits, concentrated in high-volume applications | Long term (≥ 4 years) |
| Corporate ESG-driven retrofitting mandates | +1.1% | National, with concentration in major metropolitan areas and Fortune 500 headquarters | Medium term (2-4 years) |
| Micro-LED pilot production breakthroughs | +0.4% | Technology centers in California, Texas, and North Carolina | Long term (≥ 4 years) |
| Stricter building-energy codes at the municipality level | +0.9% | California, New York, Seattle, Denver, and other progressive jurisdictions | Medium term (2-4 years) |
| Source: Mordor Intelligence | |||
Accelerated Phase-Out of Legacy Lighting Standards
Federal rules that prohibit lamps delivering fewer than 45 lumens per watt have prompted consumers and businesses to shift toward LEDs that deliver 80-100 lumens per watt.[1]U.S. Department of Energy, “Lighting Choices to Save You Money,” energy.gov California’s fluorescent tube ban, effective in 2024, triggered early replacements in offices and retail spaces, reinforcing the dominance of retrofitting in the United States' LED lighting market. Because compliance is mandatory regardless of fixture age, the rule decouples upgrade timing from depreciation schedules. Domestic producers with shorter supply lines gained price leverage as tariffs inflated the costs of imported lamps.
Federal and State Incentive Programs for Energy Efficiency
The Inflation Reduction Act allocates USD 8.8 billion for Home Energy Rebates, which include up to USD 200 per household for qualified LED products.[2]U.S. Department of Energy, “Home Energy Rebates Program,” energy.gov Commercial property owners can deduct up to USD 5.00 per square foot under Section 179D when installed systems surpass code-mandated efficiency, a provision that favors networked luminaires. Title 24 2025 in California will require daylight harvesting and advanced controls, accelerating the uptake of fixtures that ship with embedded sensors and wireless drivers.
Corporate ESG-Driven Retrofitting Mandates
New York City Local Law 97 imposes fines of USD 268 per metric ton of excess carbon, giving building owners a financial motive to prioritize lighting retrofits.[3]NYC Mayor’s Office of Climate and Environmental Justice, “Local Law 97,” nyc.gov Publicly traded companies pursuing Science-Based Targets require auditable emission reductions, leading procurement teams to choose vendors that can verify carbon reductions across their supply chains. This emerging preference boosts premium fixture lines that integrate energy dashboards and remote monitoring.
Stricter Building-Energy Codes at Municipality Level
The 2024 International Energy Conservation Code introduces granular points for controllable lighting. Municipalities, including Seattle and Denver, have adopted stretch codes that demand occupancy sensors in almost every enclosed space. Because compliance points accrue more quickly with connected luminaires, contractors are increasingly opting for turnkey systems, thereby reinforcing the leadership position of fixture manufacturers that bundle controls.
Restraints Impact Analysis
| Restraint | (~) % Impact on CAGR Forecast | Geographic Relevance | Impact Timeline |
|---|---|---|---|
| Supply-chain volatility for critical substrates | -0.7% | Global supply chains have, concentrated impact on import-dependent manufacturers | Short term (≤ 2 years) |
| High upfront cost for specialty applications | -0.4% | National, with a higher impact on price-sensitive residential and small commercial segments | Medium term (2-4 years) |
| Tariff uncertainty on Chinese LED components | -0.9% | National, with concentrated impact on manufacturers with offshore assembly operations | Short term (≤ 2 years) |
| Over-illumination concerns driving "dark-sky" ordinances | -0.3% | Regional concentration in Connecticut, Maine, and Western states, with astronomy tourism | Long term (≥ 4 years) |
| Source: Mordor Intelligence | |||
Supply-Chain Volatility for Critical Substrates
Tariffs introduced in March 2025 raised duties on Canadian and Mexican imports to 25%, undermining cross-border maquiladora economics. Simultaneously, the surcharge on Chinese LED drivers increased to 20%, raising component costs by 10-15% for U.S. assemblers. Firms now rush to qualify suppliers in Vietnam and India, but the typical 18-month relocation timeline leaves them vulnerable to price fluctuations and inventory shortages.
Tariff Uncertainty on Chinese LED Components
Escalating trade measures complicate long-term sourcing contracts. Residential distributors, whose margins are already thin, struggle to pass through price spikes, which pressurize the wholesale channel that still represents more than half of the United States' LED lighting market revenue.[4]U.S. Department of Energy, “Tariff Announcements on Lighting Products,” energy.gov Manufacturers weigh onshore driver production and vertical integration against the risk that future political changes could roll back tariffs before the investment pays back.
Segment Analysis
By Product Type: Luminaires Consolidate Specification Advantage
The luminaires category accounted for a dominant 62.95% share of the United States' LED lighting market in 2025, as architects and engineers specified fixtures with onboard sensors that meet occupancy and daylighting mandates. Growth continues steadily because integrated systems simplify commissioning and warranty. By contrast, lamps post a faster 6.72% CAGR, as they satisfy the immediate needs arising from the bans on incandescent and fluorescent bulbs. The retrofit-heavy nature of the United States LED lighting market keeps lamp volumes buoyant even though average selling prices trend downward.
Innovation in chip-on-board arrays and wireless control modules positions luminaires to capture incremental value as building owners seek granular energy data. Lamp vendors defend their market share through universal dimming compatibility and shatter-resistant coatings, targeting schools and healthcare facilities. Across both sub-segments, the United States LED lighting market size will expand as efficacy gains become increasingly thin, but adoption widens in specialty niches such as grow lights and human-centric lighting.
Note: Segment shares of all individual segments available upon report purchase
By Distribution Channel: Digital Platforms Gain Ground
Wholesale retail retained 54.85% of sales in 2025, yet e-commerce is advancing at a 5.21% CAGR as contractors embrace direct-ship models. The shift is most evident in the residential DIY and small commercial space, where standardized SKUs fit parcel networks. Direct sales remain critical for large projects that require photometric design and rebate paperwork, but web portals are increasingly handling repeat orders for maintenance stock. Manufacturers with robust online configurators and live inventory data are capturing a larger share of the United States' LED lighting market.
Traditional distributors respond by bundling design-assist, rebate administration, and on-site startup services. Some have acquired software firms that manage asset registers and predictive maintenance, creating hybrid physical-digital value propositions. As tariff costs fluctuate, online platforms provide transparent pricing, influencing buyer behavior in a market that still values local service for complex builds.
By Installation Type: New Construction Rebounds
Retrofit projects contributed 78.65% of 2025 revenue thanks to regulatory phase-outs and corporate carbon goals. Even so, new construction grows at a faster rate of 5.62% annually as commercial building starts rebound and public infrastructure spending accelerates. The 2024 IECC awards performance points for controllable lighting, making LEDs virtually mandatory in new permits. Because new builds typically purchase higher-lumen packages and sophisticated controls, their contribution to the United States' LED lighting market size is disproportionately large, despite lower unit counts.
Contractors favor factory-commissioned, plug-and-play fixtures that reduce labor hours and lower the risk of code inspection failure. Retrofit customers, on the other hand, search for socket-compatible lamps and low-profile retrofit kits to avoid the need for ceiling demolition. Both pathways solidify the United States' LED lighting market as code and carbon policies converge.
Note: Segment shares of all individual segments available upon report purchase
By Application: Infrastructure Projects Propel Highway Segment
Residential premises held a 20.55% value share in 2025, supported by the incandescent ban and retail promotions; however, highway and roadway luminaires are projected to post the fastest growth rate of 7.46% through 2031. Federal highway funding and municipal smart city projects underpin mass streetlight conversions, which often include adaptive dimming and fault detection. Such functionality boosts hardware ASPs and generates recurring software revenue streams for service providers in the United States' LED lighting market.
Office, retail, and hospitality spaces continue to adopt at a medium pace, driven by ESG reporting. Industrial facilities prioritize high-bay fixtures with wide temperature tolerances, while architectural lighting benefits from urban revitalization budgets that demand color-tunable façades. Emerging horticultural installations, aided by ASHRAE 90.1-2022 energy efficiency rules, offer a niche but rapidly growing outlet for spectrum-controlled arrays.
By End User: Outdoor Growth Outpaces a Maturing Indoor Base
Indoor environments accounted for 63.75% of spending in 2025, owing to decades of penetration in offices and homes. Nonetheless, outdoor applications are expected to rise at a 7.18% CAGR through 2031 as cities adopt networked streetlights and transportation departments embed luminaires into intelligent roadway systems. IoT-enabled poles that host cameras and 5G micro-cells provide additional revenue opportunities, diversifying the addressable United States LED lighting market.
Automotive OEMs integrate wafer-level packs into adaptive headlights and dynamic interior accent strips, aligning with EV exterior design language. The horticulture sub-class, legally defined as indoor but functionally hybrid, captures value from spectral tunability that micro-LED may soon enhance. Overall, the split between indoor and outdoor spend narrows as infrastructure budgets eclipse incremental tenant upgrades.
Geography Analysis
California leads U.S. adoption on the back of Title 24 2025, which takes effect in January 2026 and mandates daylight harvesting in most non-residential spaces. Early bans on T8 fluorescents triggered a retrofit wave, driving statewide sales to surge in 2024 and 2025. New York and other Northeast states layer Local Law 97 and IECC 2024 compliance, ensuring sustained momentum for retrofits in aging high-rise inventories. Utility demand response incentives further reward fixtures that can throttle output under grid stress.
The South and West benefit from robust new construction pipelines. Texas records gains in distribution centers and petrochemical expansions that feature vibration-resistant, high-bay facilities. Federal transportation grants steer sizable contracts toward highway LED conversions in Arizona and Nevada, augmenting outdoor demand. Midwest markets, while slower to legislate, leverage low-cost renewable power to justify plant upgrades, balancing the national growth profile of the United States' LED lighting market.
Competitive Landscape
Consolidation continues as firms pursue scale and software. In January 2025, Acuity Brands closed its USD 1.2 billion purchase of Q-SC, an audio-visual controls company, broadening its smart-building ecosystem (source: Acuity Brands press release). Private equity aggregated residential players when Kingswood Capital bought Kichler and Progress Lighting for a combined USD 256 million (source: Kingswood Capital release). Such moves raise entry barriers by bundling lighting with complementary technologies.
Tariffs jolted supply networks in 2025, pushing Signify and others to pilot U.S. driver production lines and to dual-source chips from Taiwan foundries. Domestic firms that can certify country of origin now tout tariff-free lead times as a sales lever. Meanwhile, micro-LED research centers in California and North Carolina showcase prototypes aimed at horticulture and adaptive roadway beams. Although commercial release remains several years out, patent portfolios being assembled now will influence future bargaining power in the United States LED lighting market.
US LED Lighting Industry Leaders
Acuity Brands Lighting Inc.
Signify North America Corp.
LEDVANCE LLC
Dialight PLC (U.S. operations)
Cree LED Inc.
- *Disclaimer: Major Players sorted in no particular order
Recent Industry Developments
- March 2025: The United States implemented 25% tariffs on Canadian and Mexican lighting imports and raised duties on Chinese components by 10%, prompting supply-chain reconfiguration.
- February 2025: Philadelphia completed a 130,000-unit LED streetlight conversion, demonstrating a large city's commitment to energy-efficient infrastructure.
- January 2025: Acuity Brands completed its USD 1.2 billion acquisition of Q-SC, expanding into audio-visual integration to deliver unified smart-building platforms.
- December 2024: The International Code Council published the 2024 IECC, tightening lighting power densities and expanding sensor mandates to spur high-efficiency adoption.
US LED Lighting Market Report Scope
Agricultural Lighting, Commercial, Industrial and Warehouse, Residential are covered as segments by Indoor Lighting. Public Places, Streets and Roadways, Others are covered as segments by Outdoor Lighting. Daytime Running Lights (DRL), Directional Signal Lights, Headlights, Reverse Light, Stop Light, Tail Light, Others are covered as segments by Automotive Utility Lighting. 2 Wheelers, Commercial Vehicles, Passenger Cars are covered as segments by Automotive Vehicle Lighting.| Lamps |
| Luminaires / Fixtures |
| Direct Sales |
| Wholesale Retail |
| E-commerce |
| New Installation |
| Retrofit Installation |
| Commercial Offices |
| Retail Stores |
| Hospitality |
| Industrial |
| Highway and Roadway |
| Architectural |
| Public Places |
| Hospitals |
| Horticulture Gardens |
| Residential |
| Automotive |
| Others (Chemicals, Oil and Gas, Agriculture) |
| Indoor |
| Outdoor |
| Automotive |
| By Product Type | Lamps |
| Luminaires / Fixtures | |
| By Distribution Channel | Direct Sales |
| Wholesale Retail | |
| E-commerce | |
| By Installation Type | New Installation |
| Retrofit Installation | |
| By Application | Commercial Offices |
| Retail Stores | |
| Hospitality | |
| Industrial | |
| Highway and Roadway | |
| Architectural | |
| Public Places | |
| Hospitals | |
| Horticulture Gardens | |
| Residential | |
| Automotive | |
| Others (Chemicals, Oil and Gas, Agriculture) | |
| By End User | Indoor |
| Outdoor | |
| Automotive |
Market Definition
- INDOOR LIGHTING - It incorporates all LED based lamps and fixtures/luminaire that are used to illuminate indoor section of residential, commercial, industrial buildings and agricultural lighting. LED offers efficient brightness with higher durability in comparison to other lighting technology.
- OUTDOOR LIGHTING - It incorporates the LED lighting fixtures that is used for illumination for exterior/outdoor illumination. For instance, LED lighting fixtures used to illuminate streets and highways, transport hubs, stadiums and other public places such as parking spaces.
- AUTOMOTIVE LIGHTING - It refers to the lighting fixtures installed for illumination and signaling purposes. It is used in both exterior and interior lighting of the vehicle. Headlamps, fog lamp, daytime running light (DRLs) are examples of exterior light whereas cabin light are interior lights.
- END USER - It refers to the end use application area where the LED fixture will be installed. For instance, in terms of indoor lighting, we have residential, commercial and industrial as end user category. For automotive lighting, primary end user considered are automotive manufacturers and aftermarket sale
| Keyword | Definition |
|---|---|
| Lumen | Lumen is a unit of luminous flux in the International System of Units that is equal to the amount of light given out through a solid angle by a source of one-candela intensity radiating equally in all directions. |
| Footcandle | A foot-candle (or foot-candle, fc, lm/ft2, or ft-c) is a measurement of light intensity. One foot-candle is defined as enough light to saturate a one-foot square with one lumen of light. |
| Colour Rendering Index (CRI) | Color Rendering Index (CRI) is a measurement of how natural colors render under an artificial white light source when compared with sunlight. The index is measured from 0-100, with a perfect 100 indicating that colors of objects under the light source appear the same as they would under natural sunlight. |
| Luminous flux | Luminous flux is a measure of the power of visible light produced by a light source or light fitting. It is measured in lumens (lm). |
| Annual Energy Cost | Annual Energy Cost means the average daily energy consumption multiplied by 365 (days per year), expressed in kilowatt hour per year (kWh/a). |
| Constant voltage drivers | Constant voltage drivers are designed for a single direct current (DC) output voltage. Most common constant voltage drivers (or Power Supplies) are 12VDC or 24VDC. An LED light that is rated for constant voltage usually specifies the amount of input voltage it needs to operate correctly. |
| Constant Current Driver | Constant current LED drivers are designed for a designated range of output voltages and a fixed output current (mA). LEDs that are rated to operate on a constant current driver require a designated supply of current usually specified in milliamps (mA) or amps (A). These drivers vary the voltage along an electronic circuit which allows current to remain constant throughout the LED system. |
| Minimum Energy Performance Standards (MEPS) | Minimum Energy Performance Standards specify the minimum level of energy performance that appliances and equipment must meet or exceed before they can supply or used for commercial purposes. |
| Luminous Efficacy | Luminous efficacy is a measurement commonly used in the lighting industry that indicates the ability of a light source to emit visible light using a given amount of power. |
| Solid State Lighting | Solid-state lighting (SSL) is a type of lighting that uses semiconductor light-emitting diodes (LEDs), organic light-emitting diodes (OLED), or polymer light-emitting diodes (PLED) as sources of illumination rather than electrical filaments, plasma (used in arc lamps such as fluorescent lamps), or gas. |
| Rated Lamp Life | Lamp life, also referred to as rated life, is the time in hours a lamp will last before a percentage of lamps will burn out. |
| Color Temperature | Colour temperature is a scale that measures how ‘warm’ (yellow) or ‘cool’ (blue) the light from a particular source is. It is measured in degrees of the Kelvin scale (abbreviated to K), and the higher the number, the ‘cooler’ the light. The lower the ‘K’ number, the ‘warmer’ the light. |
| Ingress Protection rating (IP rating) | The IP (Ingress Protection) rating of a bulb or light fixture declares the level of protection it has against dirt and water. |
| Fidelity Index | The general colour fidelity index, Rf, represents how closely the colour appearances of the entire sample set are reproduced (rendered) on average by a test light as compared to those under a reference illuminant. |
| Gamut Index | The gamut area is defined as “the area enclosed by a set of test color samples illuminated by a light source, in a two-dimensional chromaticity diagram or a plane of color space.”1 Within a defined color space, a “gamut” describes the subset of colors that can be perceived under specific lighting conditions. |
| Binning | In the lighting industry, the act of "binning" of LEDs is the process of sorting LEDs by certain characteristics, such as color, voltage, and brightness. |
| Accent lighting | Accent lighting, also called highlighting, emphasizes objects by focusing light directly on them. Accent lighting is used inside and outside the home to feature locations such as an entrance or to create dramatic effects. |
| Dimmable driver | A dimming driver has two functions: As a driver, it converts the 230V AC mains input to a low voltage DC output. As a dimmer, it reduces the amount of electrical energy flowing to the LEDs, thereby causing them to dim. |
| Flicker | Flicker is the repeated and frequent variation in the output of a light source over time. |
| Fluorescent | A property of materials defined as the ability to emit light after absorbing electromagnetic radiation such as visible or UV light. |
| Candela | The candela is the unit of luminous intensity in the International System of Units. It measures the light output per unit solid angle emitted from a light source in a specific direction. |
| LUX | Lux is used to measure the amount of light output in a given area - one lux is equal to one lumen per square meter. It enables us to measure the total "amount" of visible light present and the intensity of the illumination on a surface. |
| Uniformity (U0) | The uniformity of lighting has significant effects on visual performance in both indoor and outdoor areas. Uniformity (represented as U0) value can be found by dividing the minimum brightness (Emin) resulting from calculations according to the current lighting order, to the average brightness value (Eavg). |
| Visible Light Spectrum | The visible light spectrum is the segment of the electromagnetic spectrum that the human eye can view. More simply, this range of wavelengths is called visible light. Typically, the human eye can detect wavelengths from 380 to 700 nanometers. |
| Ambient Temperature | Ambient Temperature is the temperature of the air surrounding an electrical enclosure. |
| Current-controlled dimming control | Current-controlled dimming controls LED brightness by varying the applied current using a 0-10V dimmer. Current-controlled dimming is smooth and HD-video friendly. It can only dim to a minimum of 5% of light output. |
| Design Light Consortium | It is a partnership of energy efficiency stakeholders in the United States and Canada to “promote quality, performance and energy efficient lighting solutions for the commercial sector”. |
| Pulse Width Modulation | Pulse-width modulation, or pulse-duration modulation, is a method of controlling the average power delivered by an electrical signal. |
| Surface Mounted Device | A surface mount device (SMD) is an electronic device whose components are mounted or placed directly on the surface of a printed circuit board. |
| Alternating Current | Alternating current is an electric current which periodically reverses direction and changes its magnitude continuously with time, in contrast to direct current, which flows only in one direction. |
| Direct Current | Direct current (DC) is an electric current that is uni-directional, so the flow of charge is always in the same direction. |
| Beam Angle | Beam angle (also called beam spread) is a measure of how light is distributed. On any plane perpendicular to the centerline of the light, the beam angle is the angle between two rays where the light intensity is 50% of the maximum light intensity. |
| LED Based Solar High Mast Lighting Systems | A Solar LED High Mast Light is a raised source of High illumination lights (6~8 lights) and with high intensity on the middle of major junctions (Ring roads, Outer Ring roads), turned on or lit automatically in the absence of light (at specified timings or at periodic times, every night). |
| Surface Mounted Diode (SMD) LEDs | A surface mount diode is a type that emits light and is flat mounted and soldered onto a circuit board. |
| Chip on Board (COB) LEDs | A COB LED is basically multiple LED chips (usually 9 or more) glued directly onto a substrate by the manufacturer to form a single module. |
| Dual In-Line Package (DIP) LEDs | A dual in-line package (DIP or DIL) is an electronic component package with a rectangular case and two parallel rows of electrical connector pins. |
| Graphene LED Lights | A graphene LED light bulb is simply an LED light bulb where the filament has been coated in graphene. A graphene LED bulb is reported to be 10% more efficient than regular LED light bulbs and they are cheaper to manufacture and buy. |
| LED Corn Bulbs | LED Corn lights are designed as an energy efficient alternative to high intensity discharge (HID) and SON lamps. It uses a large number of LEDs on a metal structure to provide sufficient light. This arrangement of LEDs looks a lot like a corn cob, hence the name "corn light". |
| Per Capita Income | Per capita income or total income measures the average income earned per person in a given area in a specified year. It is calculated by dividing the area's total income by its total population. Per capita income is national income divided by population size. |
| Charging Stations | A charging station, also known as a charging station or electric vehicle utility, is a power supply that provides electrical energy for charging plug-in electric vehicles. |
| Headlight | A headlight is a light that is mounted on the front of a car and illuminates the road in front of it. Low beam and high beam LED headlights are additional categories for these LED headlights. |
| Day Time Running Light (DRLs) | A daytime running lamp is a white, yellow, or amber lighting device mounted on the front of a road-going motor vehicle or bicycle. |
| Directional Signal Light | Directional signal lights are the front and rear lights on an automobile that flash to show the direction of a turn. |
| Stop Light | A red light that is mounted to the back of a car and turns on when the brakes are used to show that the car is stopped. |
| Reverse Light | The reverse light is at the back of the vehicle to indicate its backward motion. |
| Tail Light | A red light that can be seen in the dark is mounted on the rear of a road vehicle. Stop, reverse, and directional signal lights are all part of it. |
| Fog Light | Bright lights in automobiles used to increase visibility on the road in foggy conditions or to warn other drivers of the presence of the vehicle. |
| Passenger Vehicle | A passenger vehicle is a road vehicle, other than a moped or a motorcycle, intended for the transportation of people and designed for up to 8 to 9 seats. |
| Commercial Vehicle | A commercial vehicle (Bus, Truck, Van) is any type of motor vehicle used to transport goods or pay passengers. |
| Two Wheelers (2W) | A two-wheeler is a vehicle that runs on two wheels. |
| Streets & Roadways | Both roads and streets refer to hard, flat surfaces on the ground on which vehicles, people, and animals can travel. Since streetways are usually in cities and towns, they often have houses and buildings on both sides. The roadway is in the countryside and sometimes passes through forests and fields |
| Horticulture Lighting | Horticulture is the science and art of sustainably growing, producing, marketing and using high quality, intensively cultivated food and ornamental plants. |
Research Methodology
Mordor Intelligence has followed the following methodology in all our data center reports.
- Step 1: Raw Data Collection: To understand the market, initially, all crtical data points were identified. Critical information about countries and regions of interest including Per-capita Income, Population, Automotive Production, Interest rate on Auto-Loans, Number of Automobiles on Road, Total LED Import, Lighting Electricity Consumption among others were recorded or estimated based on internal calculations.
- Step 2: Identify Key Variables: To build a robust forecasting model, key variables such as Number of Households, Automotive Production, Road Networks among others were identified. Through an iterative process, the variables required for the market forecast were set, and the model was built using these variables.
- Step 3: Build a Market Model: Based on data and critical industry trend data (variables), including LED pricing, LED penetration rate, and project macro and micor economic factors were utilized for building the market forecasting.
- Step 4: Validate and Finalize: In this crucial step, all market numbers and variables derived through an internal mathematical model were validated through an extensive network of primary research experts from all the markets studied. The respondents are selected across levels and functions to generate a holistic picture of the market studied.
- Step 5: Research Outputs: Syndicated Reports, Custom Consulting Assignments, Databases & Subscription Platforms


