
Market Overview
| Study Period | 2020 - 2031 |
|---|---|
| Forecast Data Period | 2026 - 2031 |
| Base Year Market Size (2025) | USD 54.74 Billion |
| Market Size (2026) | USD 56.68 Billion |
| Market Size (2031) | USD 67.47 Billion |
| Growth Rate (2026 - 2031) | 3.55 % |
| Market Concentration | Medium |
Major Players *Disclaimer: Major Players sorted in no particular order Image © Mordor Intelligence. Reuse requires attribution under CC BY 4.0. | |
US Investment Banking Market Analysis by Mordor Intelligence
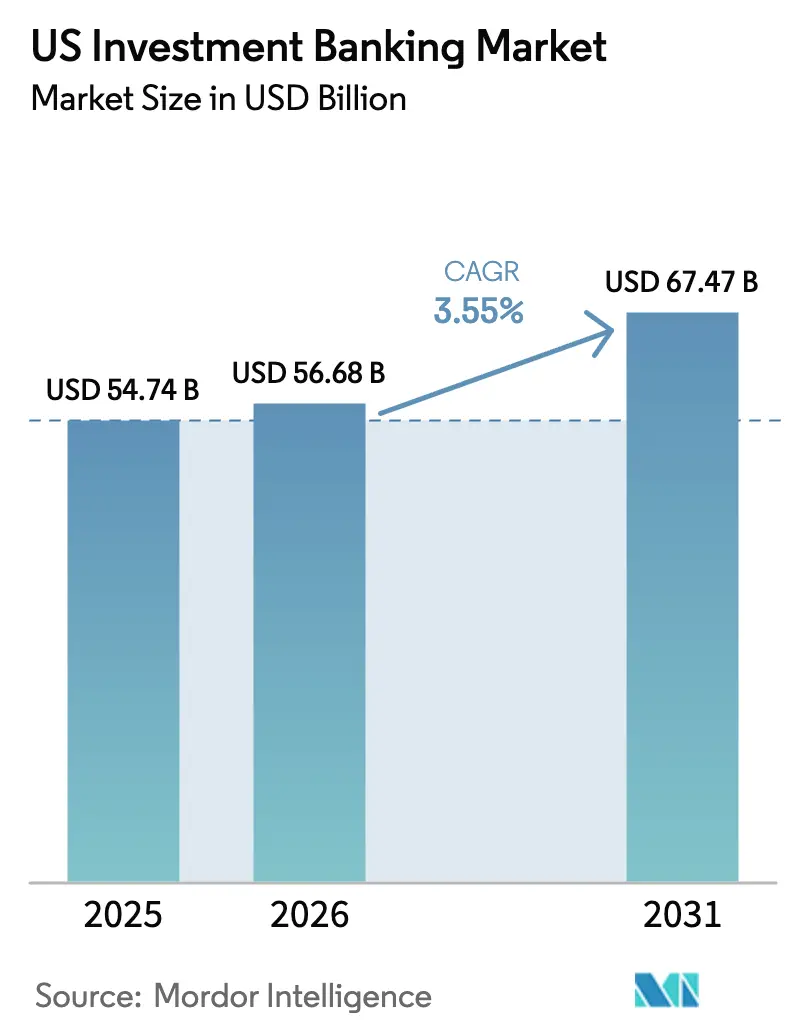
The US investment banking market size is expected to grow from USD 54.74 billion in 2025 to USD 56.68 billion in 2026 and is forecast to reach USD 67.47 billion by 2031 at 3.55% CAGR over 2026-2031. Revenue momentum derives from sponsor-led mergers, a stabilizing IPO calendar, and expanding fee pools tied to energy-transition financing supported by federal incentives. At the same time, higher policy rates, tougher Basel III requirements, and rapid private-credit growth are reshaping profitability models. Banks are building capital-solutions desks that combine private credit, equity, and hedging to deepen client wallet share. Heavy investment in generative AI and analytics is improving pitch efficiency and deal sourcing, reinforcing economies of scale across the US investment banking market.
Key Report Takeaways
- By product type, mergers & acquisitions led with 40.72% share of the US investment banking market in 2025; equity capital markets is projected to expand at a 4.74% CAGR through 2031.
- By deal size, large-cap transactions (USD 1–5 billion) captured 36.95% of the US investment banking market in 2025, whereas mega-cap deals above USD 5 billion are expected to advance at a 4.31% CAGR to 2031.
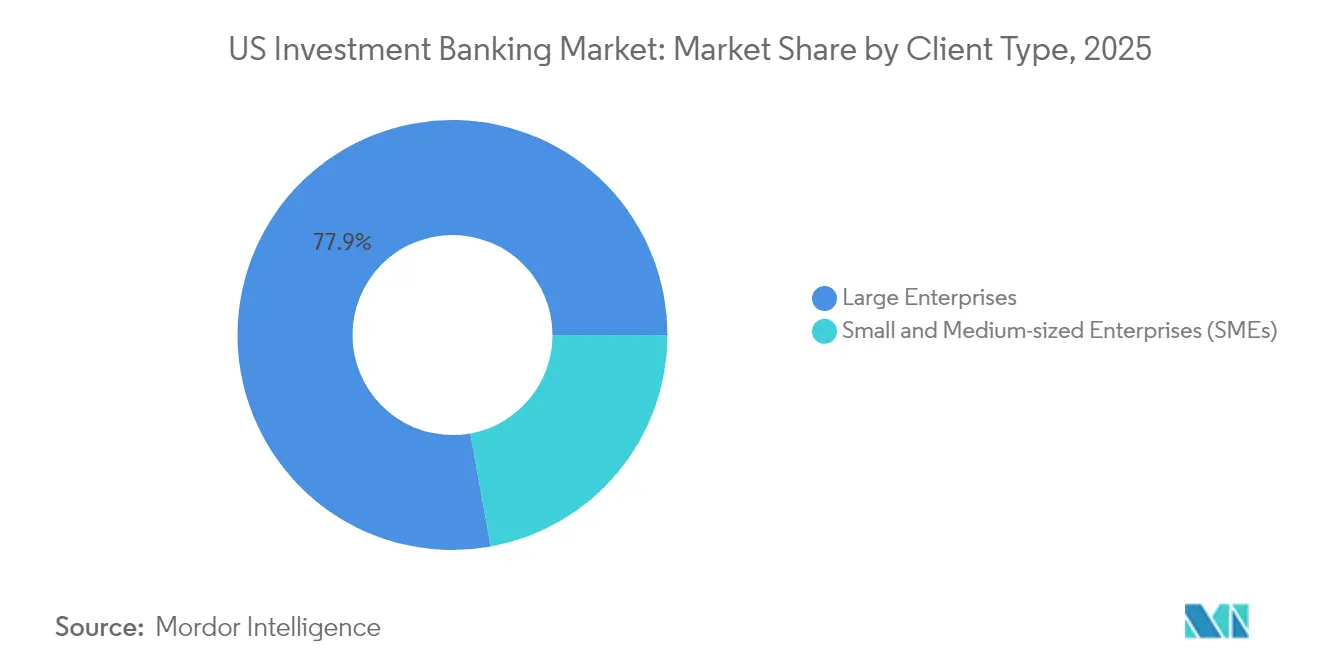
- By client type, large enterprises held 77.85% of the US investment banking market share in 2025; SME mandates are projected to grow at a 5.03% CAGR through 2031.
- By industry vertical, IT & telecommunication accounted for 23.28% of the US investment banking market in 2025; the healthcare & pharmaceuticals segment is set to rise at a 4.88% CAGR through 2031.
- Leading universal and independent platforms continue to invest in technology, sector specialization, and private-credit capabilities to defend advisory margins.
Note: Market size and forecast figures in this report are generated using Mordor Intelligence’s proprietary estimation framework, updated with the latest available data and insights as of 2026.
US Investment Banking Market Trends and Insights
Drivers Impact Analysis*
| Driver | (~) % Impact on CAGR Forecast | Geographic Relevance | Impact Timeline |
|---|---|---|---|
| Surge in private-equity dry-powder driving sponsor-led M&A | +1.2% | North America-focused | Medium term (2–4 years) |
| Balance-sheet restructuring amid higher rates boosting debt advisory | +0.8% | North America with spillover to Europe | Short term (≤ 2 years) |
| Infrastructure and energy-transition financing momentum | +0.6% | North America with selective international exposure | Long term (≥ 4 years) |
| IPO pipeline rebound in tech and healthcare | +0.7% | Major US financial centers | Medium term (2–4 years) |
| SPAC-to-traditional-deal conversions expanding hybrid fee pools | +0.3% | North America | Short term (≤ 2 years) |
| Tokenization of securities opening new fee structures | +0.4% | Global, early US adoption | Long term (≥ 4 years) |
| Source: Mordor Intelligence | |||
Surge in Private-Equity Dry-Powder Driving Sponsor-Led M&A
A record USD 1.6 trillion in uninvested capital is fueling sponsor activity, sustaining fee generation across the US investment banking market despite rate volatility[1]J.P. Morgan Chase & Co., “ESG Report 2025,” jpmorganchase.com. Sponsors facing deployment deadlines are closing mega-cap transactions that typically command 20–30% higher advisory spreads than corporate combinations. The scale of dry powder is also encouraging club deals, where multiple funds partner on a single target, further increasing fee complexity for advisors. Headline examples include ConocoPhillips’ USD 22.5 billion acquisition of Marathon Oil, which required intricate integration plans and bridge financing structures. As these large deals become more common in technology and healthcare, banks with deep sector knowledge and balance-sheet capacity are best positioned to win mandates and protect pricing power in the US investment banking market.
Balance-Sheet Restructuring Amid Higher Rates Boosting Debt Advisory
Policy rates above 5% have raised corporate refinancing costs, driving a surge in demand for liability-management advice. Citigroup’s Q4 2024 debt-advisory revenue spike highlights how issuers are leaning on banks to manage maturities and covenant pressure. Companies with upcoming 2025-2026 rollovers are requesting ESG-linked repricings, exchange offers, and hybrid securities that mitigate earnings risk. Banks able to combine derivatives, private-credit placements, and bond issuance in one proposal are capturing a larger wallet share. This environment turns debt advisory into a strategic entry point for cross-selling, supporting overall fee resilience inside the US investment banking market even while new-money deal flow softens.
Infrastructure & Energy-Transition Financing Momentum
Federal incentives under the Inflation Reduction Act have catalyzed a multi-gigawatt pipeline of renewable projects requiring sophisticated financing solutions[2]U.S. Department of Energy, “Loan Programs Office Monthly Update,” energy.gov. Deutsche Bank’s USD 11 billion SunZia mandate shows the scale at stake as lenders coordinate tax-equity, mezzanine debt, and credit guarantees. Investment banks with strong project-finance pedigrees are forming dedicated clean-energy teams to navigate evolving regulatory frameworks and community stakeholder concerns. Early movers are also advising on green-bond issuance and carbon-capture ventures, diversifying fee streams beyond traditional power-generation assets. As annual US infrastructure spending climbs, these mandates promise a durable, long-term contribution to the US investment banking market.
IPO Pipeline Rebound in Tech & Healthcare
The 2024 issuance calendar featured 154 traditional offerings raising USD 28.6 billion, and early-2025 deals such as Omada Health’s USD 150 million flotation posted a 21% first-day gain[3]Paul Hastings LLP, “2024 U.S. IPO Report,” paulhastings.com. A backlog of venture-backed unicorns in digital health, AI software, and biotech is poised to list once market windows remain open for two consecutive quarters. Underwriters are benefiting from higher gross spreads as issuers prioritize certainty of execution over fee negotiation. Private-equity exit needs and venture-capital liquidity cycles further reinforce demand for equity-capital-markets services. This creates a virtuous loop in which successful IPOs validate valuation benchmarks, attracting more candidates and expanding the US investment banking market’s growth runway.
Restraints Impact Analysis*
| Restraint | (~) % Impact on CAGR Forecast | Geographic Relevance | Impact Timeline |
|---|---|---|---|
| Elevated interest rates suppressing leveraged-finance volumes | -0.9% | North America-led | Short term (≤ 2 years) |
| Basel III “Endgame” capital charges squeezing returns | -0.7% | Global, phased US rollout | Medium term (2–4 years) |
| Private-credit rise disintermediating syndicated loans | -0.5% | US with global expansion | Long term (≥ 4 years) |
| AI capital-raising platforms eroding mid-market fees | -0.3% | Developed markets | Medium term (2–4 years) |
| Source: Mordor Intelligence | |||
Elevated Interest Rates Suppressing Leveraged-Finance Volumes
All-in yields topping 8% have rendered many private-equity buyouts uneconomical, forcing sponsors to shelve or resize transactions. Loan desks report thinner order books as traditional CLO investors demand wider spreads to absorb duration and credit risk. In response, banks are downsizing bridge commitments and demanding higher market-flex cushions, dampening underwriting fee potential. Although advisory mandates rise for capital-structure optimization, they seldom match the economics of fully underwritten financings. Until benchmark rates fall or EBITDA multiples reset, leveraged-finance softness will continue to weigh on the US investment banking market’s near-term growth.
Basel III “Endgame” Capital Charges Squeezing Returns
Proposed rules could boost common-equity Tier 1 ratios by roughly 16% for large US banks, especially penalizing market-making and OTC derivatives books[4]Arnold & Porter, “Regulatory Approval of Capital One-Discover Deal,” arnoldporter.com. The resulting higher capital density lowers ROE targets for balance-sheet-intensive activities, nudging banks toward fee-only advisory. Compliance investments—ranging from model-validation teams to data-lineage systems—further erode margins in the transition period. Mid-tier institutions without global scale face a disproportionate burden, accelerating consolidation pressure across the sector. As management reallocates scarce capital, overall wallet shrinkage could temper long-term expansion of the US investment banking market.
*Our forecasts treat driver/restraint impacts as directional, not additive. The impact forecasts reflect baseline growth, mix effects, and variable interactions.
Segment Analysis
By Product Type: Deal Advisory Strength Offsets Financing Headwinds
Mergers & Acquisitions retained a 40.72% share of the US investment banking market size in 2025. Advisory depth, sector specialization, and sponsor demand keep activity resilient even when capital-market windows narrow. Equity Capital Markets ranks as the fastest riser, projected at 4.74% CAGR, as postponed IPOs and SPAC conversions feed the backlog. Debt Capital Markets faces rate headwinds, yet complex liability-management assignments fetch premium spreads, cushioning revenue declines. Strategically, platforms integrating M&A, private credit, and ECM pitches hold an edge, exemplified by Goldman Sachs’ Capital Solutions Group.


By Deal Size: Fee Weighting Skews Toward Mega-Cap Complexity
Large-cap transactions in the USD 1–5 billion bracket controlled 36.95% share of the US investment banking market size in 2025, but mega-cap deals above USD 5 billion are forecasted to post a 4.31% CAGR, expanding their contribution to the US investment banking market. Bigger deals carry heightened regulatory scrutiny and multi-jurisdictional risk, prompting corporates to hire top-tier advisors such as those coordinating the Capital One–Discover combination. Mid-market activity faces margin compression as AI analytics empower boutiques to compete on price. To protect economics, banks deploy automated diligence, segmenting teams to align resource intensity with potential fees. When mega-cap volumes spike, market size grows disproportionately because headline fees scale non-linearly with consideration value.
By Client Type: Enterprise Relationships Anchor Revenue Streams
Large enterprises accounted for 77.85% of the US investment banking market size in 2025, anchoring the US investment banking market. Multiyear service agreements span M&A, equity, debt, and risk solutions, making churn unlikely. SME mandates are projected to rise at 5.03% annually as digital portals cut ticket-size thresholds for professional advice. Relationship-management software now steers bankers toward cross-sell gaps, improving share of wallet. Over time, this broadens the US investment banking market share base, diversifying revenue streams beyond Fortune 500 clients.
By Industry Vertical: Technology Leadership Amid Healthcare Tailwind
IT & Telecommunication accounted for 23.28% share of the US investment banking market size in 2025, driven by cloud consolidation and semiconductor deals requiring complex IP valuation. Healthcare & Pharmaceuticals, projected at 4.88% CAGR, benefits from aging demographics and biotech breakthroughs. Banks staff cross-functional teams blending regulatory counsel, scientific expertise, and capital-markets depth. Goldman Sachs’ collaboration with the MIT-IBM Watson AI Lab on biodiversity analytics shows how tailored insight differentiates service offerings. Sector-specific expertise remains essential to sustaining premium pricing in the US investment banking market.
Geography Analysis
New York anchors the US investment banking market, concentrating executive leadership, trading floors, and regulatory liaisons that facilitate complex cross-border mandates. Network effects from deep talent pools, specialized legal counsel, and institutional investors reinforce entry barriers for newcomers. San Francisco specializes in technology advisory, Boston in healthcare and asset management, and Chicago in diversified industrial and middle-market coverage, giving banks proximity to sector clusters. Cross-border revenue is meaningful as US advisors guide international issuers through SEC processes and outbound M&A. Federal infrastructure and climate legislation is redirecting coverage teams into clean-energy corridors across Texas, the Midwest, and the Mountain West, enabling banks to build local stakeholder networks that secure repeat mandates in project finance.
Regulatory Landscape
The US investment banking market operates under a multi-regulator framework led by the Securities and Exchange Commission (SEC) and FINRA, with broker-dealer supervision anchored in FINRA Rule 3110 (Supervision) and Rule 4370 (Business Continuity Plans), and data and identity protection obligations shaped by SEC Regulation S-P and S-ID. In 2026, FINRA highlighted an operating agenda that includes advancing 23-by-5 trade reporting hours and moving the Remote Inspection Pilot toward a permanent program, which affects how investment banks supervise distributed workforces and maintain auditability across sales, trading, and underwriting.
Rulemaking priorities in 2026 also touched capital formation and market-structure topics that influence issuance practices and disclosure workflows, including SEC agenda items spanning crypto assets and retail access to private markets. The resulting compliance requirements raise the need for resilient surveillance, recordkeeping, and cybersecurity controls across underwriting and secondary-market activity, while also adding execution complexity for banks that combine advisory with capital-markets distribution.
Value Chain Analysis
The US investment banking value chain begins with origination, where relationship managers and sector-coverage teams generate ideas, identify targets or issuers, and secure mandates from corporates, sponsors, and financial institutions. It then moves into execution, including M&A structuring and negotiations, underwriting and bookbuilding for equity and debt offerings, plus the legal, accounting, and due-diligence workstreams needed to close transactions.
Distribution and aftermarket support are the next layer, covering sales and trading, market making, and ongoing investor coverage that supports liquidity and pricing for issued securities. Large integrated platforms such as J.P. Morgan Chase & Co., Goldman Sachs, Bank of America, Morgan Stanley, and Citi link investment banking with institutional distribution, risk management, and wealth-management channels, using technology and analytics as core infrastructure to improve deal sourcing, syndication efficiency, compliance, and client reach.
Competitive Landscape
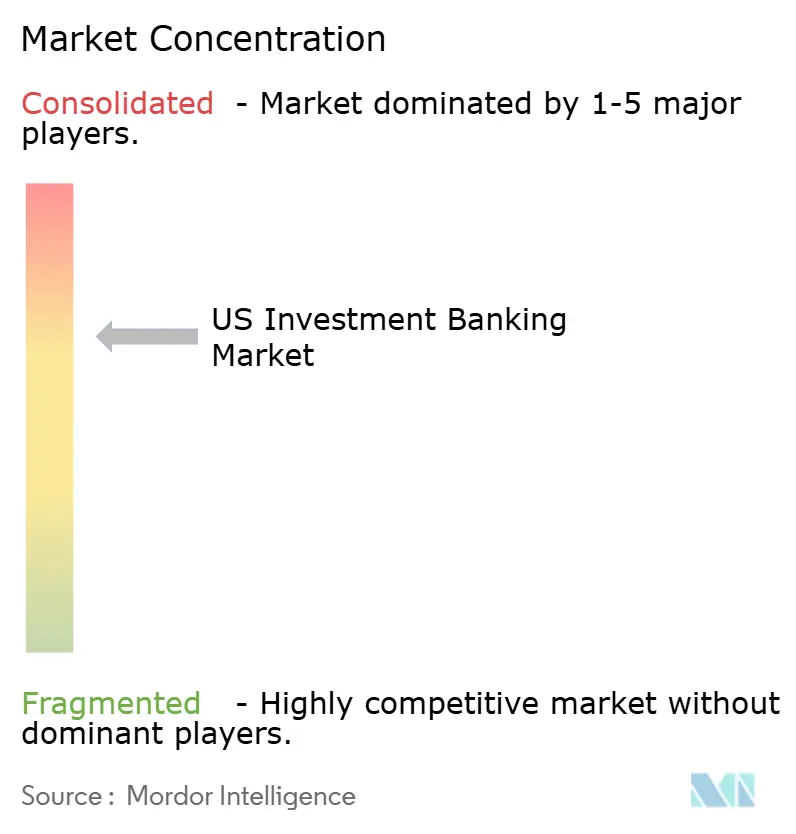
The US investment banking market is moderately concentrated, with a handful of systemically important financial institutions capturing a clear majority of advisory and underwriting fees and setting pricing norms for the rest of the industry. These universal banks leverage large balance sheets, integrated capital-markets platforms, and multi-decade client relationships to retain lead-left roles on most marquee transactions, creating high barriers to entry for emerging rivals. Their scale advantage is further entrenched by heavy spending on data infrastructure and regulatory compliance systems that smaller firms struggle to replicate. The resulting fee pool is therefore tilted toward incumbents, allowing them to exercise meaningful negotiating power over syndicate economics and client retainer structures. Industry observers note that this configuration leaves limited room for mid-tier players to break into the top tier without a niche specialization or transformative acquisition strategy.
Independent boutiques counter the dominance of universal banks by emphasizing conflict-free advice, senior-level attention, and sector depth. Although they collectively hold a smaller slice of the market, boutiques frequently win high-profile mandates in technology, healthcare, and energy, where boardrooms value specialization over balance-sheet support. Their success has encouraged larger banks to set up sector-focused pods that mirror boutique intimacy while retaining full-service capabilities. Technology investment is becoming a decisive differentiator across both groups; Goldman Sachs’ deployment of a generative-AI assistant to thousands of bankers illustrates how scale players intend to widen efficiency gaps. Boutiques respond by adopting cloud-based analytics suites, but the capital required to keep pace underscores the structural advantages enjoyed by the largest institutions.
Private-credit capability represents the newest competitive front. Universal banks now pitch loan-to-own, unitranche, and NAV-backed solutions from captive direct-lending arms, offering deal certainty that pure advisory shops cannot match. Boutiques without balance-sheet capacity compensate through alliances with alternative-asset managers, ensuring participation in sponsor processes even when traditional syndication is bypassed. As direct lending gains share, advisory houses that secure reliable capital partners should preserve relevance, while scale banks will consolidate their hold over integrated mandates that bundle financing and strategic counsel.
US Investment Banking Industry Leaders
J.P. Morgan Chase & Co.
Goldman Sachs
Bank of America
Morgan Stanley
Citi
- *Disclaimer: Major Players sorted in no particular order

Market Opportunities and Future Outlook
Capital-solutions and financing packages that blend private credit, structured equity, and hedging represent a clear whitespace as private-credit providers compete with traditional syndicated markets and issuers focus on certainty of funds. This shift is reflected in the continued build-out of multi-asset, technology-enabled distribution and trading capabilities by large banks, including participation by major dealers in AI-supported corporate bond e-trading venues intended to improve liquidity and execution.
A second opportunity sits at the intersection of tokenization and market infrastructure modernization. In June 2026, JPMorgan Chase & Co., Bank of America, and Citi announced plans for a shared tokenized deposit network operated by The Clearing House, bringing transaction banking rails closer to real-time liquidity management and creating additional fee paths across issuance support, treasury advisory, and digital-asset adjacent servicing. Separately, regulatory agendas in 2026 that address crypto assets and retail access to private markets increase the premium on compliant product structuring, disclosure, and investor education, favoring platforms that can combine underwriting, custody-adjacent partnerships, and robust supervision controls.
Recent Industry Developments
- July 2026: Goldman Sachs reports 2026 second-quarter earnings, highlighting increased IB activity. IB fees momentum from equity and debt underwriting reflects improving deal pipelines. Reinforces pricing power and profitability outlook for large banks in advisory and underwriting.
- July 2026: Citigroup reports second-quarter 2026 investment banking revenues of $1.9 billion, up 34%. The revenue growth signals stronger deal flow and expanding client activity in advisory and underwriting. Supports more favorable fee pool dynamics and competitive positioning among majors.
- June 2026: JPMorgan, Bank of America, and Citi announce plans for a shared tokenized deposit network to be operated by The Clearing House. The initiative introduces blockchain-enabled liquidity and real-time settlement capabilities for interbank activities. Accelerates digital settlement capabilities and cross-border payment infrastructure among leading banks.


Research Methodology Framework and Report Scope
Market Definition and Coverage
This market covers revenues earned in the United States from investment banking services, mainly advisory and underwriting work completed for corporate, institutional, and sponsor clients, reported in USD for the defined time period.
Scope exclusions: We exclude retail brokerage, asset management, and pure trading revenue that is not directly tied to investment banking mandates or fee-based deal execution.
Segmentation Overview
- By Product Type
- Mergers & Acquisitions
- Debt Capital Markets
- Equity Capital Markets
- Syndicated Loans & Others
- By Deal Size
- Mega-cap ( More than USD 5 billion)
- Large-cap (USD 1-5 billion)
- Mid-market (USD 250 million - 1 billion)
- Small-cap (Less than USD 250 million)
- By Client Type
- Large Enterprises
- Small and Medium-sized Enterprises (SMEs)
- By Industry Vertical
- Banking, Financial Services, Insurance (BFSI)
- IT & Telecommunication
- Manufacturing
- Retail And E-Commerce
- Public Sector
- Healthcare And Pharmaceuticals
- Other Industry Verticals
Data Sources, Market Sizing, and Validation
Desk Research
Desk work started by mapping the fee and deal activity cycle that drives investment banking revenues, then linking that cycle to public data series that are updated on a regular schedule. We relied on official and open sources such as SEC filings and company annual reports, Federal Reserve releases (rates and credit conditions), U.S. Census Bureau and BEA data for macro context, and IRS and BLS series to sanity check industry employment and compensation trends.
To anchor the underwriting and advisory pipeline, we also referenced sources such as SIFMA publications, FINRA statistics, and public exchange and issuer announcements that show issuance windows. For cross-checks, we used company presentations, reputable financial press, and paid subscriptions for company financials and news screening, plus a patents database to track workflow automation signals that can shift cost and productivity assumptions. This list is illustrative, and additional public and paid sources were reviewed to compile data, validate figures, and clarify open questions.
Primary Interviews and Surveys
Primary work focused on validating how fee pools are formed across advisory and underwriting, and how quickly pricing moves when deal volumes recover. We spoke with banking practitioners, finance leaders at issuers, and service providers that see mandates flow through the market, and we used those inputs to close gaps left by public reporting and confirm key assumptions by client type and deal size.
Distribution of primary research fieldwork respondents
| Company type | Respondent position |
|---|---|
| Top tier: 32% | CXOs: 16% |
| Mid tier: 49% | Functional/Unit leaders: 37% |
| Smaller Players: 19% | Managers: 47% |
Market-Sizing & Forecasting
The core sizing logic uses a top-down build that starts with the addressable fee pool in the United States and allocates it to investment banking services using deal activity signals and service mix splits. We then corroborate totals with selective bottom-up approximations, such as sampled bank-level revenue disclosures, published fee-share league table patterns, and simple ASP times volume checks for underwriting and advisory mandates, which are used to adjust any obvious over or under counts.
A few practical inputs were treated as the main market fingerprints because they move revenues in visible ways, including completed M&A volumes, IPO and follow-on issuance activity, debt issuance cycles, and syndicated loan origination momentum, along with typical fee rate ranges observed by deal size. We also tracked interest rate direction and volatility, since they change issuance timing and sponsor-led deal confidence, and refined assumptions through expert feedback where public data is lagging. Forecasting uses scenario analysis supported by trend smoothing on key activity indicators, so the outlook stays readable even when quarterly deal windows are uneven. Where bottom-up disclosures are missing for smaller firms, we filled the gap using peer medians and service mix ratios, then rechecked implied revenue per employee to keep outputs realistic.
Data Validation & Update Cycle
Outputs are validated through multiple checks, starting with internal consistency tests across product mix, implied fees, and macro-linked demand signals, then moving into variance reviews against independent indicators such as issuance totals and completed deal counts. If a number looks off, we revisit the drivers, recheck unit assumptions, and recontact a small set of experts to confirm whether the change reflects a real market shift or a data timing issue.
Before sign-off, another analyst reviews the model logic and key inputs, and any outliers are documented with the reason for adjustment. Reports are refreshed annually, and interim updates are made when material events occur, such as sharp rate changes or major shifts in issuance sentiment. Right before delivery, a final pass is completed so clients receive the latest updated view.
Mordor Intelligence's US Investment Banking Market Size Measured Against Other Published Estimates
Published market sizes for US investment banking do not always match because the term market gets interpreted differently, and because some sources track fees while others use broader revenue lines. Timing also matters, since deal closures and issuance windows can shift revenue recognition across years even when the pipeline looks strong.
By tracking fee pool components and scope boundaries, Mordor Intelligence ties the estimate to advisory and underwriting revenues rather than only league table fee totals, and it refreshes mix assumptions when issuance and M&A calendars shift, which changes what gets counted in the same year.
Benchmark comparison
| Source | Market Size | Gaps in Research Methodology |
|---|---|---|
| Mordor Intelligence | USD 54.74 B (2025) | |
| Trade Data Provider A | USD 66.80 B (2025) | Often reflects an investment banking fees pool lens that aggregates advisory, ECM, DCM, and syndicated lending fees, which can run higher than service revenue when fee attribution and completion timing are treated differently. |
| Industry Dataset B | USD 117.40 B (2024) | Uses a global fees total for a single year and then allocates by region, so the figure is not a US-only revenue value and can include fee categories and attribution rules that do not align to a US service revenue definition. |
The spread in the table is mainly explained by whether the publisher is counting a fee pool view, a broader regional allocation, or a US service revenue boundary, and by how deal completion timing is handled. Our approach stays traceable to observable deal activity and service mix drivers, so the final number can be recreated and updated when the same signals move.


Key Questions Answered in the Report
What is the current size of the US investment banking market?
The market is valued at USD 56.68 billion in 2026.
How fast is the US investment banking market expected to grow?
It is projected to expand at a 3.55% CAGR, reaching USD 67.47 billion by 2031.
Which product category leads the market?
Mergers & Acquisitions led with a 40.72% market share in 2025.
What factors are driving growth in equity capital markets?
A recovering IPO window in technology and healthcare, combined with SPAC conversions, supports a 4.74% CAGR for ECM mandates.
How is private credit affecting traditional investment banking?
Private-credit growth disintermediates syndicated loans but enables banks with captive funds to offer new capital-solution services.
Why is infrastructure finance a focus area for banks?
Federal incentives for clean-energy projects require complex tax-equity and project-finance structures, creating durable fee pools for experienced advisors.
Page last updated on:


 Your data is secure and never sold or shared.


