
Market Overview
| Study Period | 2020 - 2031 |
|---|---|
| Forecast Data Period | 2026 - 2031 |
| Historical Data Period | 2020 - 2024 |
| Market Size (2026) | USD 3.47 Billion |
| Market Size (2031) | USD 4.70 Billion |
| Growth Rate (2026 - 2031) | 6.30 % |
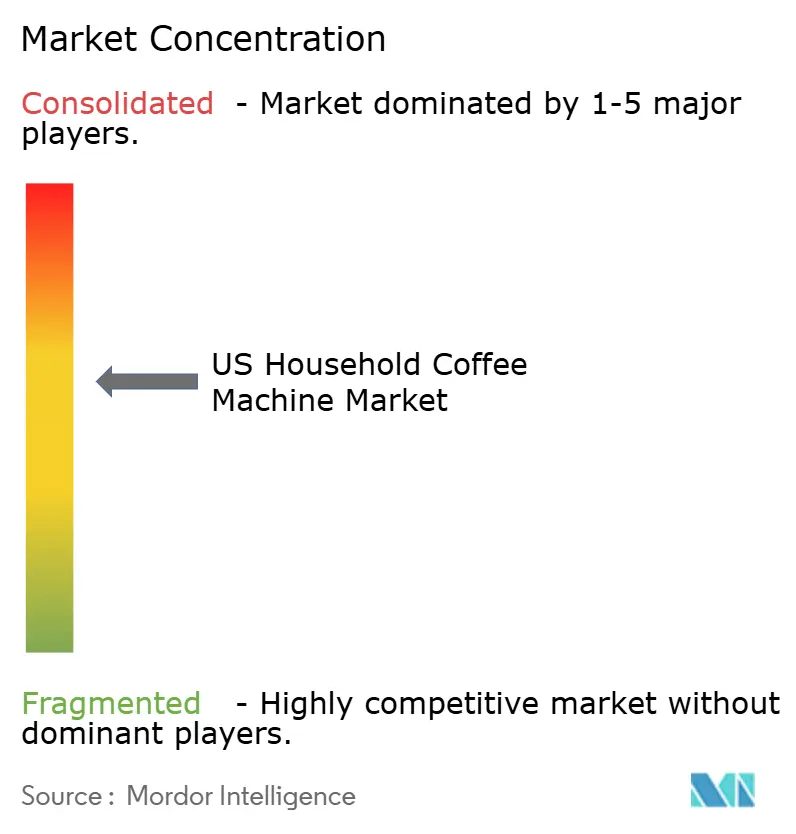
| Market Concentration | Medium |
Major Players *Disclaimer: Major Players sorted in no particular order Image © Mordor Intelligence. Reuse requires attribution under CC BY 4.0. | |
US Household Coffee Machine Market Analysis by Mordor Intelligence
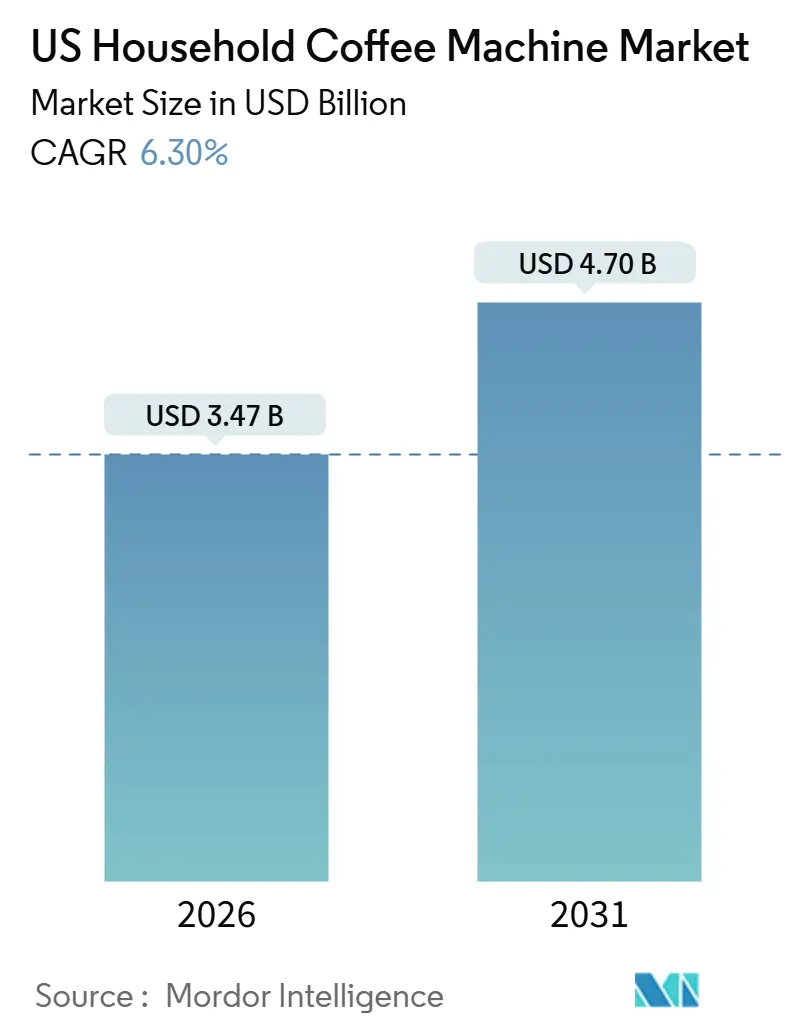
The US Household Coffee Machine Market size is estimated at USD 3.47 billion in 2026, and is expected to reach USD 4.70 billion by 2031, at a CAGR of 6.30% during the forecast period (2026-2031).
Demand resilience is anchored in single-serve convenience, rising at-home espresso culture, and the steady rollout of smart, voice-enabled appliances. Producers are strengthening value propositions through premium stainless-steel designs, refillable pod formats, and app-driven personalization, each broadening margins while calming price sensitivity. Component sourcing pressures and green-coffee price volatility remain headwinds, yet companies are offsetting these inputs with SKU rationalization and higher average selling prices. Environmental regulation of disposable pods looms as a critical pivot point, encouraging firms to speed up plant-based or fully recyclable pod programs.
Key Report Takeaways
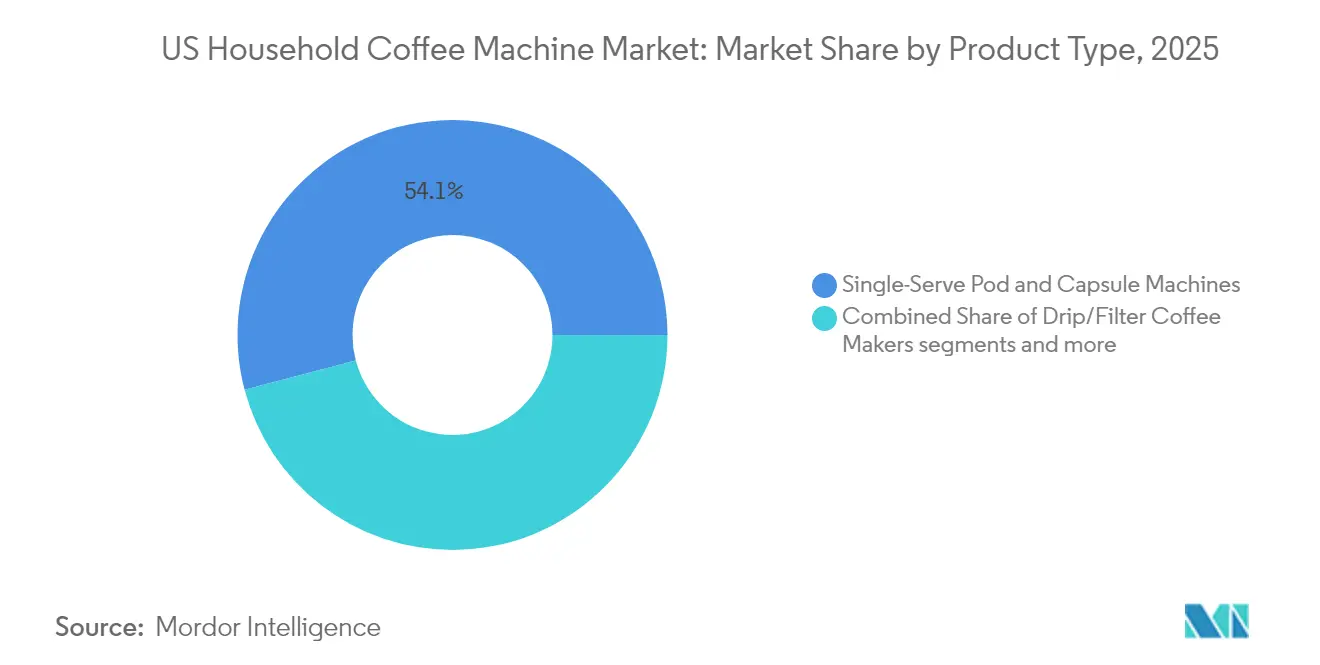
- By product type, single-serve pod and capsule machines led with 54.10% of the US household coffee machine market revenue share in 2025; espresso machines are projected to post the fastest 8.62% CAGR through 2031.
- By technology, semi-automatic units held 35.10% of the US household coffee machine market share in 2025, while smart/connected machines are forecast to expand at a 9.35% CAGR to 2031.
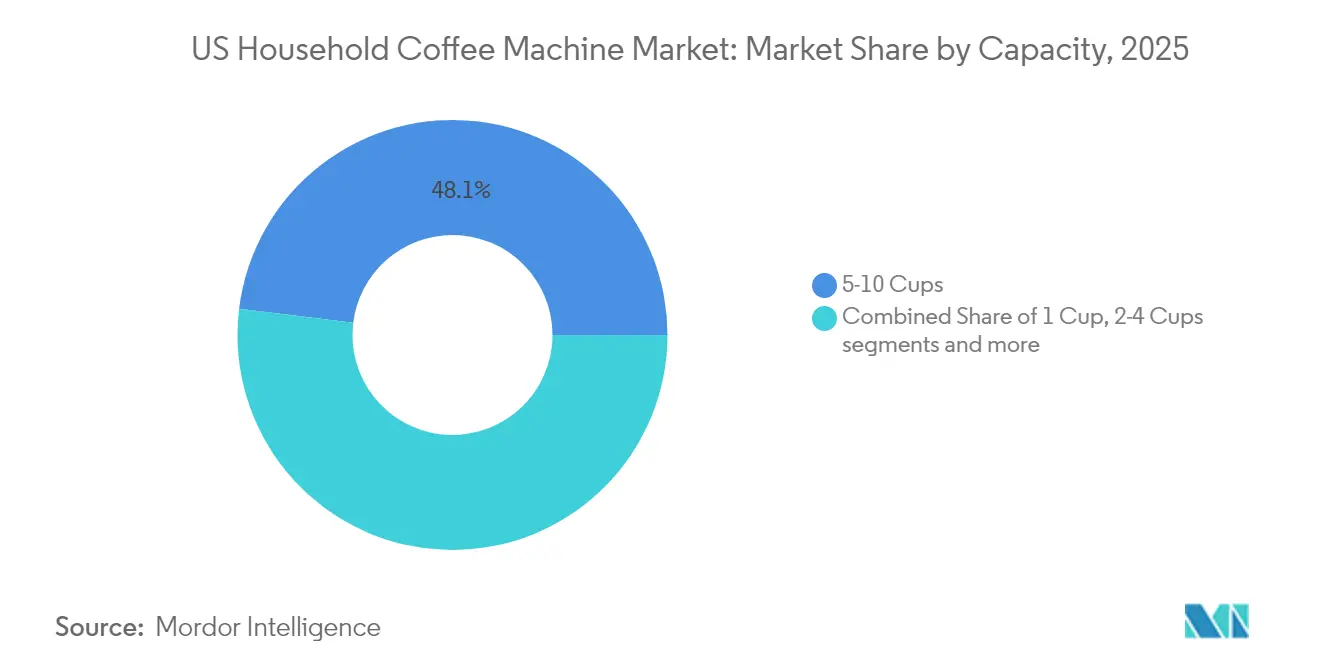
- By capacity, 5–10 cup brewers accounted for 48.05% of the US household coffee machine market size in 2025; single-cup systems are advancing at an 7.68% CAGR through 2031.
- By price range, mid-range models (USD 101-300) captured 39.10% of the US household coffee machine market sales in 2025, yet premium units (USD 301-700) will see a 6.55% CAGR to 2031.
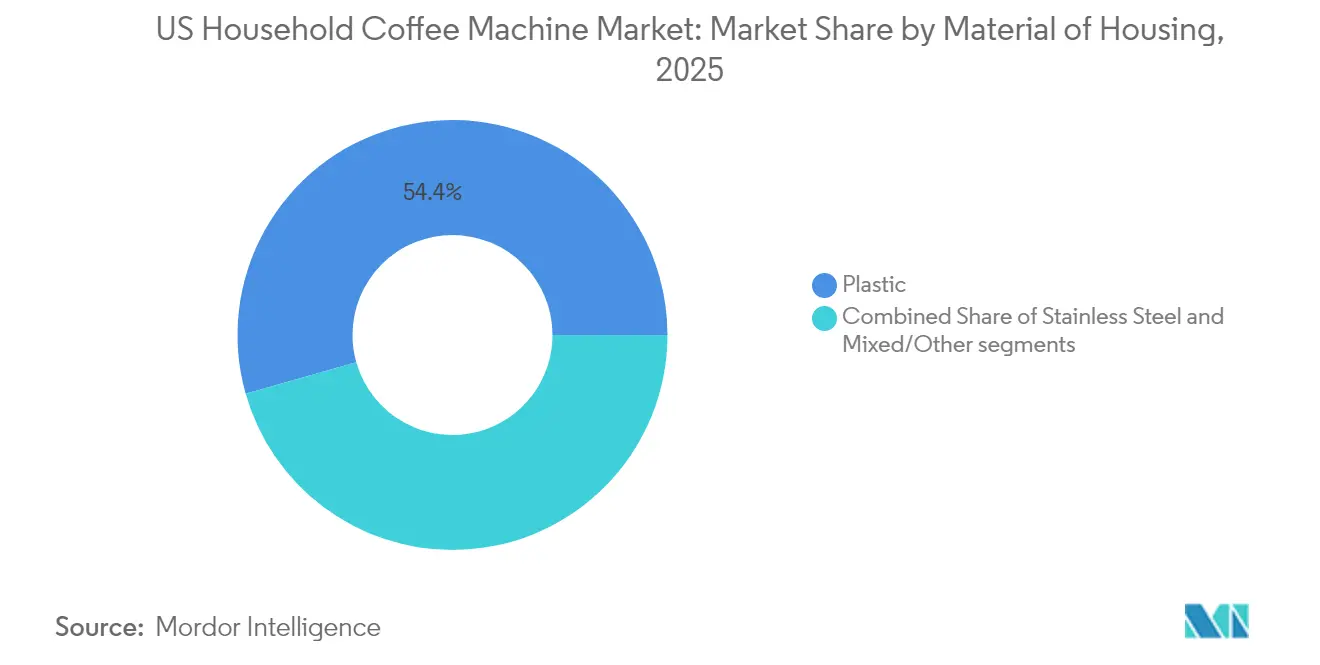
- By Material of Housing (Value), plastic led with 54.40% of the US household coffee machine market revenue share in 2025; stainless steel is advancing at a 5.55% CAGR through 2031.
- By distribution channel, supermarkets and hypermarkets retained 38.75% of the US household coffee machine market share in 2025; online channels are set to climb at a 11.98% CAGR to 2031.
- By region, South region retained 35.95% of the US household coffee machine market share in 2025; west region is set to climb at a 7.20%CAGR to 2031.
Note: Market size and forecast figures in this report are generated using Mordor Intelligence’s proprietary estimation framework, updated with the latest available data and insights as of 2026.
US Household Coffee Machine Market Trends and Insights
Drivers Impact Analysis*
| Driver | (≈) % Impact on CAGR Forecast | Geographic Relevance | Impact Timeline |
|---|---|---|---|
| Single-serve convenience adoption | +1.8% | Urban concentrations nationwide | Medium term (2-4 years) |
| Specialty espresso at home | +1.5% | Affluent metros | Long term (≥ 4 years) |
| Smart/IoT coffee machine | +1.2% | Tech-forward regions | Medium term (2-4 years) |
| Premium stainless-steel aesthetics | +0.9% | High-income cohorts | Long term (≥ 4 years) |
| Hybrid work-from-home consumption | +0.8% | Knowledge-worker hubs | Short term (≤ 2 years) |
| Source: Mordor Intelligence | |||
Increased Adoption of Single-Serve Pod Machines Due to Convenience in US Households
Keurig has seeded more than 40 million active brewers, putting single-serve capability into nearly one-third of US homes and deepening an ecosystem that delivers annuity-like pod revenue. Rival brands are answering with proprietary capsule lines that attempt to capture similar attachment rates. Convenience spans speed, portion control, and consistent quality, all of which resonate with time-pressed consumers. Hardware upgrades—such as quieter pumps and brew-strength selectors—help sustain replacement demand even as household penetration matures. Notably, Keurig’s Q4 2024 brewer shipments rose 7.3% year over year, hinting at hardware stability despite soft pod volumes [1]Investor Relations Team, “Q4 2024 Earnings Presentation,” Keurig Dr Pepper, investors.keurigdrpepper.com .
Growing Consumer Preference for Specialty Espresso-Based Beverages Fuelling At-Home Espresso Machine Sales
De’Longhi recorded 14% 2024 revenue growth, with coffee systems contributing 62% of turnover, underscoring strong consumer desire for barista-style beverages at home [2]Annual Report 2024, “Sustainability in Practice,” De’Longhi Group, delonghigroup.com . Automatic tamping, precision grind sensors, and one-touch milk texturing have lowered skill barriers and widened the espresso addressable base. Breville’s Barista Express Impress exemplifies premiumization, marrying Italian group-head components with North American software to command higher price points. Social media tutorials and subscription micro-roasters complete the “café at home” narrative, reinforcing equipment upgrades.
Rising Penetration of Smart/IoT-Enabled Appliances Integrating with Voice Assistants in US Households
Bosch’s Home Connect interface allows remote starts, recipe uploads, and maintenance alerts, turning a routine brew cycle into data-rich engagement. Manufacturers monetize post-purchase relationships through app-based consumable reminders and software unlocks for custom profiles. Voice-assistant triggers fold coffee into broader smart-home routines, raising switching costs for consumers once preferences are stored in the cloud. Early adopters help refine machine-learning calibration, setting higher performance expectations for subsequent releases.
Premiumization Trend with Stainless-Steel and Designer Coffee Makers Encouraged by Higher Disposable Incomes
Hamilton Beach reported that premium SKUs contribute 40% to the total US small-appliance revenue, with its premium sub-brand, Lotus, strategically positioned to capitalize on this growth segment[3]2024 Form 10-K, Hamilton Beach Brands Holding Company, hamiltonbeachbrands.com . Smeg has effectively demonstrated that retro styling and coordinated color schemes can support price points exceeding USD 700. Limited-edition collaborations and customizable finishes have elevated coffee machines into aspirational products, reflecting broader trends in the luxury home market. In the premium segment, stainless steel construction has become a standard requirement, offering durability, superior heat retention, and a professional kitchen aesthetic that justifies higher pricing. Manufacturers are increasingly utilizing celebrity chef endorsements and design accolades to reinforce their premium market positioning.
Restraints Impact Analysis*
| Restraint | (≈) % Impact on CAGR Forecast | Geographic Relevance | Impact Timeline |
|---|---|---|---|
| Environmental scrutiny of single-use pods | -1.4% | Eco-focused states | Medium term (2-4 years) |
| Drip-machine saturation | -0.8% | Mature suburban markets | Long term (≥ 4 years) |
| Supply-chain disruptions in the electronic components market are driving up average selling prices (ASPs) and increasing inventory management risks, particularly for smart and connected appliance manufacturers | -0.6% | National | Short term (≤ 2 years) |
| The perceived disparity in roasting quality between home appliances and café-prepared coffee is hindering adoption among premium coffee consumers. | -0.4% | National, with a stronger impact in metropolitan regions characterized by a well-established café culture | Medium term (2-4 years) |
| Source: Mordor Intelligence | |||
Environmental Concerns Over Single-Use Plastic/Aluminium Pods Leading to Regulatory Scrutiny
The USD 1.5 million settlement with the SEC regarding K-Cup recyclability claims highlights the escalating financial risks associated with sustainability-related disclosures. The growing adoption of municipal extended-producer-responsibility regulations is shifting the burden of waste management costs onto manufacturers, creating pressure to innovate and adapt. This regulatory environment is driving significant investment in research and development, particularly in sustainable packaging solutions. For instance, Keurig is set to launch K-Rounds, which are designed to be plant-based or fully compostable, aligning with evolving consumer and regulatory expectations. While these compliance-driven investments are increasing capital expenditures, companies that proactively embrace sustainability initiatives stand to gain a competitive advantage. Early movers can enhance their brand equity, appeal to the expanding base of eco-conscious consumers, and potentially mitigate future regulatory and reputational risks.
Saturation of the Drip Coffee Machine Segment Limiting Incremental Unit Growth
Drip-machine manufacturers are increasingly focusing on replacement cycles as a strategic response to the saturation of unit penetration in the market. Hamilton Beach, which holds a leading share in unit sales, reported a 4.6% revenue growth in 2024. This performance highlights a critical trend: market growth is being driven by premium upgrades and enhanced product features rather than an increase in unit volume. To remain competitive, brands are introducing advanced innovations such as micro-filtered brew baskets, hot-plate temperature optimization algorithms, and mobile-enabled prompts. These technological advancements are designed to accelerate the transition from older models to newer ones, thereby sustaining consumer interest. However, despite these efforts, the profit margins in the drip-machine segment remain narrower compared to the more lucrative pod and espresso machine categories, presenting a challenge for manufacturers aiming to maximize profitability.
*Our forecasts treat driver/restraint impacts as directional, not additive. The impact forecasts reflect baseline growth, mix effects, and variable interactions.
Segment Analysis
By Product Type: Convenience Leadership With Espresso Momentum
Single-serve systems controlled 54.10% of 2025 revenue, cementing their role as the everyday solution for speed-conscious consumers. Espresso machines, though smaller in base, are forecast to rise 8.62% annually as households chase authentic café texture. Innovation such as De’Longhi’s Bean Switch dual-hopper lets users pivot beans without purging, fusing convenience with craft. Combination brewers straddle multiple tastes within one chassis, easing counter-space friction. Drip, percolator, and French press formats persist but rely on niche artisanal enthusiasts, emphasizing manual ritual over automation.
For manufacturers, balancing pod profitability with espresso-driven premium ASPs shapes portfolio planning across the US household coffee machine market. Consumer narratives now celebrate skill progression: entry-level pod units introduce varietal exploration, while aspirational messaging guides users toward semi-automatic espresso platforms. Brands layer loyalty apps and roasting partnerships onto this ladder, ensuring repeat interaction beyond the initial sale. This ecosystem approach underpins hardware design decisions and marketing cadence across peak gifting seasons in the US household coffee machine market.


By Technology: The Pivot From Semi-Automatic Foundations to Connected Ecosystems
Semi-automatic machines retained a 35.10% share in 2025, confirming their appeal to hobbyists who value dosage control without full manual effort. Yet the smart cohort is scaling at 9.35% CAGR as Wi-Fi modules and firmware updates extend appliance lifecycles. Connected dashboards harvest brew-cycle analytics, guiding future feature releases and creating subscription upsell hooks. Fully automatic and super-automatic tiers address luxury seekers wanting zero-friction espresso, with voice-activated frothing now mainstream in showroom demos.
Manual pour-over stations and moka pots anchor the craft segment, but their modest growth underscores mainstream gravitation toward guided consistency. Expect firmware-driven flavour profiles—downloadable holiday blends, for instance—to differentiate next-gen releases, reinforcing software as the new value frontier in the US household coffee machine market.
By Capacity: Mid-Volume Dominance With Single-Cup Upswing
Brewers sized for 5–10 cups commanded 48.05% of 2025 sales, mirroring multi-person households and weekend entertaining. Single-cup appliances are forecast to expand 7.68% annually, propelled by household downsizing and beverage personalization. Variable reservoir designs now let families toggle between batch and pod modes, reducing counter clutter. Larger-than-10-cup offerings find traction in at-home entertaining and small-office micro-kitchens, while 2–4-cup niches speak to solo professionals and student housing.
Higher per-cup margin on pods incentivizes brand push toward single-cup hardware, but maintaining a balanced capacity mix helps hedge against demographic shifts. This segmentation accordingly guides inventory buys for retail partners within the US household coffee machine market.
By Price Range: Mid-Range Mass With Premium Tailwinds
Units priced USD 101-300 captured 39.10% of 2025 turnover, anchoring value-centric demand. Premium tiers between USD 301-700 are projected to grow 6.55% CAGR as households justify higher outlays for brushed-metal finishes, PID temperature control, and smartphone pairing. Budget-conscious consumers find solace in economy models, yet these models grapple with rising costs due to electronics inflation. Meanwhile, luxury segments leverage brand prestige and seamless interior design integration to maintain their allure.
Manufacturers deliberately ladder SKUs—basic pod brewers lead customers into step-up bundles with milk carafes and connected modules, preserving engagement across economic cycles. Such tiered strategies will remain pivotal throughout the US household coffee machine market.
By Material of Housing: Plastic Practicality Versus Stainless-Steel Prestige
Plastic bodies still own 54.40% share due to manufacturing efficiency and lightweight shipping. Stainless-steel shells, however, are pacing at 5.55% CAGR because consumers equate metal with durability and professional calibre. Hybrid builds mix polymer frames with metal facings, achieving cost-engineering balance while conveying premium cues. Glass and ceramic inserts cater to specialty segments demanding thermal neutrality or aesthetic contrast.
Raw-material decisions also intersect with sustainability messaging: recycled ocean-bound plastics and low-carbon steel are emerging badge claims, aligning with broader ESG commitments across the US household coffee machine market.
By Distribution Channel: E-Commerce Surge Reshaping Retail Mix
In 2025, supermarkets and hypermarkets represented a 38.75% market share, driven by the ability to offer in-aisle product comparisons and bundled coffee-bean promotions. Online platforms, expanding at a 11.98% CAGR, leverage extended product assortments and dynamic pricing models, reinforcing their role in enhancing product launch visibility. Hamilton Beach demonstrated this trend, with e-commerce accounting for 44% of its domestic sales, emphasizing the strategic importance of digital channels for driving sales volumes and gathering actionable consumer insights. Specialty retailers and department stores remain essential for providing experiential product demonstrations, while brand-owned websites focus on optimizing profit margins and capturing first-party data.
The transformation of distribution channels highlights the critical role of omnichannel strategies, requiring manufacturers to optimize engagement across diverse touchpoints while addressing channel conflicts and ensuring pricing consistency. Companies like Hamilton Beach are investing in digital transformation initiatives to enhance their competitive positioning in the rapidly growing e-commerce segment. Warehouse clubs appeal to bulk buyers and cost-conscious consumers but face growth limitations due to membership requirements and a narrower product range compared to online marketplaces. The shift toward online purchasing is particularly evident in the premium segment, where consumers conduct extensive research, relying on detailed product specifications, expert reviews, and peer recommendations available through digital platforms.
Geography Analysis
In 2025, the South region contributed 35.95% to the overall market revenue. Southern states, buoyed by rapid population inflows, exhibit hybrid preferences: single-serve pods for weekday speed and espresso features for culturally influenced palates. E-commerce adoption overcomes limited specialty-store footprints, giving smaller brands a direct route to new users. Hispanic demographic strength raises demand for Cafecito-ready pressure profiles.
In 2025, the West region contributed 7.10% to the total market revenue. The region demonstrates a convergence of environmental consciousness and technological innovation. Manufacturers leveraging app-based energy management systems and biodegradable capsule compatibility are outperforming market averages. High residential real estate prices are driving demand for premium countertop designs, boosting the adoption of stainless steel and designer coffee machines. Additionally, the prevalence of cross-channel shopping—where consumers research online and purchase from boutique stores—has necessitated agility among fulfillment partners in the US household coffee machine market.
In the Northeast, espresso-centric habits and above-average disposable incomes fuel demand for premium connected machines. Retailers such as Williams-Sonoma curate European brands, reinforcing the perception of espresso as an everyday luxury. Environmental sensibilities spur interest in refillable stainless pods and energy-efficient standby modes.
The Midwest remains the bastion of drip volume, where large-capacity carafes satisfy multi-generation households. Price-value equations dominate, positioning mid-range semi-automatic offerings as sweet-spot purchases. Weather-driven indoor routines amplify brewer replacement activity each winter, sustaining baseline turnover.
Regulatory Landscape
US household coffee machines sit under electrical product safety and consumer protection requirements, with the Consumer Product Safety Commission (CPSC) enforcing the Consumer Product Safety Act framework and requiring manufacturers/importers to maintain test-based compliance documentation (including a general certificate of conformity where applicable). Product safety programs in the category commonly align to ANSI/UL 1082 (Household Electric Coffee Makers and Brewing-Type Appliances), which had significant revisions that became effective on July 10, 2024, raising the importance of updated safety design and verification for heating controls, electrical integrity, and feature-rich platforms.
Trade policy and standards compliance shape landed cost and time-to-market for a category that is import-heavy. Household coffee and tea makers are classified under HTS 8516.71.00 with a 3.7% general duty rate (as referenced for 2026), while China-origin imports under the same code face additional Section 301 tariffs, lifting the effective duty burden (cited as 21.2% as of June 2026 in the evidence pack). While DOE/EPA efficiency programs such as FEMP and ENERGY STAR are more directly tied to commercial coffee brewers, their energy-management metrics (for example, energy save mode) act as a reference point for standby power and connected-feature energy design priorities that also influence household product positioning and retailer screening.
Value Chain Analysis
The US household coffee machine value chain splits into (1) hardware design, manufacturing, and inbound component sourcing, and (2) consumable ecosystems that monetize usage through pods/capsules and branded coffee partnerships. Hardware supply is anchored in global component tiers (heating elements, pumps, electronics, plastics/steel housings), with final assembly and finished-goods supply heavily import-oriented; this structure amplifies exposure to logistics volatility, electronics availability, and tariff-driven cost swings. Brand owners and OEM/ODM manufacturing partners manage tooling, compliance testing (including alignment to UL safety expectations), packaging, and retailer-ready configurations across multiple price tiers.
Downstream, distribution spans mass retail (supermarkets/hypermarkets and big-box), specialty appliance retailers, and rapidly expanding e-commerce, where rich content and review ecosystems influence conversion, especially for premium espresso and smart/connected models. Platform-based players strengthen pull-through economics by coupling brewers with proprietary consumables, using licensing and co-brand agreements with roasters to protect pod demand. In April 2026, Keurig Dr Pepper extended and expanded its strategic partnership with Nestle USA tied to Starbucks K-Cup pod manufacturing and distribution in the United States and Canada, illustrating how value-chain control is reinforced through branded coffee alliances alongside appliance footprints.
Competitive Landscape
The coffee machine market in the US is moderately concentrated. Keurig and Nespresso are key players in the value share within the pod ecosystem, leveraging their closed-loop consumables to secure consistent repeat revenue and maintain high gross margins. In response, established appliance brands such as Hamilton Beach, De’Longhi, and Breville are introducing advanced drip and espresso machines, strategically targeting both mass-market and specialty distribution channels. The pace of innovation remains robust: Keurig addresses environmental concerns with its K-Rounds, De’Longhi enhances product flexibility with its Bean Switch feature, and Breville incorporates shot-by-shot auto-tamping technology to elevate user experience.
Strategy clusters are distinct. Platform captains (Keurig, Nespresso) expand brewer footprints to lock in pod pull-through. Premium artisans (Breville, De’Longhi) amplify craftsmanship narratives and leverage influencer demonstrations. Mass-value players (Hamilton Beach, Black+Decker) differentiate on price-to-feature ratios. Disruptors like SharkNinja sprint on industrial design and viral-ready marketing; its Ninja Luxe Café helped lift 2024 net sales 32%.
Smart-home integration is a shared battleground. Firms with legacy mechanical engineering are accelerating software partnerships to avoid ceding interface control to third-party hubs. Parallel advances in sustainable materials provide new vectors for competitive messaging across the US household coffee machine market.
US Household Coffee Machine Industry Leaders
Keurig Dr Pepper Inc.
Nestlé S.A. (Nespresso USA)
Hamilton Beach Brands Holding Company
De'Longhi Group
Breville Group Limited
- *Disclaimer: Major Players sorted in no particular order

Market Opportunities and Future Outlook
Product and material redesign for sustainability creates a clear whitespace in pods and machines as scrutiny rises around single-use formats and recyclability claims, pushing manufacturers toward compostable, recyclable, or refillable systems and higher recycled content in housings. Keurig has positioned K-Rounds as a plant-based or fully compostable format, aligning product roadmaps to the direction of municipal extended-producer-responsibility initiatives and ESG disclosure risk highlighted by its SEC settlement related to recyclability claims. On the machine side, May 2026 product activity also signals room for circular-material differentiation in mainstream retail assortments, with De'Longhi unveiling Eletta Ultra incorporating components made from up to 70% recycled plastic sourced from the post-consumer WEEE stream.
Connectivity and energy-management features continue to expand from premium tiers into broader portfolios, creating opportunities in app-driven personalization, maintenance alerts, and integration into smart-home routines that raise switching costs once user profiles are stored. Bosch Home Connect-style interfaces show the direction of travel for remote starts, recipes, and service prompts, while espresso innovation cycles are incorporating tighter thermal control and automated workflow assistance. New extraction and efficiency concepts are also entering the conversation, including June 2026 coverage of Axess Industrys Airo Vision+ with bottom-up percolation and an EcoPower concept positioned around reduced energy consumption versus traditional designs; such approaches open room for differentiation in the growing at-home espresso segment without relying solely on aesthetic premiumization.
Recent Industry Developments
- April 2026: Keurig Dr Pepper announced the acquisition of 96.22% of JDE Peet's shares, reshaping its coffee exposure across brands and distribution. The move strengthens scale in coffee systems and broadens strategic optionality across machines and single-serve ecosystems, with implications for licensing, sourcing leverage, and portfolio coordination in North America.
- December 2025: Nespresso opened a New York City flagship boutique format, expanding experiential retail tied to its single-serve ecosystem. The footprint supports higher-touch education and trial for Vertuo and Original lines, reinforcing conversion and retention as competition intensifies in premium pods and espresso-adjacent offerings.
- October 2024: De'Longhi launched a fully automatic coffee machine rollout across more than 1,100 Target stores to deepen mass-market reach for premium at-home espresso. Wider big-box distribution increases consumer access to higher ASP categories and heightens competitive pressure on incumbent brands in semi-automatic and automatic espresso.


Research Methodology Framework and Report Scope
Market Definition and Coverage
For this methodology, the market covers coffee machines bought for household use in the United States, counted in value terms for new units sold through retail and online channels across the year.
Scope exclusions: Refurbished or used units, office or foodservice coffee systems, and standalone coffee grinders are excluded from the market totals.
Segmentation Overview
- By Product Type
- Drip/Filter Coffee Makers
- Single-Serve Pod & Capsule Machines
- Espresso Machines
- Combination Coffee & Espresso Machines
- French Press & Manual Brewers
- Percolators & Moka Pots
- By Technology
- Manual
- Semi-Automatic
- Fully Automatic
- Super-Automatic
- Smart/Connected
- By Capacity – Number of Cups
- 1 Cup
- 2–4 Cups
- 5–10 Cups
- Above 10 Cups
- By Price Range
- Economy (≤ USD 100)
- Mid-Range (USD 101–300)
- Premium (USD 301–700)
- Luxury (≥ USD 701)
- By Material of Housing
- Plastic
- Stainless Steel
- Mixed/Other
- By Distribution Channel
- Supermarkets & Hypermarkets
- Specialty Appliance Retailers
- Department Stores
- Online (E-commerce)
- Brand E-Stores
- Warehouse Clubs
- By Region – United States
- Northeast
- Midwest
- South
- West
Data Sources, Market Sizing, and Validation
Desk Research
Desk work starts by setting the at-home coffee equipment demand context and then translating that into a measurable revenue pool. We referenced public sources such as the US Census Bureau, the Bureau of Economic Analysis, the Bureau of Labor Statistics (CPI inflation), and the US International Trade Commission to understand trade and import direction, which we used to sense-check units, pricing movement, and the broader consumer spending conditions.
To link assumptions to observed market behavior, we layered in manufacturer and retailer disclosures from annual reports, 10-K filings, investor presentations, and earnings call transcripts, then reviewed reputable press and association updates on at-home coffee consumption and appliance retailing in the US. In parallel, we used paid subscriptions that compile company financials, news, and patent activity to confirm product launches, feature changes, and the pace of premiumization across household brewers. These desk sources are not exhaustive, and other public and paid references were also used to collect data, validate assumptions, and clarify open questions.
Primary Interviews and Surveys
Primary interviews and surveys were used to confirm how household coffee machines are defined in practice, and to test assumptions on pricing, feature adoption, and channel mix for the United States. We spoke with a spread of manufacturers, brand managers, distributors, retailers, and repair and service participants, and then cross-checked the views with independent experts who follow US small appliance demand.
Distribution of primary research fieldwork respondents
| Company type | Respondent position |
|---|---|
| Top tier: 35% | CXOs: 15% |
| Mid tier: 44% | Functional/Unit leaders: 33% |
| Smaller Players: 21% | Managers: 52% |
Market-Sizing & Forecasting
Market sizing was built using a mix of top-down and bottom-up logic so the final value stays realistic even when some data points are incomplete. On the top-down side, we reconstructed a coffee machine revenue pool from US small appliance spending and household coffee consumption signals by applying category shares, channel splits, and replacement behavior patterns observed in the country. We then corroborated those totals with selective bottom-up approximations by rolling up a sampled set of supplier and brand revenues and cross-checking them using unit volumes multiplied by a validated average selling price (ASP) range.
The inputs that mattered most in the model included household penetration of single-serve and espresso formats, mix shifts between drip and pod systems, e-commerce share within small appliances, typical promotional intensity during major retail periods, and ASP movement linked to feature upgrades (such as integrated milk systems and smart connectivity). Where company disclosures were incomplete, gaps were handled by using peer benchmarks, trade direction checks, and interview-based retailer feedback, and then rebalancing assumptions so totals remain aligned with the overall demand pool.
For forecasting, we used scenario analysis supported by light time-series smoothing so the projection follows realistic adoption and replacement cycles. Assumptions for future growth were tested with interview feedback on price sensitivity, expected innovation cadence, and how quickly premium formats are substituting basic brewers in US households.
Data Validation & Update Cycle
Before finalizing results, model outputs were compared with independent signals such as appliance spending direction, trade movement cues, and the implied unit demand trend based on replacement cycles. When a metric moved too far from reasonable ranges, we rechecked the underlying driver and then reviewed inputs such as ASP progression, channel shares, or format mix.
A multi-step review is followed internally so calculations, assumptions, and narrative logic stay consistent. The most sensitive assumptions are re-tested through follow-up calls when needed. Reports are refreshed annually, with interim updates triggered by material events such as sharp pricing changes, major shifts in consumer demand, or meaningful channel disruptions. Right before delivery, we do a fresh review pass so clients receive the latest updated view available at that time.
Mordor Intelligence's US Household Coffee Machine Market Sizing Compared With Other Published Estimates
Published market values for US household coffee machines can look far apart because different studies do not always count the same products, channels, or pricing basis. Some estimates are built around shipment value, some around retail value, and some mix household and small commercial use, which makes the final totals hard to compare.
The main gap comes from mixing household-only brewers with office, foodservice, or refurbished equipment, where Mordor Intelligence counts only new, domestic-use coffee machines and keeps the pricing logic tied to observable ASP ranges and format mix shifts. Differences also show up when fixed prices are used across years, when promotions are not reflected, or when the base year is not refreshed after a period of inflation and feature-driven premiumization.
Benchmark comparison
| Source | Market Size | Gaps in Research Methodology |
|---|---|---|
| Mordor Intelligence | USD 3.47 B (2026) | |
| Trade Journal A | USD 7.55 B (2023) | Uses a broader coffee machines definition that can include non-household applications and adjacent equipment, and the value basis is closer to a wider market roll-up than household-only new-unit sales. |
| Regional Consultancy B | USD 4.92 B (2024) | Often blends household and non-household demand in one US total and may apply a straight-line growth curve with limited adjustment for promo-driven ASP swings and format mix changes. |
The table indicates that most of the spread is explained by scope and by how pricing and channel mix are treated, rather than by demand growth alone. When household-only inclusions are applied, and ASP and mix are updated using visible market signals, the market size becomes easier to trace back to repeatable steps and sensible checks.


Key Questions Answered in the Report
What is the current value of the US household coffee machine market?
The market is valued at USD 3.47 billion in 2026 and is forecast to reach USD 4.7 billion by 2031 at a 6.30% CAGR.
Which coffee machine type holds the largest share in the United States?
Single-serve pod and capsule machines lead, capturing 54.10% of 2025 revenue.
Why are smart coffee machines growing rapidly?
Smart brewers integrate with home-assistant platforms, enable remote control, and provide usage analytics, driving a 9.35% CAGR in the connected segment.
How significant is environmental regulation on single-serve pods?
Increased regulatory scrutiny, as evidenced by Keurig's SEC settlement, is projected to reduce the forecasted CAGR, prompting manufacturers to shift focus toward plant-based or recyclable alternatives.
Which distribution channel is expanding the fastest?
Online retail is advancing at a 11.98% CAGR as shoppers favor broad selection, reviews, and direct-to-door convenience.
Who are the leading companies in the US household coffee machine market?
Keurig Dr Pepper and Nestlé’s Nespresso together control about 46% value share, followed by Hamilton Beach, De’Longhi, Breville, and emergent challenger SharkNinja.
Page last updated on:


 Your data is secure and never sold or shared.


