
Market Overview
| Study Period | 2020 - 2031 |
|---|---|
| Forecast Data Period | 2026 - 2031 |
| Base Year Market Size (2025) | USD 69.22 Billion |
| Market Size (2026) | USD 72.05 Billion |
| Market Size (2031) | USD 88.03 Billion |
| Growth Rate (2026 - 2031) | 4.09 % |
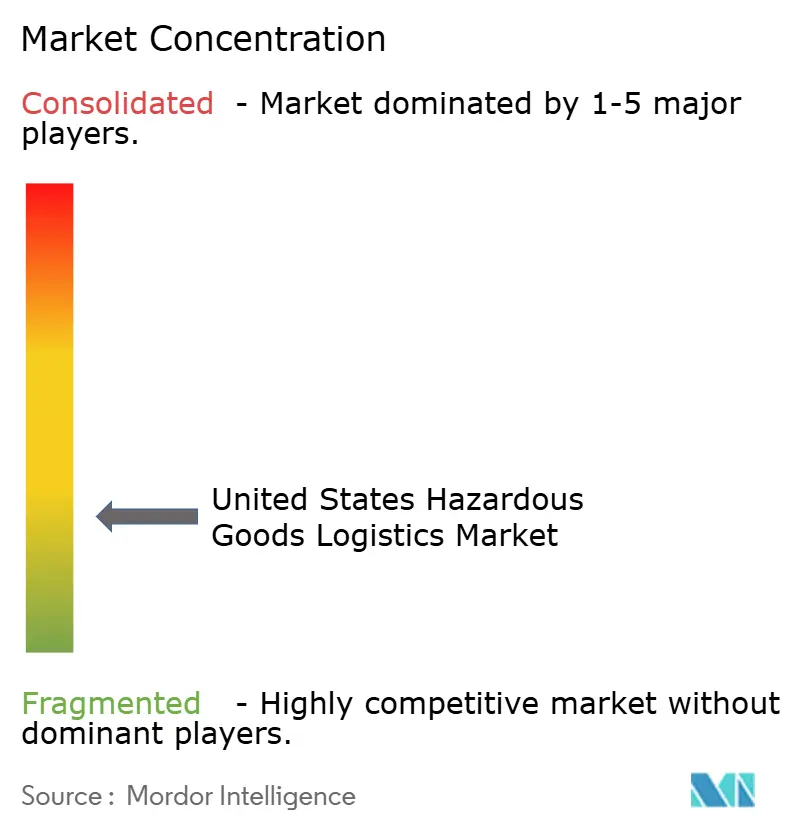
| Market Concentration | Low |
Major Players *Disclaimer: Major Players sorted in no particular order Image © Mordor Intelligence. Reuse requires attribution under CC BY 4.0. | |
United States Hazardous Goods Logistics Market Analysis by Mordor Intelligence
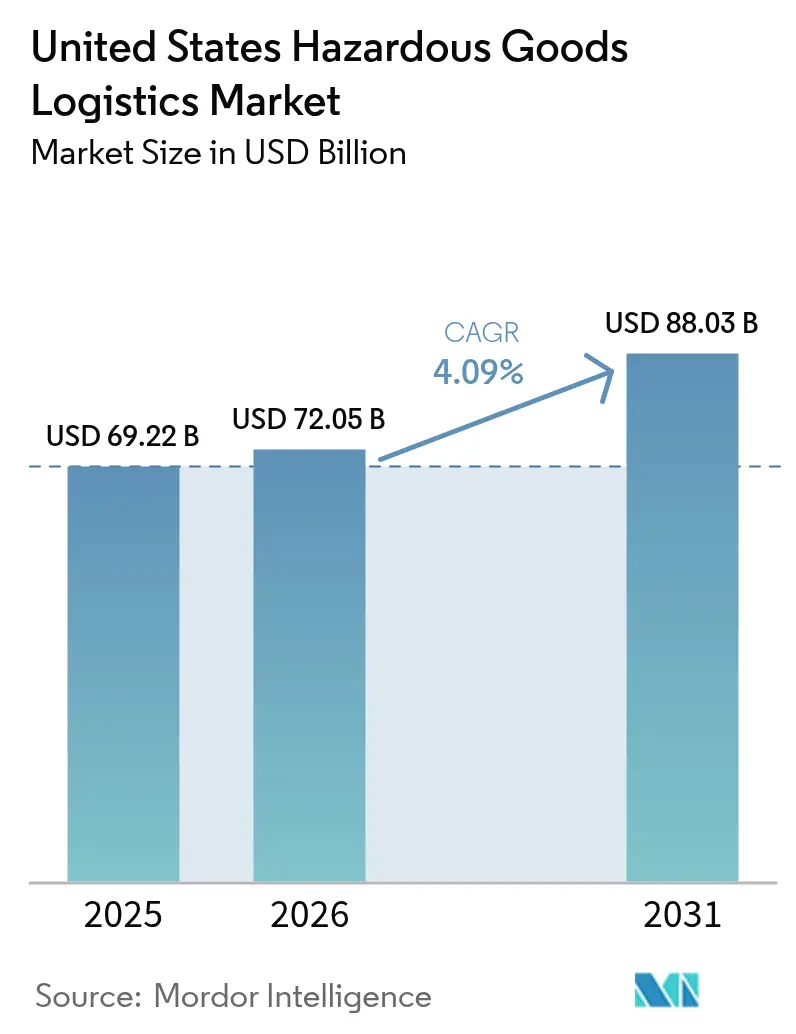
The United States Hazardous Goods Logistics Market size was valued at USD 69.22 billion in 2025 and estimated to grow from USD 72.05 billion in 2026 to reach USD 88.03 billion by 2031, at a CAGR of 4.09% during the forecast period (2026-2031).
The steady trajectory reflects tightening OSHA and PHMSA oversight, increased petrochemical production, and a shift toward technology-enabled supply chains. Transportation maintains dominant value because most hazmat moves remain over-the-road or by rail, yet growth is spreading to value-added services such as real-time monitoring and compliance documentation. LNG export build-outs and hydrogen corridors are multiplying long-haul opportunities, while e-commerce volumes of ORM-D goods bring hazmat handling requirements into parcel networks. Investments in IoT sensor platforms and blockchain documentation are migrating from pilot programs to standard operating practice as shippers demand visibility and evidence of compliance. Digitization therefore evolves from optional feature to basic qualification for bids in the United States hazardous goods logistics market.
Key Report Takeaways
- By function, transportation commanded 77.10% of United States hazardous goods logistics market share in 2025; value-added services is forecast to post the fastest 3.72% CAGR through 2031.
- By destination, domestic flows held 87.60% share of the United States hazardous goods logistics market size in 2025, while international shipments expand at a 4.28% CAGR to 2031.
- By end-use industry, chemicals & petrochemicals accounted for 34.60% share of the United States hazardous goods logistics market size in 2025; healthcare & pharmaceuticals advances at a 4.86% CAGR through 2031.
- By region, the South led with 30.70% of United States hazardous goods logistics market share in 2025; the West accelerates at 4.08% CAGR through 2031.
Note: Market size and forecast figures in this report are generated using Mordor Intelligence’s proprietary estimation framework, updated with the latest available data and insights as of 2026.
United States Hazardous Goods Logistics Market Trends and Insights
Drivers Impact Analysis*
| Driver | % Impact on CAGR Forecast | Geographic Relevance | Impact Timeline |
|---|---|---|---|
| Robust domestic petrochemical output growth | 1.2% | South, Midwest | Long term (≥ 4 years) |
| Rise in e-commerce shipment of ORM-D & consumer hazmat | 0.8% | Global, with concentration in West and Northeast | Medium term (2-4 years) |
| Expansion of LNG & hydrogen fuel supply chains | 0.9% | South, West | Long term (≥ 4 years) |
| Lithium-ion battery UN 3480/3481 volumes soaring | 0.7% | Global | Short term (≤ 2 years) |
| Tightening OSHA/PHMSA compliance enforcement | 0.4% | Global | Short term (≤ 2 years) |
| DoD modernization driving explosive class shipments | 0.3% | South, West | Medium term (2-4 years) |
| Source: Mordor Intelligence | |||
Robust Domestic Petrochemical Output Growth
Gulf Coast ethane crackers and propane dehydrogenation units continue to expand, securing low-cost feedstock that feeds new tank truck, rail, and pipeline demand. Terminal capacity projects around Houston and Louisiana reduce transfer bottlenecks yet require specialized equipment and driver endorsements. Strong regional production draws incremental railcars certified to DOT-117 standards, reinforcing long-haul demand between coastal refineries and inland chemical hubs. Hiring pressures persist because hazmat-endorsed drivers command wage premiums that smaller fleets cannot match. The pull from petrochemical shippers therefore anchors long-term volume in the United States hazardous goods logistics market[1].
Rise in E-commerce Shipment of ORM-D and Consumer Hazmat
Direct-to-consumer channels now move aerosols, household cleaners, and battery-powered devices once relegated to B2B lanes. Parcel integrators retrofit sorting centers with fire-suppression upgrades and implement carrier training that meets PHMSA’s 49 CFR Part 173 packaging rules. Lithium battery volumes intensify complexity because UN 3480 and UN 3481 shipments need dangerous-goods declarations, yet customer expectations remain next-day delivery. Logistics providers embedding hazmat modules within warehouse management systems gain share as omnichannel retailers outsource compliance tasks. The shift enlarges last-mile density, adding incremental stops but raising revenue per shipment across the United States hazardous goods logistics market[2].
Expansion of LNG and Hydrogen Fuel Supply Chains
New liquefaction trains on the Gulf Coast and Pacific Northwest spur cryogenic tank truck procurement and vessel retrofits. Hydrogen projects, financed through federal clean-energy credits, demand tube-trailers rated for 10,000 psi plus personnel trained in high-purity protocols. The Port of Oakland’s USD 50 million terminal upgrade demonstrates public-sector commitment to alternative fuel trade lanes. Equipment costs and engineering compliance elevate barriers to entry, rewarding carriers with scale and capital access. Over the horizon, domestic hydrogen offtake contracts are expected to create continuous backhauls that improve network utilization across the United States hazardous goods logistics market.
Lithium-ion Battery UN 3480/3481 Volumes Soaring
Consumer electronics, medical devices, and electric power tools drive surging battery shipments under IATA DGR Section II revisions. Recent PHMSA advisories on damaged or defective lithium batteries require route-specific risk assessments and thermal-shield packaging. Carriers install real-time temperature and g-force sensors that trigger exception reports before cells reach runaway thresholds, reducing claim severity and insurance premiums. Specialized facilities for segregation and fire-rating are springing up near West Coast import ports, facilitating trans-load into domestic networks. These investments align with the broader digitization wave reshaping the United States hazardous goods logistics market.
Restraints Impact Analysis*
| Restraint | % Impact on CAGR Forecast | Geographic Relevance | Impact Timeline |
|---|---|---|---|
| Driver and equipment shortages | -1.1% | Global, acute in Midwest and South | Short term (≤ 2 years) |
| Escalating hazmat insurance premiums | -0.6% | Global | Medium term (2-4 years) |
| Limited public-sector bulk rail capacity | -0.4% | Midwest, Northeast | Long term (≥ 4 years) |
| Community opposition to hazmat corridors | -0.3% | West, Northeast | Medium term (2-4 years) |
| Source: Mordor Intelligence | |||
Driver and Equipment Shortages
Hazmat-certified CDL drivers remain scarce as retirements outpace training-school throughput. The DOT-117 tank-car manufacturing backlog extends beyond two years, curbing bulk chemical rail growth. Fleets bid up wages and offer sign-on bonuses, yet pass-through to shippers raises landed cost, dampening volume. Shortages hit rural lanes hardest, forcing petrochemical shippers to reposition assets, which inflates deadhead miles in the United States hazardous goods logistics market.
Escalating Hazmat Insurance Premiums
Large-loss incidents and higher civil liability ceilings push insurance underwriters to hike hazmat premiums by double-digit percentages. Smaller operators exit long-haul sectors when umbrella coverage exceeds operating margin. Carriers seek differentiated pricing by installing telematics, lane-specific risk scoring, and automated emergency-response alerting. Premium burdens accelerate consolidation as well-capitalized firms absorb market share across the United States hazardous goods logistics market[3].
*Our forecasts treat driver/restraint impacts as directional, not additive. The impact forecasts reflect baseline growth, mix effects, and variable interactions.
Segment Analysis
By Function: Transportation Remains Core While Services Scale Up
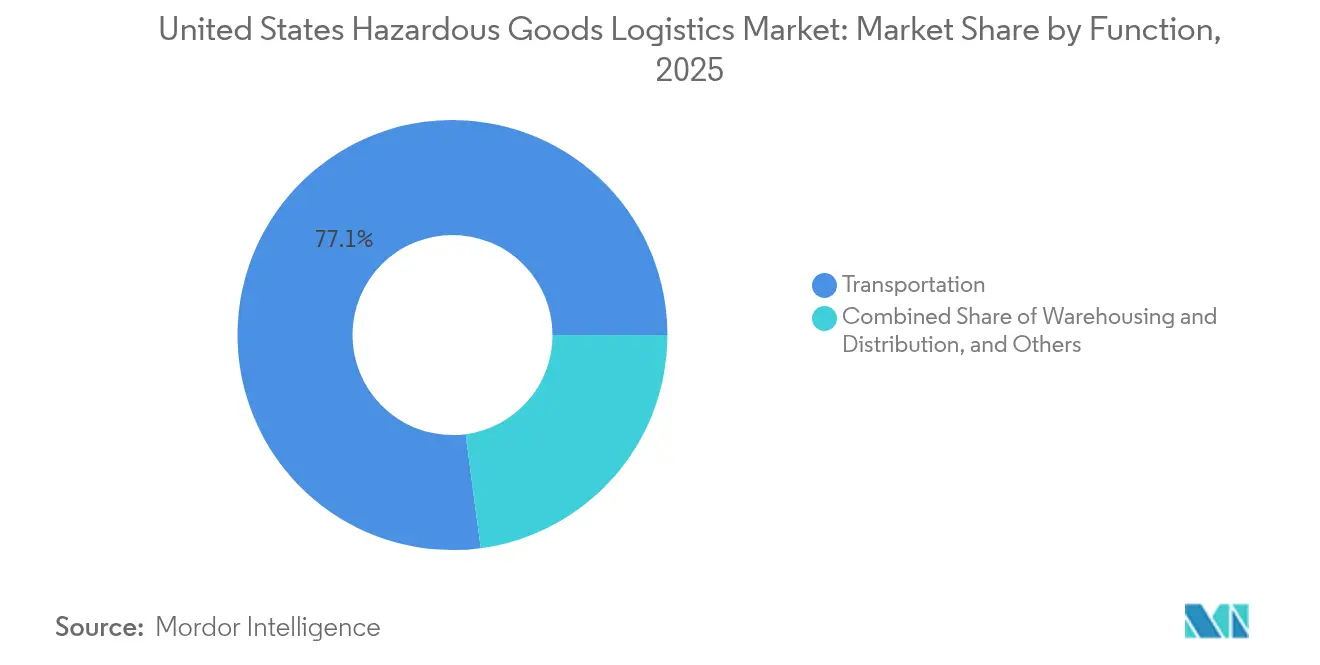
Transportation retained 77.10% United States hazardous goods logistics market share in 2025 as shippers relied on multi-modal road and rail assets to connect refineries, chemical plants, and distribution centers. Road fleets deliver flexibility for last-mile moves, whereas rail unit trains equipped with DOT-117 cars capture bulk lanes that demand lower per-ton cost and improved safety. Marine operators invest in pressurized barges for LNG and chemical exports, while air cargo remains a niche for medical isotopes and emergency supplies.
Value-added services register a 3.72% CAGR, the fastest among functions, as shippers outsource SDS authoring, labeling, and real-time cargo telemetry. Warehousing follows with steady growth because strategically located hazmat facilities shorten haul lengths and mitigate driver-hour constraints. IoT integrations such as vibration and temperature sensors lower insurance deductibles, propelling incremental revenue. These developments indicate the United States hazardous goods logistics market is maturing from pure transport toward integrated service offerings that monetize compliance expertise.

By Destination: Domestic Dominance with International Momentum
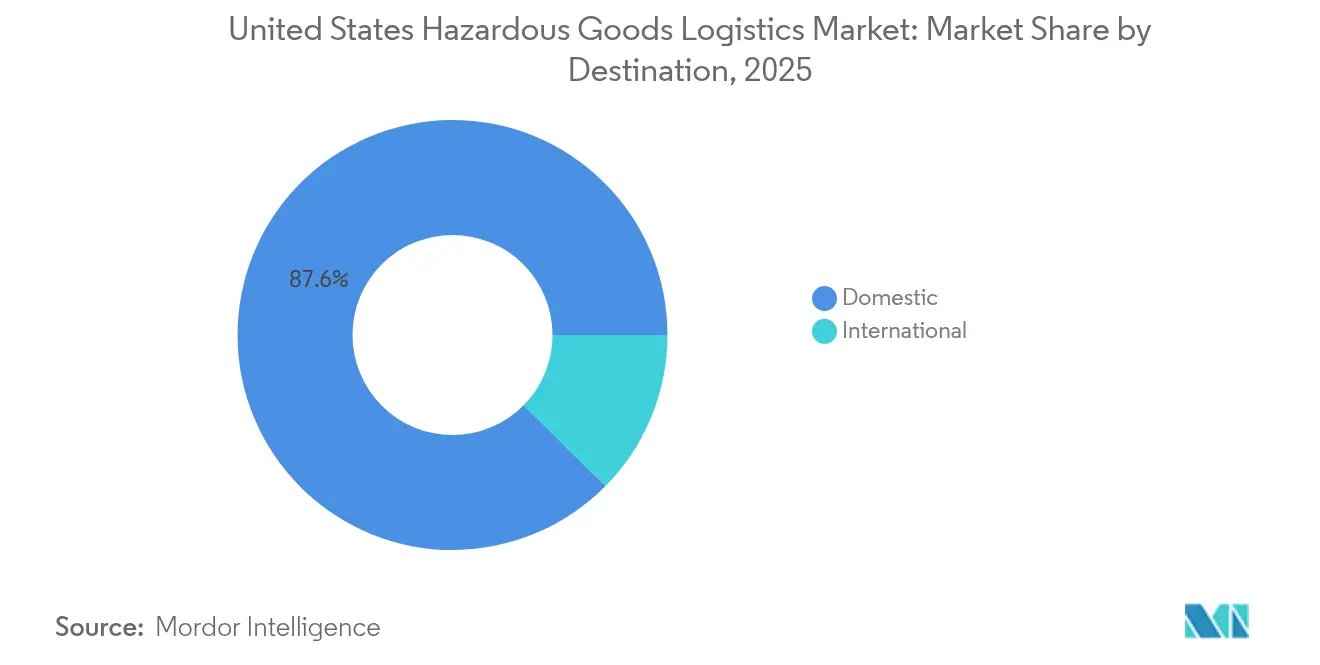
Domestic shipments delivered 87.60% of United States hazardous goods logistics market size in 2025, reflecting the breadth of inland production and consumption. Petrochemicals from the Gulf Coast move to Midwest plastics converters, fertilizers flow from central plants to Corn Belt farms, and ORM-D parcels reach households nationwide. Standardized regulatory frameworks reduce documentation friction, maintaining cost efficiency.
International volumes, holding 12.40% share, accelerate at 4.28% CAGR as LNG and hydrogen offtake contracts expand export lanes and cross-border e-commerce stimulates small-parcel hazmat demand. Carriers integrate multilingual documentation modules and partner with foreign forwarders versed in IMDG and ADR standards. The blend of domestic scale and global expansion diversifies revenue streams across the United States hazardous goods logistics market.
By End-Use Industry: Chemicals Lead, Healthcare Surges
Chemicals & petrochemicals accounted for 34.60% of United States hazardous goods logistics market size in 2025, supported by low-cost natural gas feedstocks and robust domestic plastics demand. Bulk tank-truck and rail tanker utilization remains high, and new terminal capacity absorbs incremental output.
Healthcare & pharmaceuticals records the quickest 4.86% CAGR through 2031 as lithium-ion batteries power medical devices, and biologics require temperature-controlled hazmat packaging. Waste management grows due to circular-economy rules that mandate closed-loop handling for solvent and pesticide residues. The diversification underscores how end-use shifts distribute growth vectors across the United States hazardous goods logistics market.
Geography Analysis
The South’s 30.70% share rests on integrated refinery-petrochemical clusters, multi-commodity pipelines, and LNG export piers that funnel large cargo volumes into specialized tanker networks. Ongoing investments in dock capacity, hurricane-resilient storage, and automated valve systems safeguard throughput even amid extreme weather. Federal infrastructure grants channel funds to dredging and levee upgrades, cementing regional dominance in the United States hazardous goods logistics market.
The West grows fastest at 4.08% CAGR as hydrogen fueling corridors and renewable-diesel projects converge with technology-sector demand for high-spec lithium batteries. Pacific ports pilot electronic hazmat pre-notification systems that accelerate Customs clearance and reduce yard dwell. However, zoning disputes over fuel terminals and pipeline extensions underscore the need for community outreach programs to safeguard project timelines. State incentives for zero-emission drayage fleets compound asset turnover, steering equipment investment toward alternative fuel compatibility.
The Northeast and Midwest log steady growth tied to pharmaceutical clusters, specialty chemical mixers, and agricultural input suppliers. Rail bridge upgrades near Chicago and New York unlock limited additional hazmat capacity, but yard congestion remains a constraint. Shippers therefore adopt modal splits that favor short-haul trucks feeding intermodal ramps, balancing cost with compliance. Network reliability improvements support export ambitions for niche chemicals, reinforcing the national footprint of the United States hazardous goods logistics market.
Regulatory Landscape
Hazardous materials transportation in the United States is governed primarily by PHMSA under the Hazardous Materials Regulations in 49 CFR Parts 171-180, with carrier operations also shaped by FMCSA requirements for hazmat motor carriers. Enforcement continues to focus on compliance documentation, packaging, segregation, and training under the HMR framework, which increases the value of demonstrable readiness.
In 2026, PHMSA advanced burden-reduction and digitization oriented rulemaking. The HM-265 final rule became effective in February 2026, targeting unnecessary regulatory burdens for fuel transportation and citing substantial annualized cost savings for the sector. In June 2026, PHMSA finalized changes that streamline approvals for energetic materials by designating the PHMSA portal as the sole submission method, with an effective date in July 2026 and a delayed compliance date later in 2026. The updates reinforce the shift toward centralized electronic workflows for regulated submissions.
Value Chain Analysis
The hazardous goods logistics value chain spans regulated shippers (chemicals and petrochemicals, healthcare and pharmaceuticals, energy, agriculture inputs, and waste handlers), specialized packaging and labeling providers, and compliance services (SDS, classification, declarations) that sit upstream of transportation execution. Core execution flows move through multimodal carriers, including road tank and dry van with hazmat endorsements, rail tank cars for bulk, marine for export/import, and air for niche time-critical pharma, plus hazmat-certified warehousing, transload and intermodal ramps, and port drayage nodes near major gateways. Visibility layers, including telematics, sensor platforms (temperature, vibration, door status), and documentation systems, increasingly function as qualification requirements for bids as shippers seek audit-ready proof of compliance.
Bottlenecks and value capture concentrate around constrained hazmat labor and specialized assets, alongside the cost of risk transfer through insurance. This supports vertical integration and capability acquisition across the chain, such as Rinchem announcing a business combination with Dupre Logistics in January 2026 to link specialty chemical warehousing with regional chemical transportation. On the service-provider side, higher-security and sensitive-cargo capabilities are being added through M&A, including C.H. Robinson's acquisition of DeSpir Logistics in June 2026. Dedicated Class 9 network products such as Maersk's North American lithium-ion battery ground service (launched in July 2026) also show how integrators are productizing compliant handling across distributed station and hub footprints.
Competitive Landscape
Competition is moderately fragmented leaving significant share for regional specialists. Global integrators such as Kuehne + Nagel and DSV deploy multimodal platforms that blend brokerage, contract logistics, and digital visibility. XPO Logistics extended last-mile capability via its USD 87 million NLM purchase, targeting consumer hazmat segments that value same-day delivery. Kenan Advantage Group continues bolt-on acquisitions that add ISO tank depots and specialty trailers, boosting density in chemical corridors.
Technology deployment sets winners apart. Leading fleets install sensor suites that transmit temperature, pressure, and door status in real time, feeding machine-learning engines that flag anomaly patterns. Shippers use dashboards to audit compliance, granting premium revenue to carriers demonstrating zero-incident records. Corporate ESG mandates also favor providers investing in low-emission powertrains; early adopters of hydrogen or battery-electric tractors gain competitive differentiation within the United States hazardous goods logistics market.
Scale additionally aids insurance negotiation. Large carriers spread risk over bigger fleets and routes, securing lower deductibles and enabling rate advantages over smaller rivals squeezed by premium inflation. Consolidation momentum should persist because private equity funds seek platform plays that can be scaled through tuck-ins across regional lanes. The result is a gradually tightening concentration ratio, yet niche carriers remain viable by specializing in high-hazard classes or geographic verticals underserved by larger networks.
United States Hazardous Goods Logistics Industry Leaders
-
Deutsche Post DHL Group
-
Kuehne + Nagel
-
DSV
-
XPO Logistics
-
Landstar System Inc.
- *Disclaimer: Major Players sorted in no particular order
Market Opportunities and Future Outlook
A near-term whitespace opportunity is adding compliant hazmat distribution capacity in non-traditional fulfillment corridors serving e-commerce and regulated industrial users, where shippers outsource documentation, labeling, and exception management alongside storage and transport. Facility activity in 2026 points to this build-out: ID Logistics signed a lease in May 2026 for a hazardous materials distribution facility in Henrico, Virginia (its first operation in the state and third HazMat-focused US facility), expanding optionality for East Coast and Mid-Atlantic hazmat flows that need dedicated processes and trained labor.
Another opportunity cluster is end-to-end handling for higher-scrutiny categories such as chemical logistics on the Gulf Coast, lithium-ion batteries (Class 9), and regulated waste streams, where compliance and risk-management capabilities influence carrier selection and insurance outcomes. H.Essers entry into the US market via its acquisition of Palmer Logistics, announced in 2026, adds scale in Gulf Coast chemical warehousing. Maersk's dedicated North American lithium-ion battery ground service (July 2026) also highlights demand for standardized, networked solutions for battery compliance and incident prevention. In environmental services, Triumvirate Environmental expanding its Casa Grande, Arizona site in 2026 to include a new RCRA Part B hazardous waste TSDF points to continued investment in regulated downstream infrastructure that can shorten disposal lead times and support closed-loop programs for generators.
Recent Industry Developments
- July 2026: Maersk launched a dedicated North American lithium-ion battery (Class 9) ground freight service built around a multi-station network with regional hubs. The service formalized battery-specific handling and documentation into a repeatable product, helping shippers standardize compliance and reduce handoff risk across domestic moves.
- April 2025: Kenan Advantage Group completed the acquisition of MC Tank Transport, adding 8 terminals, 3 ISO depots, and 175 hazmat-qualified drivers to expand chemical transportation coverage across the Southeast and Midwest. The acquisition strengthened terminal density and specialized asset access in core chemical corridors, supporting faster dispatch and improved utilization for bulk hazmat moves.
- June 2024: PHMSA finalized the Real-Time Train Consist Rule requiring electronic hazmat train consist information to be accessible to emergency responders within minutes. The rule increased transparency and accelerated incident response coordination, pushing rail stakeholders and their logistics partners toward more robust digital data-sharing workflows.
Research Methodology Framework and Report Scope
Market Definition and Coverage
This market covers the value of logistics services used to move, store, and handle hazardous materials within the United States, where shipment execution must follow hazmat safety, labeling, and documentation rules across transport and storage steps.
Scope exclusions: It excludes the value of the hazardous goods themselves, in-house shipper operations that are not paid logistics services, and any hazmat packaging manufacturing that is sold as a standalone product.
Segmentation Overview
- By Function
- Transportation
- Road
- Rail
- Sea
- Air
- Warehousing and Distribution
- Value-added Services
- Transportation
- By Destination
- Domestic
- International
- By End-Use Industry
- Chemicals and Petrochemicals
- Oil and Gas
- Healthcare and Pharmaceuticals
- Agriculture and Fertilizers
- Manufacturing and Industrial
- Waste Management and Recycling
- Mining
- Others
- By US Region
- Northeast
- Midwest
- South
- West
Data Sources, Market Sizing, and Validation
Desk Research
Desk research is used to define what counts as paid hazardous goods logistics in the United States and to anchor the model to observable freight activity. We referenced public and official sources such as US DOT and PHMSA hazmat rules and incident statistics, Bureau of Transportation Statistics freight measures, US Census Bureau economic data, Energy Information Administration indicators tied to fuels and refined products, and EPA releases that signal compliance intensity in key industries.
In parallel, we reviewed logistics and shipper disclosures such as annual reports, investor presentations, and safety or sustainability updates, since these often describe service mix and pricing pressure. Where needed, paid subscriptions for company financials and intelligence, and an import and export shipment-level database, were used to sanity-check trade-linked hazardous flows and confirm realistic revenue pools by mode and destination. The sources listed here are not exhaustive, and many other public references were also consulted for data collection, validation, and clarification during the research.
Primary Interviews and Surveys
Primary work focused on testing real-world pricing and operating assumptions with carriers, 3PL teams, warehouse operators, and shipper-side hazmat managers, and then we asked follow-up questions when the desk signals did not match expectations. Since this is a US market, we covered major demand corridors and port-linked flows, and we also confirmed where domestic versus international handling and storage requirements lead to different process steps.
Distribution of primary research fieldwork respondents
| Company type | Respondent position |
|---|---|
| Top tier: 32% | CXOs: 16% |
| Mid tier: 50% | Functional/Unit leaders: 29% |
| Smaller Players: 18% | Managers: 55% |
Market-Sizing & Forecasting
For sizing, we apply a top-down approach once the addressable US hazmat logistics spend is reconstructed from freight activity and service coverage, and then we confirm it through selective bottom-up approximations so the totals remain realistic. The cross-checks typically use sampled price per shipment or per-mile assumptions by mode, warehouse throughput assumptions for hazmat-capable facilities, and channel checks on value-added service attach rates.
Key model inputs include hazmat shipment intensity by end-use industry, modal mix shifts (road versus rail versus air and water), the share of domestic versus international movements, compliance-driven handling steps that add cost, and service price movement tied to fuel and labor. Because hazmat pricing can move unevenly across modes, we forecast using scenario analysis with a light multivariate regression overlay, where variables like freight demand direction, energy and chemical activity signals, and cost indices are used to keep price and volume paths consistent. When bottom-up inputs are missing for smaller niches, gaps are handled by using conservative attach rates and applying them only to demand pools that meet clear hazmat handling requirements, and then the assumptions are rechecked with interviews.
Data Validation & Update Cycle
Validation is done through multiple checks, starting with matching the model against independent signals such as overall US logistics activity, hazmat incident and compliance patterns, and implied revenue per shipment outcomes by mode. If a number looks out of range, we reopen the drivers, which usually means rechecking the volume proxy, the service boundary, and the applied pricing ladder before the final sign-off.
We refresh the report annually, and interim updates are done when major regulatory, trade, or cost events can change hazardous handling intensity or pricing direction. Before delivery, the latest public data is reviewed again and the primary notes are revisited so the final outputs reflect the most current view available at that time.
Mordor Intelligence's US Hazardous Goods Logistics Market Estimate Compared With Other Published Estimates
Published market sizes for US hazardous goods logistics can vary widely, even when they appear to describe the same scope, because each study draws its line around what services count and how prices are timed. Differences also show up when the base year is not aligned, when currency and inflation handling is not stated clearly, or when freight volume proxies are taken from different data series.
In our work, refresh timing and the way average price per shipment is updated by mode are major drivers of the final value, particularly in years where fuel and labor costs move quickly, which can shift hazmat surcharges and specialized handling fees. When these updates are locked to a specific cut-off and then tested against independent signals like freight activity and compliance intensity, the outcome is steadier and easier to reconcile, a step built into Mordor Intelligence.
Benchmark comparison
| Source | Market Size | Gaps in Research Methodology |
|---|---|---|
| Mordor Intelligence | USD 69.22 B (2025) | |
| Industry Publisher A | USD 54.27 B (2024) | Uses a different base year and a longer forecast window, and it appears to place more weight on packaging and regulatory compliance segmentation, which can shift what is counted as logistics revenue versus adjacent services. |
| Industry Publisher A | USD 57.77 B (2025) | Applies the same broader segment lens and may use different price progression assumptions across modes, which can pull the 2025 value down if hazmat surcharge escalation is smoothed or not tied to mode-specific cost movement. |
The spread in the table mainly comes from base-year alignment and how service boundaries are set around logistics versus adjacent compliance and packaging activities. By keeping the size tied to observable US freight signals, mode-level pricing steps, and repeatable validation checks, we end up with a market value that can be traced back to clear drivers and adjusted when new data changes those drivers.
Key Questions Answered in the Report
What is the projected value of the United States hazardous goods logistics market in 2031?
The market is expected to reach USD 88.03 billion by 2031.
Which region currently leads U.S. hazmat logistics by value?
The South region leads with 30.70% share because of its energy and petrochemical clusters.
Which functional segment shows the fastest growth?
Value-added services, expanding at a 3.72% CAGR through 2031 by integrating compliance and monitoring solutions.
How fast are international hazmat shipments growing?
International lanes are forecast to rise at a 4.28% CAGR as LNG exports and cross-border e-commerce accelerate.
What driver most boosts long-term growth?
Robust domestic petrochemical capacity expansion adds an estimated +1.2% to overall market CAGR.
Why are insurance costs rising for hazmat carriers?
Higher claim severity and stricter OSHA and PHMSA penalties push underwriters to lift premiums by double digits.