
Market Overview
| Study Period | 2020 - 2031 |
|---|---|
| Forecast Data Period | 2026 - 2031 |
| Base Year Market Size (2025) | USD 207.09 Billion |
| Market Size (2026) | USD 220.38 Billion |
| Market Size (2031) | USD 300.73 Billion |
| Growth Rate (2026 - 2031) | 6.42 % |
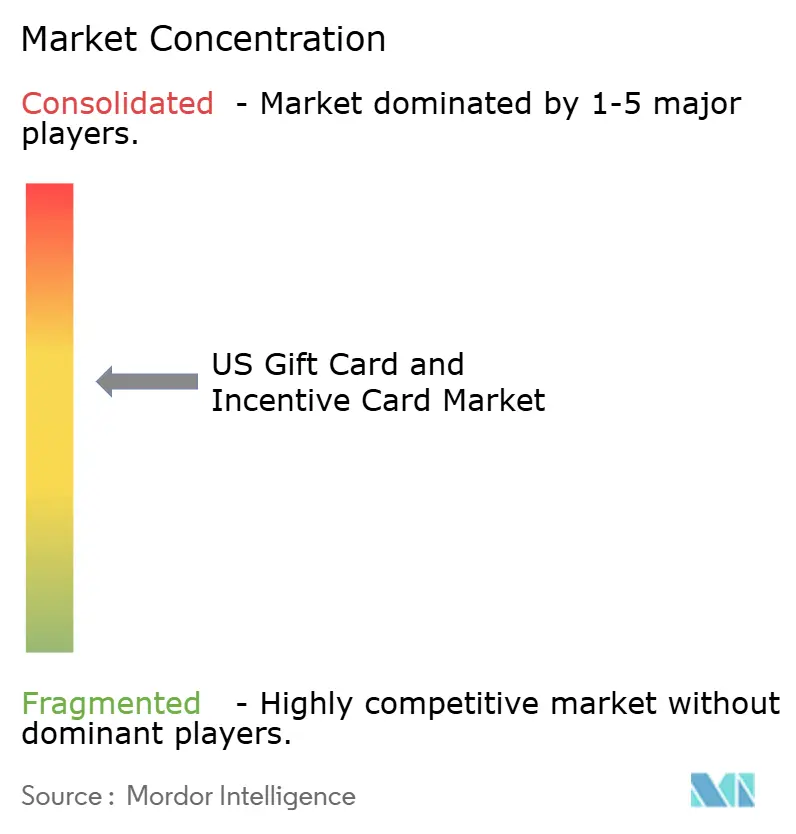
| Market Concentration | Medium |
Major Players *Disclaimer: Major Players sorted in no particular order Image © Mordor Intelligence. Reuse requires attribution under CC BY 4.0. | |
US Gift Card And Incentive Card Market Analysis by Mordor Intelligence
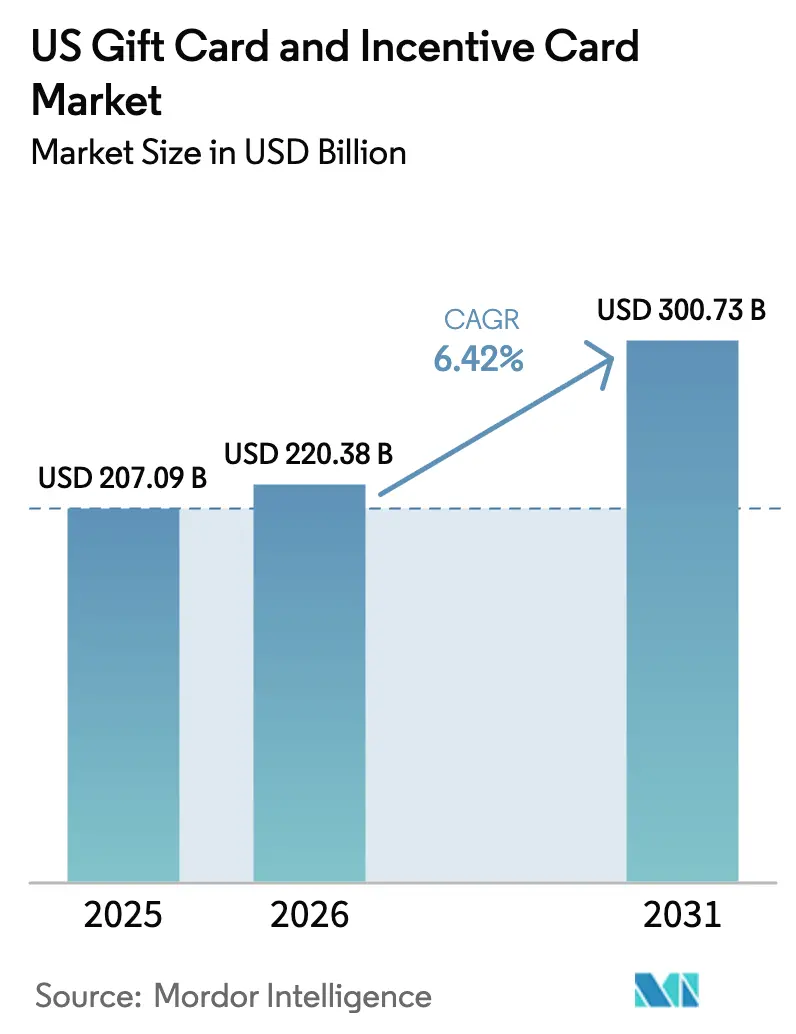
The US gift card and incentive card market size was valued at USD 207.09 billion in 2025 and estimated to grow from USD 220.38 billion in 2026 to reach USD 300.73 billion by 2031, at a CAGR of 6.42% during the forecast period (2026-2031). Corporate bulk purchasing, digital wallet integration, and omnichannel retail adoption collectively push card load volumes higher as enterprises embed cards into loyalty, payroll, and HR recognition workflows. Digital formats progress at double-digit speeds, while state-level fraud prevention laws raise compliance costs that favor larger, technology-focused issuers. Platform consolidation accelerates because scale lowers per-card fraud losses and simplifies multi-state regulatory reporting. Continued economic resilience, strong consumer demand for experiential spending, and the proliferation of white-label SaaS solutions sustain broad participation across brands and industry verticals.
Key Report Takeaways
- By card type, closed-loop cards held 61.75% of the US gift card and incentive card market share in 2025, whereas open-loop cards are projected to grow at 8.62% CAGR through 2031.
- By format, digital cards captured 58.35% of the US gift card and incentive card market revenue share in 2025; the segment is expected to post a 11.86% CAGR to 2031.
- By consumer type, corporate B2B purchases accounted for 64.85% of the US gift card and incentive card market size in 2025 and are forecasted to expand at 8.74% CAGR through 2031.
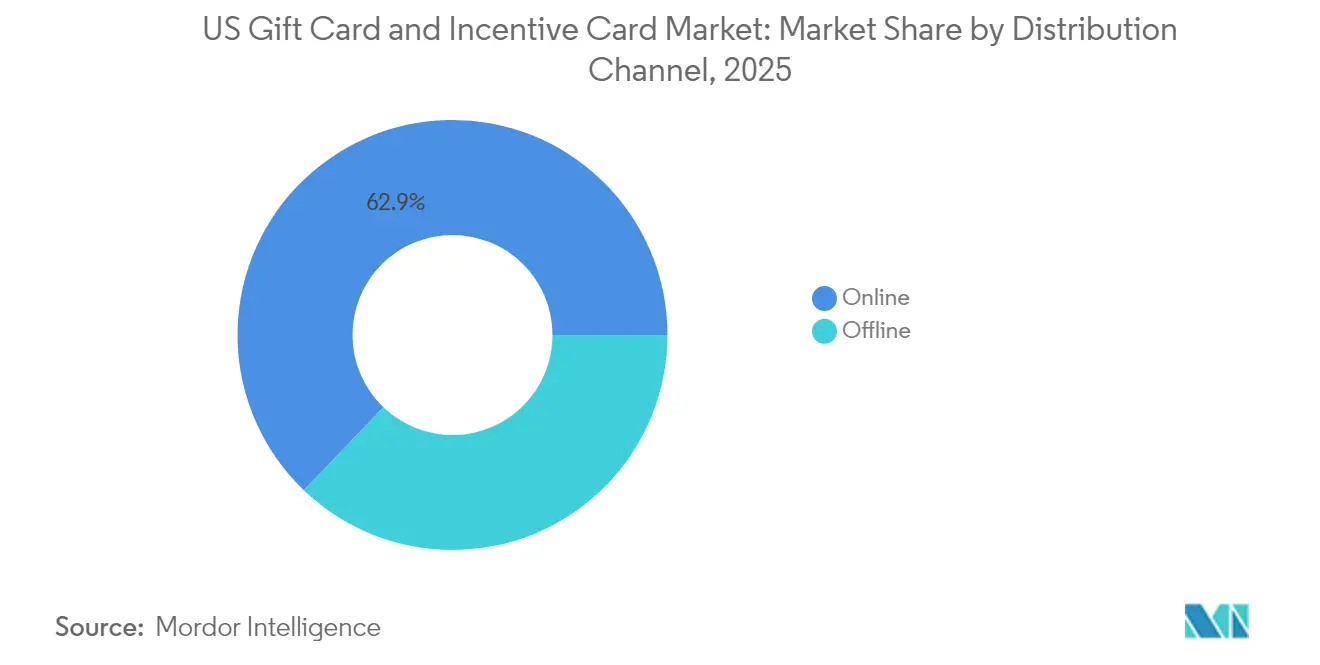
- By distribution channel, online platforms led with 62.85% share of the US gift card and incentive card market size in 2025, while the same channel is expected to advance at 10.78% CAGR to 2031.
- By industry of application, food and beverage dominated with 26.15% share of the US gift card and incentive card market size in 2025; health, wellness, and beauty is the fastest-growing vertical at 9.32% CAGR through 2031.
Note: Market size and forecast figures in this report are generated using Mordor Intelligence’s proprietary estimation framework, updated with the latest available data and insights as of 2026.
US Gift Card And Incentive Card Market Trends and Insights
Drivers Impact Analysis*
| Driver | (~) % Impact on CAGR Forecast | Geographic Relevance | Impact Timeline |
|---|---|---|---|
| Rapid shift to digital & mobile-wallet gift cards | +1.8% | National, urban concentration | Medium term (2-4 years) |
| Corporate demand for incentive cards in HR & loyalty programs | +2.1% | National, corporate hubs | Long term (≥ 4 years) |
| Omni-channel retail expansion boosts card load volumes | +1.2% | National, retail-dense areas | Short term (≤ 2 years) |
| Gen-Z “self-use” gift-card budgeting trend | +0.9% | National, youth-dense markets | Medium term (2-4 years) |
| State escheatment-law changes spurring bulk B2B issuance | +0.7% | State-specific, national spillover | Long term (≥ 4 years) |
| Rise of white-label SaaS platforms for mid-market brands | +0.6% | National, tech-enabled markets | Medium term (2-4 years) |
| Source: Mordor Intelligence | |||
Rapid shift to digital & mobile-wallet gift cards
Mobile wallets have become the default redemption method as Apple Pay and Google Pay acceptance removes the friction of plastic cards at checkout. The Consumer Financial Protection Bureau’s 2024 large-participant rule formalized oversight of payment apps that process at least 50 million transactions, underscoring the systemic role of digital gift cards[1]. Retailers gain higher engagement by embedding brand-specific cards in their own apps, while corporate buyers appreciate the instant fulfillment and audit trails that digital delivery provides. This interplay drives a 12.34% CAGR for digital formats and encourages issuers to prioritize real-time balance updates, partial redemption tools, and loyalty integration features.
Corporate demand for incentive cards in HR & loyalty programs
Enterprises treat cards as flexible, tax-efficient benefits that avoid payroll complexities. Spot bonuses and milestone rewards grow in relevance for remote staff, and loyalty managers increasingly swap physical merchandise for digital gift card redemption. Target’s loyalty revamp, which quadrupled membership and delivered 350 million incremental guest trips compared with 2019, illustrates how card integration lifts visit frequency. High-volume corporate contracts provide forecastable revenue and dampen seasonality for issuers.
Gen-Z “self-use” gift-card budgeting trend
Younger consumers allocate digital cards as category-specific spending envelopes for dining, entertainment, and wellness. PwC’s 2024 holiday survey found 65% of shoppers still planned to buy gift cards, yet Gen Z tilted toward experiences over tangible goods. Retailers respond by marketing cards for budgeting rather than gifting, flattening seasonal peaks, and improving cash-flow predictability.
State escheatment-law changes spurring bulk B2B issuance
Idaho’s 2024 repeal of a de minimis exemption and Maryland’s 2025 packaging mandates illustrate tightening state oversight. Corporations bulk-load cards, then engage recipients before dormancy periods expire to minimize unclaimed balances. Sophisticated tracking software alerts HR teams ahead of escheatment deadlines, benefiting vendors that provide integrated compliance dashboards.
Restraints Impact Analysis*
| Restraint | (~) % Impact on CAGR Forecast | Geographic Relevance | Impact Timeline |
|---|---|---|---|
| Escalating gift-card fraud & scam losses | -1.4% | National, fraud-prone regions | Short term (≤ 2 years) |
| CARD Act & multi-state compliance costs | -0.8% | National, state variation | Medium term (2-4 years) |
| Retailers’ breakage-revenue accounting risk | -0.6% | National, large retailers | Long term (≥ 4 years) |
| Interchange-fee-cap debate on open-loop prepaid cards | -0.4% | National, network dependent | Medium term (2-4 years) |
| Source: Mordor Intelligence | |||
Escalating gift-card fraud & scam losses
Organized fraud rings siphon USD 5.7 billion each year through card-draining tactics that exploit open-loop anonymity[2]. Maryland’s Gift Card Scams Prevention Act now requires tamper-evident packaging and staff training from June 2025, and other states are drafting similar rules. Compliance raises costs for retailers, yet stronger security standards also improve consumer confidence, especially for digital formats that avoid on-shelf exposure.
CARD Act & multi-state compliance costs
Federal limits on fees and expirations combine with a patchwork of state laws covering disclosures, packaging, and employee education. Iowa, Nebraska, and West Virginia introduced statutes mandating fraud warnings on racks, adding training expense for mid-market chains. Issuers must juggle divergent record-keeping protocols, prompting many to outsource compliance management.
*Our forecasts treat driver/restraint impacts as directional, not additive. The impact forecasts reflect baseline growth, mix effects, and variable interactions.
Segment Analysis
By Card Type: Open-Loop Growth Challenges Closed-Loop Dominance
Closed-loop programs maintained a 61.75% share of the US gift card and incentive card market in 2025 because branded issuers control pricing and harvest customer data. They rely on app-based balances that create direct engagement, and unit economics improve without network fees. Open-loop competitors nevertheless outpace overall growth at an 8.62% CAGR, propelled by corporate incentive demand for universal acceptance. Maryland’s 2025 security rules that single out network-branded plastics raise execution hurdles, yet Visa’s USD 15.7 trillion transaction backbone assures scalability.
Corporate bulk purchasers increasingly mix both formats, sending open-loop cards for cash-like flexibility and closed-loop cards when encouraging spend with preferred suppliers. Issuers calibrate fraud investments, as open-loop designs shoulder higher attack risk. Meanwhile, closed-loop leaders such as Starbucks deepen loyalty integration to lift reload frequency. The coexistence of formats ensures the US gift card and incentive card market remains segmented by use case rather than a winner-take-all scenario.


By Format Type: Digital Transformation Accelerates
Digital cards accounted for 58.35% share of the US gift card and incentive card market in 2025 and will expand at 11.86% CAGR, well above the overall US gift card and incentive card market. Low production costs, instant delivery, and mobile wallet compatibility drive adoption. Consumers appreciate partial redemptions that track residual value, and corporate administrators prefer downloadable CSV reports that simplify tax filings.
Physical cards continue serving gifting rituals in grocery aisles where tactile presentation still matters. Hybrid use cases abound, for example, QR-coded holiday cards that convert into app-based balances. Fraud mitigation benefits digital products since activation occurs server side rather than on store racks vulnerable to barcode skimming. Regulators now monitor large digital payment facilitators, which reduces perceived risk and stabilizes growth.
By Consumer Type: Corporate Dominance Reshapes Market Dynamics
Corporate buyers controlled 64.85% of the US gift card and incentive card market share in 2025 and are projected to advance at 8.74% CAGR to 2031. HR departments treat cards as morale boosters that bypass payroll taxes, and loyalty teams prize universal redemption that broadens appeal. Centralized procurement APIs link directly to expense-management suites, facilitating same-day distribution for remote staff.
B2C gifting still flourishes around holidays, yet new self-use budgeting behavior among Gen Z targets discretionary spending with brand-specific reloads. Issuers, therefore, personalize marketing by recipient type, offering corporate dashboards for bulk purchasers and gamified saving tools for individual users.
By Distribution Channel: Online Platforms Dominate Growth
Online outlets captured 62.85% share of the US gift card and incentive card market size in 2025 and will climb at 10.78% CAGR. E-commerce embeds card options at checkout, subscription upsells, and loyalty redemptions. These digital placements require near-zero incremental shelf space and enable A/B testing of promotional copy in real time.
Brick-and-mortar remains relevant for impulse purchases, especially in supermarkets where third-party racks host multi-brand cards. Retailers experiment with interactive kiosk displays that print on-demand codes, marrying physical presence with digital fulfillment. Omni-channel redemption supports buy-online-pickup-in-store journeys, tightening the loop between physical and virtual commerce.
By Industry of Application: Food Service Leadership Faces Wellness Challenge
Food and beverage applications held a 26.15% share of the US gift card and incentive card market size in 2025, with Starbucks alone loading USD 3.6 billion in Q1 2024, reinforcing its stature within the US gift card and incentive card industry. Frequent purchase cycles and loyalty tie-ins make restaurant cards sticky.
The health, wellness, and beauty segment is expected to register the fastest 9.32% CAGR as consumers prioritize self-care experiences. Spas, fitness studios, and skincare brands leverage white-label SaaS systems to deploy reloadable cards connected to booking apps. Retailers in electronics, apparel, and home improvement continue steady issuance, but experiential categories steal share as Gen Z budgets toward lifestyle services.
Geography Analysis
Metropolitan regions lead digital uptake because smartphone payments and contactless POS are ubiquitous. Cities such as New York, San Francisco, and Chicago record elevated mobile-wallet redemption, while rural and suburban zones display lingering preference for physical racks. Coastal states exhibit the highest wellness-sector penetration, tied to income levels and consumer health priorities. Midwestern and Southern shoppers still favor food service and general merchandise cards sold in grocery channels.
Corporate headquarters clusters drive B2B volume spikes. Silicon Valley and Seattle technology corridors offer large bundles of open-loop incentives for software engineers, whereas banking hubs like New York favor multi-brand digital catalogs aligned to compliance requirements. State legislation also shapes geography-specific cost structures. Maryland’s packaging mandate and Idaho’s escheatment revisions create early adoption curves for secure designs, with neighboring states monitoring outcomes before implementing copycat laws.
Cross-state workforces require issuers to enable redemption across all 50 states and to handle tax nexus complexities. National retailers, including Walmart and Amazon, leverage their distribution footprints to maintain even gift card availability, offsetting regional economic variability. Regional employment trends influence seasonal velocity; energy-heavy Southern markets swing with oil prices, whereas diversified coastal economies display steadier throughput.
Regulatory Landscape
In the United States, consumer-facing gift certificates, store gift cards, and general-use prepaid cards are primarily governed by the CARD Act framework as implemented through Regulation E (12 CFR 1005.20), which sets baseline protections such as a minimum five-year expiration period for underlying funds and limits on dormancy, inactivity, or service fees unless specified conditions are met. Regulators also scrutinize marketing and disclosures for consumer harm, and the Federal Trade Commission (FTC) maintains consumer-protection guidance around deceptive practices associated with gift cards.
Alongside federal consumer rules, anti-money laundering and payments compliance shape operating models. FinCEN guidance on prepaid access can bring certain network-branded or feature-rich programs into Bank Secrecy Act obligations (including MSB considerations), while many closed-loop programs stay outside the core prepaid access regime unless functionality or thresholds trigger coverage. This split, together with state-level money transmission licensing and state fraud and escheatment requirements, drives multi-jurisdiction compliance design, particularly for large-scale digital distribution and corporate purchasing programs.
Value Chain Analysis
The value chain runs from (1) program sponsors (retailers and corporate buyers), to (2) issuers and processors that run stored-value ledgers and program controls, to (3) distribution partners, including third-party rack operators and e-commerce marketplaces, and then to (4) redemption rails at merchant POS and within apps and wallets. For open-loop incentive cards, payment networks and issuing banks add additional layers, including network processing, interchange economics, and enhanced KYC/AML controls that are less prominent in closed-loop programs.
Digital issuance tightens the link between processors and distribution endpoints through APIs that support bulk ordering, instant delivery, balance servicing, and reporting for corporate users. Compliance requirements under Regulation E (12 CFR 1005.20) and parallel state rules shape product design, disclosures, and fee structures, while fraud pressures shift spend toward security tooling, monitoring, and retailer training. These dynamics help drive consolidation among processors and platforms that can spread compliance and fraud investments across high transaction volumes and multi-state programs.
Competitive Landscape
The competitive field is moderately concentrated. Blackhawk Network processed USD 28 billion in transactions and leverages a 220-country reach that few rivals can match. InComm Payments, Fiserv, and PayPal supply white-label or API-first issuance to thousands of brands, while card networks Visa, Mastercard, and American Express monetize open-loop flows. High compliance costs and sophisticated fraud tools raise entry barriers, encouraging M&A as smaller processors seek shelter within larger suites.
Strategic focus revolves around mobile-wallet integration, real-time analytics, and multilayer fraud detection. Visa and Mastercard partner with fintech fraud-intelligence firms, and issuers pilot AI-based transaction-scoring to cut draining attempts. Digimarc estimates a USD 900 million to USD 1.5 billion annual recurring revenue opportunity in secure card barcoding, illustrating vendor diversification toward security layers.
Retailers with sizeable closed-loop programs, such as Starbucks, Target, and Walmart, exploit brand loyalty and store footprints to maintain negotiating leverage with processors. Meanwhile, niche SaaS players like Tango Card and Factor4 focus on developer-friendly APIs targeting HR tech ecosystems. The regulatory burden will likely compress margins but also reduce fly-by-night competition, tilting power toward incumbents that can spread compliance overhead across massive volume.
US Gift Card And Incentive Card Industry Leaders
-
Blackhawk Network
-
InComm Payments
-
Fiserv
-
PayPal Holdings
-
Mastercard Inc.
- *Disclaimer: Major Players sorted in no particular order
Market Opportunities and Future Outlook
A clear opportunity is closing the gap between employee demand and current employer distribution of gift cards in incentive programs. The 2026 U.S. Consumer Gift Card Study by TSG and Bank of America found 81% of consumers want employer-provided gift cards, while only 41% have received them, pointing to whitespace for B2B platforms that integrate procurement, approvals, and fulfillment into HR and performance-management workflows.
Technology-led program administration is also an active investment area as buyers move from one-off card orders toward platforms that manage catalogs, rules, and reporting across multiple brands and channels. The Incentive Research Foundation, in its 2026 Industry Outlook (published December 2025), highlighted a shift toward integrated technology platforms, mobile apps, and digital tools for program administration in North America. Providers that build compliant disclosures and governance under Regulation E, including business-only positioning where exemptions apply, and pair those controls with fraud reduction and real-time monitoring are positioned to match the operating needs of large corporate buyers and regulated verticals.
Recent Industry Developments
- May 2026: Blackhawk Network (BHN) launched an in-app digital gift card experience within TikTok Shop, enabling users to purchase brand gift cards directly inside the commerce flow. The update pushes gift cards deeper into social commerce and adds a new acquisition channel for brands that rely on digital distribution and mobile-first redemption.
- May 2025: Maryland implemented SB 760 requirements for gift card fraud prevention, including warning notices and employee training for merchants selling gift cards. This raised the operational importance of compliant packaging, point-of-sale processes, and staff enablement, especially for programs exposed to on-shelf tampering and scam-driven loss.
- November 2024: The Consumer Financial Protection Bureau issued a final rule defining larger participants in the digital payment applications market, covering firms that facilitate at least 50 million annual consumer transactions. The rule expanded supervisory reach over major payment app ecosystems that increasingly function as distribution and storage points for digital gift cards and incentives.
Research Methodology Framework and Report Scope
Market Definition and Coverage
This market covers the value loaded in the United States onto gift cards and incentive cards that are bought for personal gifting, corporate rewards, and promotional programs, across physical cards and digital formats. It includes open-loop and closed-loop cards when the intent is gifting or incentives.
Scope exclusions: Reloadable payroll cards, general purpose prepaid debit use, and government benefit disbursements are excluded from this sizing.
Segmentation Overview
- By Card Type
- Open-Loop Card
- Closed-Loop Card
- By Format Type
- Digital Card
- Physical Card
- By Consumer Type
- Individual (B2C)
- Corporate (B2B)
- By Distribution Channel
- Online
- Offline
- By Industry of Application
- Food and Beverages
- Health, Wellness, and Beauty
- Apparel, Footwear, and Accessories
- Consumer Electronics
- Other Industries
Data Sources, Market Sizing, and Validation
Desk Research
Desk research started with how US prepaid and stored value products are categorized, so we did not mix gift and incentive use with other prepaid spending. We referenced public and official sources such as Federal Reserve payments publications, Federal Trade Commission materials on gift card rules and fraud, US Census Bureau retail sales releases, Bureau of Labor Statistics inflation series, and SEC filings for issuer and retailer disclosures.
After that, we used issuer and program disclosures such as annual reports, earnings call transcripts, and investor decks to understand loading flows, channel mix, and seasonality. We also checked reputable association resources such as the Institute for Gift Card and Payment Industry, and we used paid subscriptions focused on company financials, news, and patent databases to keep facts consistent across time and to spot new program features. These sources are illustrative, and we also used other public references for data collection, cross-checking, and clarification.
Primary Interviews and Surveys
Primary interviews and surveys were used to confirm how gift and incentive programs are actually run, which products are counted as gift cards versus adjacent prepaid tools, and how loading value moves across retail, B2B, and digital channels. We spoke with issuers, program operators, distributors, and large buyers of incentives, so assumptions on seasonality, fees, and breakage could be checked and then tightened for the US context.
Distribution of primary research fieldwork respondents
| Company type | Respondent position |
|---|---|
| Top tier: 28% | CXOs: 21% |
| Mid tier: 51% | Functional/Unit leaders: 23% |
| Smaller Players: 21% | Managers: 56% |
Market-Sizing & Forecasting
The core model is built using a top-down approach where US spending and payments indicators are reconstructed into a gift and incentive card demand pool, followed by applying channel and use-case splits that were validated through interviews. To keep totals realistic, the output is then checked against selective bottom-up inputs, such as sampled issuer rollups, retailer program disclosures, and an ASP-times-volume sanity check for key channels.
Key inputs used in the model include the value loaded (not just cards issued), the split between open-loop and closed-loop programs, corporate incentive adoption versus consumer gifting share, digital versus physical delivery mix, and the holiday loading spike pattern that affects yearly totals. Where a data point was not consistently observable, we filled the gap using stable ratios confirmed by primary respondents, and then stress-tested the result using conservative and aggressive cases.
Forecasts were developed using scenario analysis supported by regression-based relationships between loading value and drivers such as retail sales momentum, inflation, and shifting digital adoption. Assumptions were reviewed with market participants, so the forward view reflects expected program budgets, promotional intensity, and normalization after peak periods.
Data Validation & Update Cycle
Validation was handled through repeated cross-checks across independent signals, and then the assumptions were reviewed again when mismatches appeared. We compare outputs against known seasonality patterns, issuer commentary, and directionally consistent payments and retail indicators, which helps flag cases where incentive volumes were overextended or where prepaid debit activity was mistakenly creeping into the totals.
Before sign-off, the model and narrative go through multi-step analyst reviews, and respondents are re-contacted when a key variable moves outside a reasonable range. Reports are refreshed annually, and interim updates are made when material events change buying behavior, regulation, or program economics. Right before delivery, a final review pass is completed so clients receive the latest updated view.
Mordor Intelligence's US Gift Card and Incentive Card Market Estimate Compared With Other Published Estimates
Published market values for US gift and incentive cards can look different because the scope is drawn differently, and because some models mix stored value products that have a similar payment form but a different buying intent. Differences also come from whether the sizing uses value loaded versus value redeemed, and from how breakage and fees are treated in nominal dollars.
The main gap comes from whether reloadable payroll and general purpose prepaid debit activity is blended into the same bucket, where gift and incentive cards are counted only when the purchase intent is gifting, rewards, or promotions in Mordor Intelligence.
Benchmark comparison
| Source | Market Size | Gaps in Research Methodology |
|---|---|---|
| Mordor Intelligence | USD 207.09 B (2025) | |
| Industry Databook A | USD 214.30 B (2024) | Uses a different base year and may reflect a broader industry view driven by retailer category reporting, which can shift totals when loading timing and redemption timing are not aligned. |
| Global Consultancy B | USD 231.40 B (2026) | Reported year is later, and some approaches widen the counted pool by blending adjacent prepaid card use and using faster digital shift assumptions, which increases the headline value. |
Taken together, the spread is mainly explained by year alignment and by whether adjacent prepaid products are grouped with gift and incentive cards. By keeping the unit of measure consistent as value loaded and by checking assumptions against seasonality and issuer disclosures, our sizing stays traceable to practical inputs that can be rechecked and updated.
Key Questions Answered in the Report
What is the current value of the US gift card and incentive card market?
The market stands at USD 220.38 billion in 2026 and is forecast to rise to USD 300.73 billion by 2031, reflecting a 6.42% CAGR.
Why are corporate purchases so important to this market?
Enterprises account for 64.85% of the 2025 market size because HR and loyalty teams use cards for tax-efficient rewards that avoid payroll complexity and enable digital delivery.
How quickly is the digital gift card segment growing?
Digital formats already hold a 58.35% share and are projected to expand at a 11.86% CAGR, benefiting from mobile-wallet integration and lower fulfillment costs.
Which industry vertical shows the fastest momentum?
The health, wellness, and beauty segment is expected to lead growth at a 9.32% CAGR as consumers channel discretionary budgets toward self-care experiences.
What are the main regulatory challenges facing issuers?
Rising fraud losses, multi-state compliance expenses under the CARD Act, and new state escheatment rules all elevate operating costs and favor large, tech-savvy providers.
How does fraud legislation affect open-loop and closed-loop cards differently?
Maryland’s 2025 law imposes earlier deadlines for open-loop packaging changes, reflecting higher attack surfaces, whereas closed-loop programs face the same rules four months later.