
Market Overview
| Study Period | 2020 - 2031 |
|---|---|
| Forecast Data Period | 2026 - 2031 |
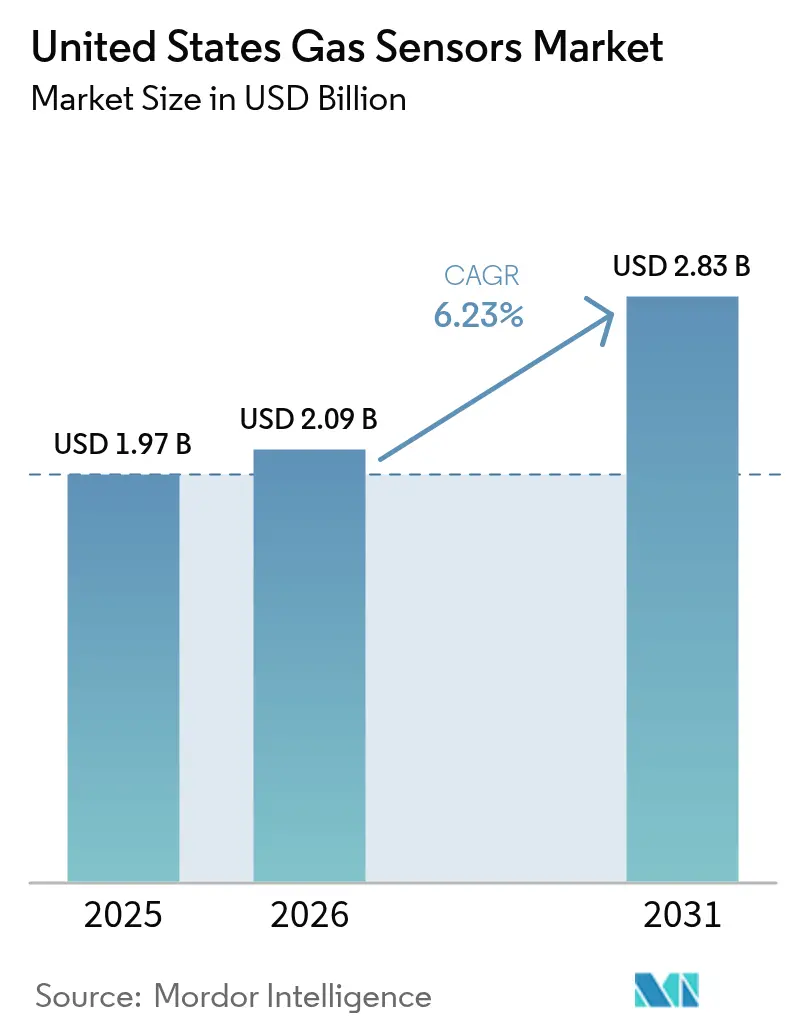
| Base Year Market Size (2025) | USD 1.97 Billion |
| Market Size (2026) | USD 2.09 Billion |
| Market Size (2031) | USD 2.83 Billion |
| Growth Rate (2026 - 2031) | 6.23 % |
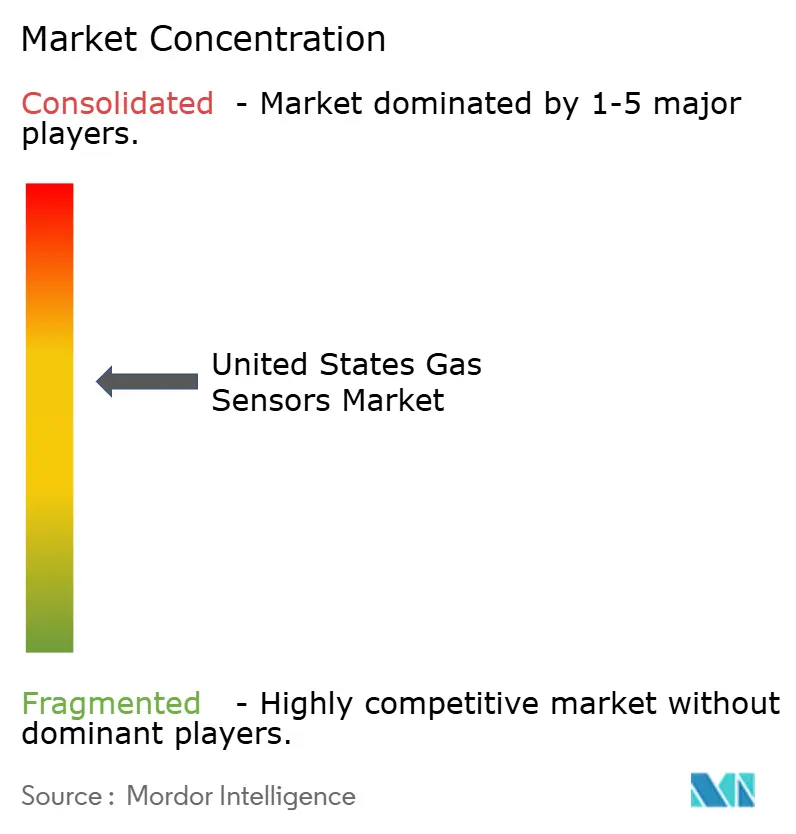
| Market Concentration | Medium |
Major Players *Disclaimer: Major Players sorted in no particular order Image © Mordor Intelligence. Reuse requires attribution under CC BY 4.0. | |
United States Gas Sensors Market Analysis by Mordor Intelligence
The United States gas sensors market size in 2026 is estimated at USD 2.09 billion, growing from 2025 value of USD 1.97 billion with 2031 projections showing USD 2.83 billion, growing at 6.23% CAGR over 2026-2031. Demand is sustained by federal safety rules that push factories and refineries to install continuous leak-detection systems, while stricter ASHRAE ventilation standards extend adoption across commercial buildings. Wireless and IoT-ready devices are rapidly gaining favour as low-power networks cut installation costs and enable remote diagnostics that improve uptime. Edge-AI analytics now run directly on the sensor node, turning raw data into real-time alerts that help prevent costly incidents. [2] Hydrogen infrastructure rollouts are creating a surge of orders for ultra-sensitive detectors, and MEMS-based designs are lowering size and power requirements, opening new uses in wearables and portable safety gear. Competitive intensity is moderate: diversified safety leaders still dominate critical-process niches, but semiconductor specialists are carving out share with compact, software-driven platforms. [1]
Key Report Takeaways
- By connectivity type, the wired segment held 53.42% of the United States gas sensors market share in 2025, while wireless devices are forecast to grow at an 11.12% CAGR through 2031.
- By gas type, carbon monoxide sensors led with 27.62% share in 2025; hydrogen sensors are projected to expand at a 14.05% CAGR to 2031.
- By technology, electrochemical sensors accounted for 31.08% of the United States gas sensors market size in 2025, whereas MEMS MOS platforms are expected to increase at a 12.74% CAGR between 2026 and 2031.
- By application, industrial safety and process systems commanded 35.55% of the United States gas sensors market in 2025; hydrogen fuelling stations are expected to post the fastest growth at a 14.88% CAGR through 2031.
Note: Market size and forecast figures in this report are generated using Mordor Intelligence’s proprietary estimation framework, updated with the latest available data and insights as of 2026.
United States Gas Sensors Market Trends and Insights
Drivers Impact Analysis*
| Driver | (~) % Impact on CAGR Forecast | Geographic Relevance | Impact Timeline |
|---|---|---|---|
| OSHA & EPA compliance driving industrial demand | +2.1% | National, industrial hubs | Medium term (2-4 years) |
| Growing HVAC / IAQ adoption (ASHRAE 62.1) | +1.8% | National, Northeast and West | Medium term (2-4 years) |
| Automotive cabin-air quality monitoring | +1.2% | National, automotive manufacturing regions | Long term (≥ 4 years) |
| Edge-AI & IoT-enabled predictive maintenance | +1.5% | National, early adoption in industrial centers | Medium term (2-4 years) |
| Hydrogen refuelling leak-detection roll-out | +1.3% | West and Northeast, expanding nationally | Long term (≥ 4 years) |
| Methane-leak rules under IIJA pipelines program | +1.7% | National, oil and gas producing regions | Short term (≤ 2 years) |
| Source: Mordor Intelligence | |||
OSHA and EPA Compliance Driving Industrial Demand
Regulatory updates on methane and toxic gas emissions require plants to verify leaks at lower thresholds and carry penalties that can reach USD 25,000 per day. Facilities therefore invest in multi-gas arrays that detect parts-per-billion concentrations, adding process-control value beyond compliance. Engineering teams are now specifying detectors that integrate with safety-instrumented systems to automate shutdowns when hazardous levels arise, a capability that shortens response time and limits liability exposure. Compliance spending is heaviest in oil, gas, and chemical clusters across Texas, Louisiana, and Pennsylvania, securing a reliable revenue stream for suppliers. Large buyers prefer product lines supported by calibration programs and cloud-based audit trails that simplify regulatory reporting.
Growing HVAC / IAQ Adoption (ASHRAE 62.1)
The 2024 update to ASHRAE 62.1 tightened accuracy targets for CO₂ meters, prompting building operators to swap older hardware for advanced optical or electrochemical devices. Office towers, hospitals, and schools now integrate occupancy-based ventilation controls that link gas readings to air-handling units, balancing energy savings with health criteria. Portfolio owners see indoor-air data as an amenity that supports tenant retention, elevating gas sensors from back-of-house equipment to a visible part of wellness branding. Strongest adoption is in the Northeast and California, where state incentives pair with sustainability mandates. System integrators bundle sensors with analytics dashboards to provide fault alerts and ventilation scorecards in a single view. [4]
Automotive Cabin-Air Quality & Emissions Monitoring
Carmakers install multi-gas modules in HVAC ducts to maintain healthy cabin environments amid congested traffic. Research shows in-cabin pollutant peaks that exceed outdoor levels by up to 10 times during commutes, spurring fitment in mid-range models. Electric vehicles present unique ventilation challenges due to sealed battery compartments, increasing demand for low-power MEMS arrays that monitor organics, CO, and particulates together. Suppliers package these arrays with software that triggers recirculation or filtration events, enhancing occupant comfort and brand differentiation. Production lines in Michigan and Ohio anchor early volume, while Asian manufacturers prepare to import sensor-equipped vehicles that match U.S. indoor-air expectations.
Edge-AI and IoT-Enabled Predictive Maintenance
Deploying analytics at the sensing node reduces bandwidth costs and turns time-series gas readings into failure forecasts. Field trials in shale production show maintenance cost cuts of 30-50% after deploying edge-enabled detectors on compressors and flare stacks. Algorithms trained on historic leak patterns flag drift in baseline readings, letting crews service equipment before a release occurs. Battery-powered devices last five years when paired with low-power wide-area networks, making them viable for remote wellheads and midstream assets. Vendors monetize value-added subscriptions that deliver predictive reports and compliance logs through secure dashboards.
Methane-Leak Rules Under IIJA Pipelines Program
Pipeline operators must now perform quarterly leak surveys and rapidly repair any exceedances, raising orders for continuous monitors capable of detecting sub-ppm methane. Projects concentrate in Texas, Oklahoma, and Pennsylvania, where aging infrastructure intersects with new gas production. Industrial Internet gateways relay readings to central control rooms, reducing truck rolls for inspection rounds. Technology suppliers' partner with aerial-survey firms to combine fixed-sensor data with drone and satellite imagery, delivering compliance documentation in a single platform.
Restraints Impact Analysis*
| Restraint | (~) % Impact on CAGR Forecast | Geographic Relevance | Impact Timeline |
|---|---|---|---|
| High calibration & maintenance costs | −1.2% | National, higher impact where skilled labour is scarce | Medium term (2-4 years) |
| Sensor price commoditisation | −0.9% | National | Long term (≥ 4 years) |
| Domestic MEMS-fab capacity bottlenecks | −0.8% | Semiconductor manufacturing regions | Short term (≤ 2 years) |
| Cyber-security worries for cloud sensors | −0.7% | National, critical infrastructure sectors | Medium term (2-4 years) |
| Source: Mordor Intelligence | |||
High Calibration & Maintenance Costs
Quarterly calibration protocols require specialty test gas, trained staff, and downtime that can push lifetime ownership costs to 40% of equipment spend. Smaller plants often delay service intervals, risking false alarms or undetected leaks that undermine safety investments. Manufacturers respond with self-calibrating cells and remote diagnostics, yet capital prices rise, forcing buyers to weigh upfront savings against recurring labour. Skill shortages in rural regions worsen the burden, prompting some operators to outsource maintenance contracts that bundle sensors, service, and compliance documentation.
Sensor Price Commoditisation
Basic carbon-monoxide and combustible-gas detectors now face price drops of 15-30% as new Asian entrants replicate mature designs. Falling margins pressure established firms to shift R&D toward multi-gas arrays and software-enhanced systems where differentiation lies in analytics and integration rather than hardware alone. Customers benefit from cheaper single-gas units but may face higher total cost of ownership if low-cost imports lack local support or long-term calibration parts.
*Our forecasts treat driver/restraint impacts as directional, not additive. The impact forecasts reflect baseline growth, mix effects, and variable interactions.
Segment Analysis
By Type: Wireless Connectivity Drives Remote Monitoring Revolution
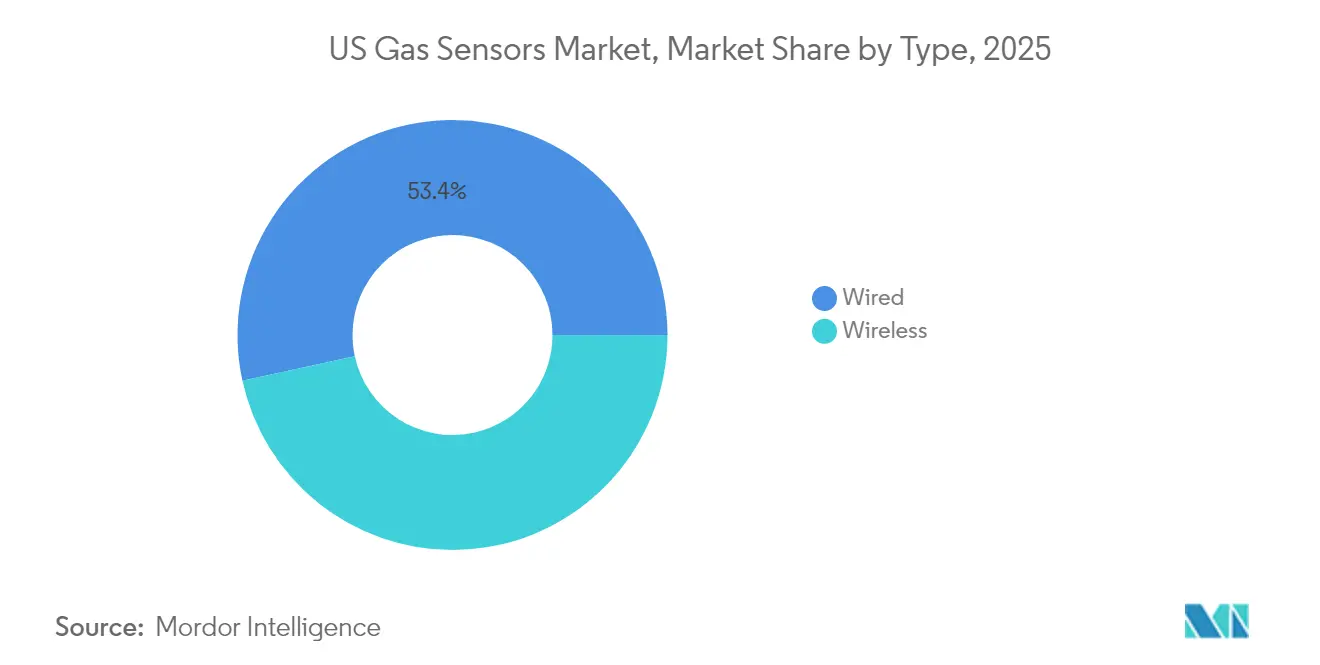
The wired category maintained a 53.42% position in the United States gas sensors market during 2025, anchored by process industries that require uninterrupted power and fail-safe communication. These installations typically connect directly to distributed control systems, ensuring compliance in hazardous zones. However, wireless nodes are growing at an 11.12% CAGR, propelled by low-power wide-area technologies that stretch battery life to more than five years. Facility managers deploy mesh networks that allow temporary placement during turnarounds or in legacy buildings where cabling is cost prohibitive. Wireless flexibility supports granular sensor placement, elevating coverage in multi-story schools and hospitals that seek better ventilation insight. Integrators combine wireless gas data with occupancy and energy metrics, bundling value propositions that extend beyond safety into operational efficiency.
The rise of wireless options also reshapes service models. Vendors now offer subscription packages that wrap hardware, network connectivity, and analytics dashboards in single agreements. This shift reduces capital budgets and enables evergreen upgrades when new sensors emerge. As the United States gas sensors market size relevant to wireless installations climbs, procurement teams pivot toward total-cost evaluations that emphasize lifetime value and software functionality. While wired systems will remain standard in high-risk areas, hybrid architectures emerge, pairing permanent wired detectors in Class I Division 1 zones with wireless devices in less hazardous spaces to optimize spend.

By Technology: MEMS MOS Sensors Disrupt Traditional Platforms
Electrochemical cells held 31.08% of the United States gas sensors market share in 2025 due to their proven accuracy for CO, H₂S, and NO₂. Catalytic-bead designs persisted as the go-to choice for combustible gases in Class I environments, while NDIR optics gained popularity for CO₂ in HVAC controls. PIDs served niche roles monitoring VOCs during hazmat response and industrial hygiene campaigns.
MEMS MOS devices are on track to post 12.74% CAGR growth between 2026 and 2031 as semiconductor production reduces per-unit costs and enables multi-gas identification in coin-sized packages. Machine-learning algorithms compensate for cross-sensitivity, letting a single die discriminate among methane, hydrogen, and volatile organics with contextual accuracy. Wearables for lone-worker safety and consumer electronics integrate these chips to alert users to hazardous environments in real time. The migration to MEMS also lowers power draw, extending battery life in wireless nodes and aligning with sustainability objectives that discourage frequent battery swaps.
By Application: Industrial Safety Leads While Hydrogen Fuelling Accelerates
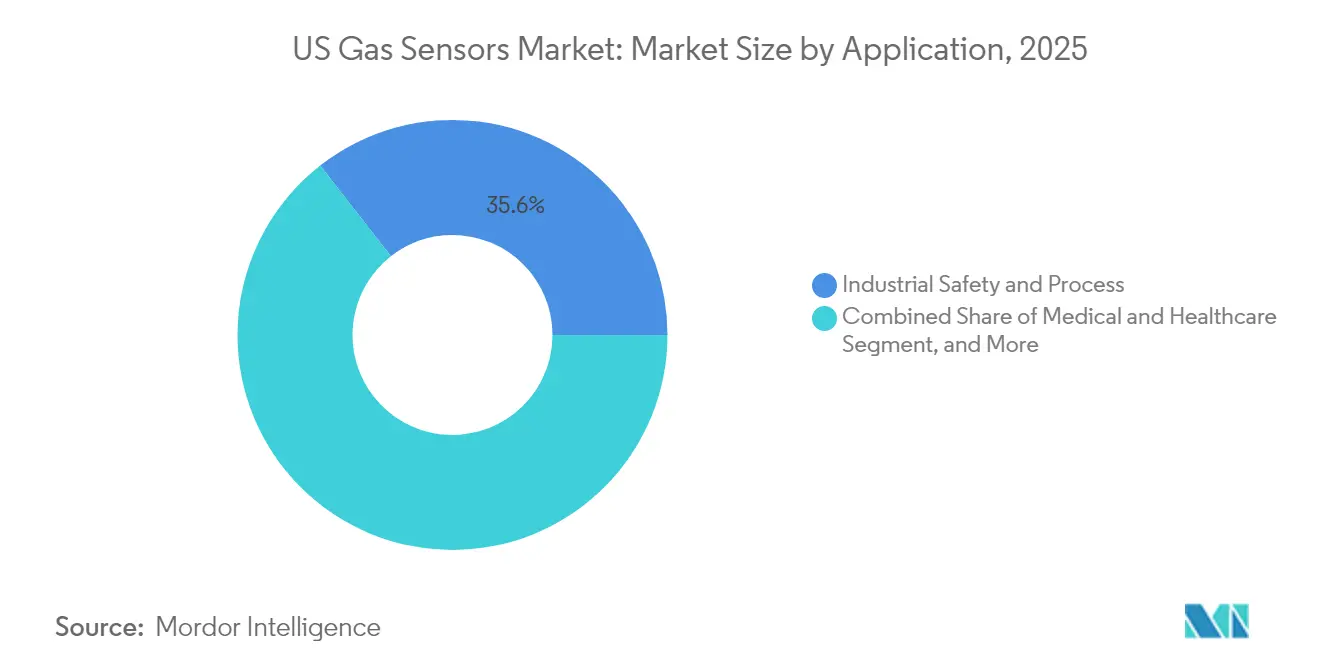
Industrial safety and process applications contributed 35.55% of 2025 revenue, underscoring the prime importance of gas monitoring in petrochemical, mining, and steel operations. Regulations mandate multi-layer detection, from personal monitors to fixed-point arrays that alarm both locally and in centralized control rooms. Building-automation deployments continue to rise as facility managers link gas readings to HVAC controls for energy optimization and occupant wellness. Medical settings rely on oxygen and anaesthetic-gas sensors in surgical suites and respiratory-therapy equipment. Food and beverage producers use CO₂ and ethanol detectors to manage fermentation and packaging processes, reducing spoilage and ensuring worker protection.
Hydrogen fuelling stations represent the fastest-growing domain at 14.88% CAGR. Each station requires overhead, pit, and compressor-cabinet detectors that must endure outdoor conditions, vibration, and potential water spray. Sensor packages integrate modular control panels with automated shutdown valve logic to meet code. Early deployments along California’s I-5 corridor and the Northeast’s proposed hub validate the business case for purpose-built hydrogen detection solutions. As federal funding accelerates buildouts, vendors with certified offerings anticipate multi-year backlog expansion, reinforcing hydrogen’s role as a demand catalyst for the United States gas sensors market.
By Gas Type: Hydrogen Detection Emerges as Growth Catalyst
Carbon-monoxide detectors held 27.62% share in 2025, evidencing their ubiquitous role in boilers, parking garages, and residential compliance. Toxic gases such as hydrogen sulphide and nitrogen dioxide maintain steady demand, driven by process-safety regulations across refineries and chemical plants. Carbon dioxide sensors gain traction in indoor air-quality schemes aligned with ASHRAE guidance, especially in office retrofits that aim for WELL or LEED certifications. Nitrogen-oxide sensors expand within emissions-control systems as power stations adopt selective catalytic reduction.
Hydrogen detectors, forecast to rise at a 14.05% CAGR, are transforming vendor roadmaps. Fuelling-station developers integrate multi-sensor arrays that couple fast optical detectors with slower catalytic beads to guarantee redundancy under NFPA 2 rules. The Department of Energy’s hub initiatives increase volume needs, leading manufacturers to invest in palladium-film MEMS processes that deliver ppm-level sensitivity without drift. As the United States gas sensors market aligns to hydrogen infrastructure, component suppliers offering certified intrinsically safe models secure early design wins across electrolyser halls, compression skids, and transport trailers.
Geography Analysis
The United States gas sensors market serves a nation-wide customer base spanning heavy industry, utilities, transportation, commercial real estate, and residential codes. Federal rules such as OSHA’s Hazard Communication Standard and EPA emissions limits apply uniformly across all states, creating consistent baseline demand for fixed and portable detectors. National building standards, including ASHRAE 62.1, fuel widespread CO₂ and CO monitoring in offices, schools, and healthcare facilities. Large industrial corporations often deploy standardized sensor platforms across multiple states to streamline maintenance, calibration, and regulatory reporting.
Infrastructure initiatives funded by the Infrastructure Investment and Jobs Act (IIJA) stimulate deployment of continuous methane monitors along national pipeline corridors. The Department of Energy’s hydrogen-hub program distributes grants to multiple consortia, triggering orders for hydrogen detectors in production, storage, and fueling applications across the country. Automotive assembly plants from Michigan to South Carolina integrate multi-gas modules into vehicle HVAC systems, demonstrating uniform uptake of air-quality sensors in manufacturing and transportation segments.
Uniform national demand encourages suppliers to operate centrally managed service contracts, remote diagnostics, and cloud-based calibration dashboards that support installations from Alaska to Florida. Distribution partners maintain stocking branches in key industrial metros, while e-commerce channels extend reach to small and medium-sized enterprises throughout the United States gas sensors market. This cohesive national landscape allows vendors to build scale economies in production, logistics, and customer training, supporting robust long-term growth prospects.
Regulatory Landscape
OSHA rules requiring atmospheric testing and continuous or periodic monitoring in permit-required confined spaces (29 CFR 1910.146), hazardous waste operations (29 CFR 1910.120), and grain handling (29 CFR 1910.272) support procurement of fixed and portable gas-sensing hardware, while also reinforcing calibration practices with documentation such as NIST-traceable calibration gases. On the environmental side, the US EPA has expanded instrument-driven leak monitoring obligations in industrial operations.
In March 2026, the EPA finalized amendments to the NESHAP for Chemical Manufacturing Area Sources (CMAS), establishing an annual instrument monitoring program for equipment leaks using EPA Method 21 (10,000 ppmv leak definition) and requiring quarterly monitoring for certain heat exchange systems using the Modified El Paso Method. In April 2026, the EPA also proposed a technology review for NESHAP covering crude oil and natural gas production and transmission/storage, indicating additional scrutiny of previously unregulated emission points and reinforcing demand for compliant sensing methods and audit-ready monitoring records.
Value Chain Analysis
The US gas sensors value chain begins with core sensing elements and materials, including electrochemical cells, MOS/MEMS dies, NDIR optical components, catalytic bead elements, and supporting ASICs. These components then move through module packaging, firmware, and connectivity integration into sensor nodes, followed by calibration, certification, and assembly into deployable sensing elements and modules. Distribution to end users typically runs through industrial automation and safety distributors, HVAC and building-automation integrators, and OEM channels that embed sensing modules into equipment used across industrial safety, building automation, automotive, and healthcare applications.
A structural feature is that the United States functions as a value-add hub for design, software, assembly, and certification, while still relying on imported components for a meaningful share of critical inputs, particularly optical and electrochemical components and certain IC content. Qualification and compliance steps can extend lead times, and hazardous-location certification (IECEx/ATEX) timelines average around 14 months for new platforms, with custom qualification cycles for some deployments stretching to 12-18 months. Calibration execution also creates operational constraints, where certified technician availability and recurring calibration needs increase the role of lifecycle service, which in turn pushes vendors toward bundled calibration programs, remote diagnostics, and documentation workflows that reduce downtime and support auditability.
Competitive Landscape
Market concentration is moderate; the top five participants hold an estimated 45% share, yet no single company dominates. Honeywell, MSA Safety, and Amphenol Advanced Sensors leverage broad portfolios and global service networks to retain leadership in hazardous-location applications. Honeywell’s 2025 launch of the Sensepoint XRL Plus underscores the shift toward connected platforms that pair field devices with cloud-ready software. MSA’s USD 200 million purchase of M&C TechGroup adds process-analysis depth that complements its portable and fixed device lines.
Semiconductor suppliers enter with MEMS offerings, challenging incumbents on size, power efficiency, and integrated analytics. Partnerships between chipmakers and software firms signal a pivot toward data-centric value propositions, where recurring subscription revenue outpaces hardware margins. Niche players focus on specialty gases or ultralow detection limits, securing research contracts and regulatory pilots. The field also sees alliances between optical-sensor experts and wireless-network providers that bundle connectivity and cybersecurity features for critical infrastructure clients.
White-space segments include low-power sensors for battery-operated IoT nodes, miniaturized multi-gas arrays for wearables, and detectors tailored to emerging fuels such as ammonia and e-methanol. Intellectual-property filings concentrate on machine-learning algorithms and sensor-fusion techniques, highlighting a race to convert raw data into actionable intelligence. Successful vendors position themselves as solution partners, offering complete packages from hardware to analytics, calibration, and compliance documentation, an approach that strengthens switching costs and customer loyalty within the United States gas sensors market.
United States Gas Sensors Industry Leaders
-
Honeywell International Inc.
-
Emerson Electric Co.
-
MSA Safety Incorporated
-
Amphenol Advanced Sensors
-
Figaro USA Inc.
- *Disclaimer: Major Players sorted in no particular order
Market Opportunities and Future Outlook
Regulation-driven LDAR and emissions monitoring create whitespace for higher-performance, lower-maintenance sensing approaches that simplify compliance documentation. The EPA CMAS NESHAP amendments finalized in 2026 introduce defined instrument-monitoring programs, including Method 21-based leak checks and quarterly monitoring for qualifying heat exchange systems. This expands the addressable need for sensors and modules that can sustain repeatable measurement performance, integrate into plant reporting workflows, and maintain calibration traceability.
This also supports opportunities for multi-gas arrays and connected sensor nodes that reduce manual inspection burden by pairing measurements with automated records. A second opportunity is the expansion of accepted measurement pathways for advanced methane detection, which improves procurement clarity for optical solutions in regulated use cases. In April 2025, the EPA formally authorized Sensirion Connected Solutions Nubo Sphere laser-based photoacoustic methane sensing technology for use under 40 CFR Part 60 NSPS and related Emission Guidelines, creating a concrete regulatory route for laser-based detection adoption. With industrial programs emphasizing wireless and IoT-enabled instrumentation, suppliers that bundle sensing elements with secure connectivity, edge analytics, and field-service programs can compete beyond hardware pricing, particularly where calibration and maintenance costs are limiting factors for smaller or distributed sites.
Recent Industry Developments
- March 2026: Honeywell announced a major expansion of its gas sensing portfolio with the 4-Series NDIR hydrocarbon sensor, designed for integration into fixed safety systems and scalable connected monitoring architectures. The update broadens Honeywell's ability to deliver high-sensitivity hydrocarbon detection across industrial facilities and energy storage deployments.
- July 2025: Honeywell acquired the Li-ion Tamer business from Nexceris, adding off-gas detection capabilities used to identify early thermal runaway signatures in lithium-ion battery installations. The deal expands Honeywell's gas-detection portfolio into battery safety applications and broadens the installed base for sensor-enabled monitoring programs.
- August 2024: Honeywell introduced an end-to-end emissions monitoring solution update that included hardware enhancements such as solar capability for the Versatilis Signal Scout gas detector. The update strengthens offerings for remote and hard-to-power monitoring points, aligning with demand for continuous sensing across dispersed assets.
Research Methodology Framework and Report Scope
Market Definition and Coverage
This market is defined as revenues from gas sensing elements and sensor modules sold in the United States that measure specific gases and output a quantifiable signal for monitoring, safety, or control use.
Scope exclusions: We exclude complete portable detection handsets, standalone gas analyzers, and pure software analytics that do not include a separately sold sensing element.
Segmentation Overview
- By Type
- Wired
- Wireless
- By Gas Type
- Oxygen
- Carbon Monoxide
- Carbon Dioxide
- Nitrogen Oxide
- Hydrocarbon
- Others
- By Technology
- Electrochemical
- Photo-Ionisation Detector (PID)
- Solid-State / MOS
- Catalytic Bead
- Infra-Red (NDIR)
- Semiconductor
- By Application
- Medical and Healthcare
- Building Automation
- Industrial Safety and Process
- Food and Beverage
- Automotive
- Transportation and Logistics
- Other Applications
Data Sources, Market Sizing, and Validation
Desk Research
Desk research starts by building a fact base on where gas sensing demand is likely to sit in the US, and then narrowing that into a practical sizing boundary. Public sources, such as OSHA safety standards, EPA air programs, US Census Bureau manufacturing data, USITC trade statistics, and NIST technical publications, are used to ground model inputs and timelines in observable signals.
We also review company annual reports, investor presentations, product catalogs, and reputable press coverage to understand sensor shipments directionally, pricing cues, and which end uses are adding sensing points. In parallel, paid subscriptions that compile company financials and patent records are used to cross-check product focus and innovation activity, especially where public disclosure is thin. These desk sources are not exhaustive, and many additional public references were consulted for data collection, cross-checking, and clarifying assumptions.
Primary Interviews and Surveys
Primary work is used to test assumptions that desk sources cannot fully confirm, like typical sensor replacement cycles, channel markups, and how buyers choose between electrochemical, catalytic, MOS, and infrared options. Interviews and surveys were run with a mix of manufacturers, component distributors, integrators, and end users across industrial safety, building systems, and automotive related use, and the input helped us adjust penetration rates and pricing paths for the US market.
Distribution of primary research fieldwork respondents
| Company type | Respondent position |
|---|---|
| Top tier: 35% | CXOs: 15% |
| Mid tier: 48% | Functional/Unit leaders: 41% |
| Smaller Players: 17% | Managers: 44% |
Market-Sizing & Forecasting
Sizing is built using a top-down approach, where the addressable demand pool is reconstructed from US production, trade, and application level adoption signals, and then converted into value using typical sensor ASP ranges and mix. The totals are then corroborated with selective bottom-up approximations, such as supplier revenue splits, sampled ASP times estimated unit volumes for key end uses, and channel checks to make sure the number stays realistic.
Key model inputs include safety and ventilation compliance activity, installed base expansion in industrial sites, building automation rollouts, automotive sensing penetration, and observed replacement intervals tied to calibration and operating conditions. Pricing is not held flat, because we incorporate gradual ASP progression based on technology mix shifts and feedback on procurement behavior. For forecasting, scenario analysis is used so growth rates can be flexed under different assumptions around industrial activity, regulatory enforcement intensity, and building retrofits, and then the final path is selected based on expert consensus.
Data Validation & Update Cycle
Outputs are checked against independent signals like trade movement, manufacturing output direction, and demand intensity in major end uses before the final number is signed off. When a large variance shows up, assumptions are re-opened and targeted follow-ups are triggered to confirm whether the gap is real or caused by scope or pricing treatment.
A multi-step analyst review is followed so the math, assumptions, and unit logic remain consistent from history to forecast. The report is refreshed annually, and interim updates are made when material events change demand or pricing, followed by a final pre-delivery pass so the latest market context is reflected.
Mordor Intelligence's US Gas Sensors Market Sizing Compared With Other Published Estimates
Published market sizes for US gas sensors can differ even when the topic name looks similar, because the counting boundary is not always the same. The biggest swings usually come from whether the estimate is limited to sensing elements and modules, or whether it bundles complete gas detection equipment and related hardware.
By tracking discrete sensor and module revenue lines and refresh timing, Mordor Intelligence keeps the total tied to sensing components sold separately (instead of folding in full detectors or analyzers), which is also why some estimates land lower when they restrict end uses or use narrower shipment assumptions.
Benchmark comparison
| Source | Market Size | Gaps in Research Methodology |
|---|---|---|
| Mordor Intelligence | USD 1.97 B (2025) | |
| Market Tracker A | USD 664.8 M (2024) | Uses an earlier base year and appears to apply a narrower demand pool and pricing set, which can undercount industrial and building automation volumes where sensors are embedded in broader systems. |
| Industry Analyst B | USD 1.19 B (2024) | Measures gas detection equipment rather than only sensors, so the value includes finished devices and related hardware, which changes the boundary and makes year to year comparisons non-like-for-like. |
Taken together, the spread is mainly explained by scope boundaries and the way ASP and demand pools are constructed for the US. When the market is kept at the sensing element and module level, and the assumptions are cross-checked with adoption, replacement, and pricing signals, the result is easier to trace and repeat across updates.
Key Questions Answered in the Report
What is the current value of the United States gas sensors market?
The market stands at USD 2.09 billion in 2026 and is projected to reach USD 2.83 billion by 2031.
Which connectivity type is growing fastest?
Wireless gas sensors are forecast to grow at an 11.12% CAGR from 2026 to 2031 as organizations shift toward IoT-enabled remote monitoring.
Why is hydrogen detection seeing rapid adoption?
Federal funding for hydrogen hubs and strict safety codes is driving a 14.05% CAGR for hydrogen gas sensors, the fastest among all gas types.
How do edge-AI gas sensors improve maintenance?
On-device analytics transform raw readings into predictive alerts, cutting maintenance costs by up to 50% in pilot programs across oil and gas operations.
Which region shows the strongest regulatory influence on adoption?
California imposes the nation’s most stringent leak-detection requirements, accelerating sensor deployment in industrial plants and hydrogen fuelling stations.
What is the main challenge limiting wider sensor adoption in small facilities?
High calibration and maintenance costs, often representing 40% of total ownership expenses, deter smaller operators from deploying optimal sensor coverage.