
United States Freestanding Emergency Department Market Size and Share
Market Overview
| Study Period | 2020 - 2031 |
|---|---|
| Forecast Data Period | 2026 - 2031 |
| Base Year Market Size (2025) | USD 15.08 Billion |
| Market Size (2026) | USD 15.87 Billion |
| Market Size (2031) | USD 20.47 Billion |
| Growth Rate (2026 - 2031) | 5.23 % |
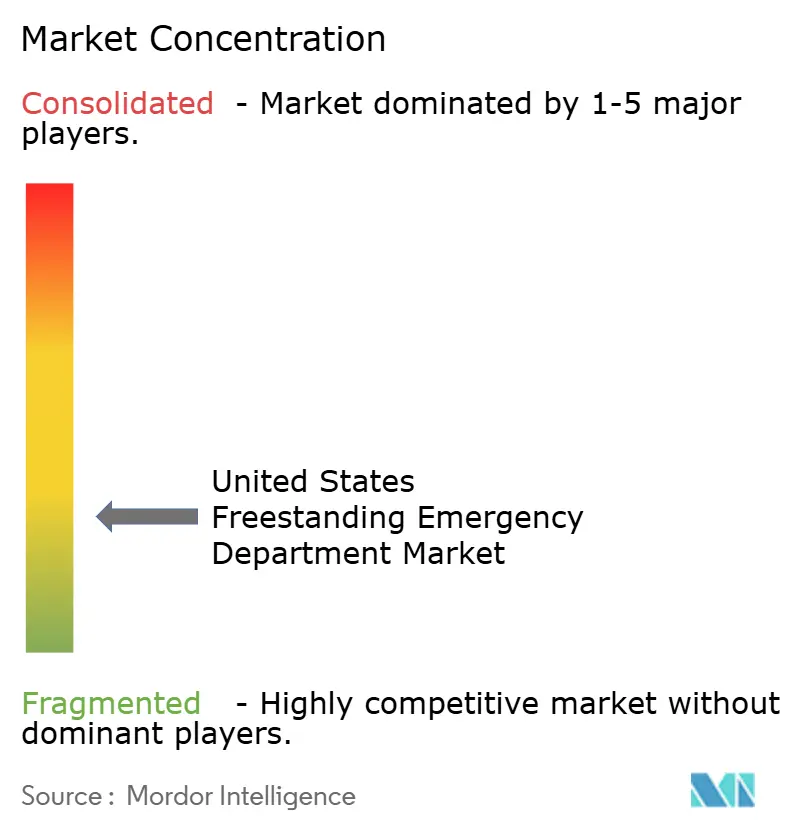
| Market Concentration | Low |
Major Players *Disclaimer: Major Players sorted in no particular order Image © Mordor Intelligence. Reuse requires attribution under CC BY 4.0. | |
United States Freestanding Emergency Department Market Analysis by Mordor Intelligence
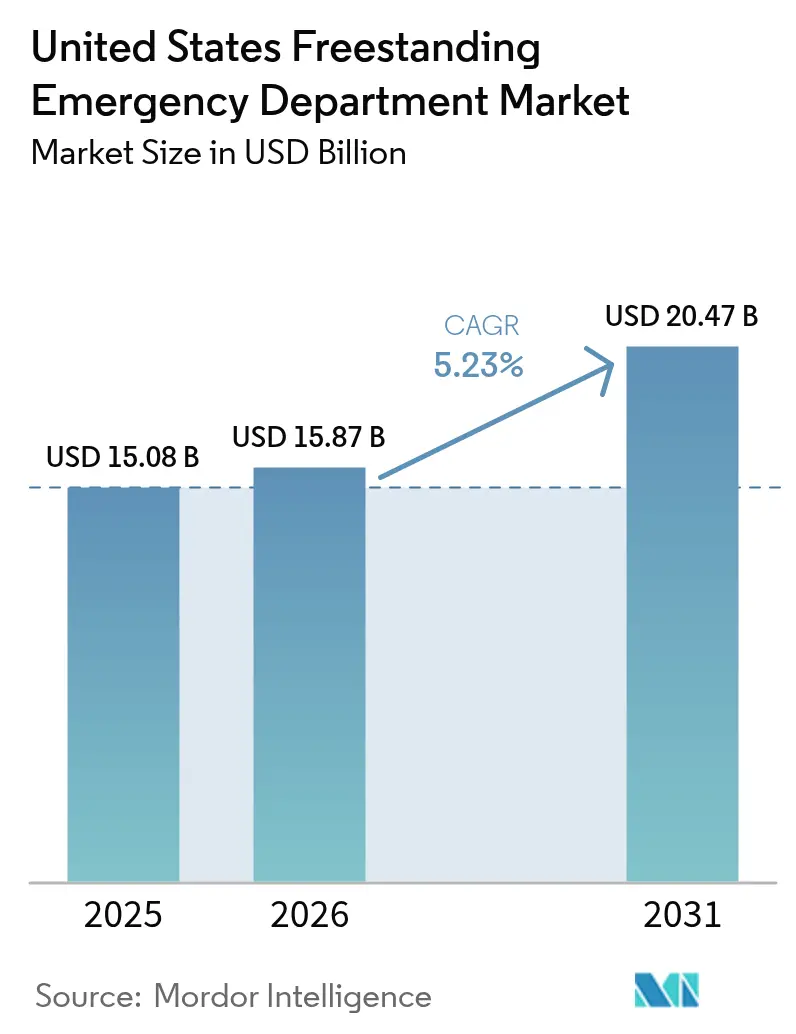
The United States Freestanding Emergency Department Market size was valued at USD 15.08 billion in 2025 and is estimated to grow from USD 15.87 billion in 2026 to reach USD 20.47 billion by 2031, at a CAGR of 5.23% during the forecast period (2026-2031).
This steady expansion reflects a structural shift in how emergency care is delivered, driven by migration into high-growth suburbs, state-level deregulation, and hospital strategies that favor capital-light outpatient footprints. Hospital systems deploy AI-enabled triage tools that shorten door-to-provider times, while independent operators move quickly into rural pockets where critical-access hospitals have closed. Population aging, the spread of high-deductible health plans, and federal New Access Points grants together deepen demand for proximate, lower-wait-time emergency services. Competitive positioning increasingly hinges on the ability to combine diagnostic imaging and laboratory services with emergency medicine staffing in facilities located near busy retail corridors.
Key Report Takeaways
- By ownership type, hospital-affiliated off-campus emergency departments led with 58.02% revenue share in 2025, while independent freestanding emergency departments are projected to expand at a 5.87% CAGR through 2031.
- By service, emergency care and other services accounted for 58.37% of revenue in 2025, and imaging services are forecast to grow at a 6.39% CAGR through 2031.
- By facility size, micro facilities with fewer than 10 beds held a 38.70% share in 2025, while medium-sized facilities with 20 to 29 beds are advancing at a 6.80% CAGR through 2031.
- By U.S. census region, the South accounted for 45.62% of the value in 2025, and the West is projected to grow at a 6.15% CAGR through 2031.
Note: Market size and forecast figures in this report are generated using Mordor Intelligence’s proprietary estimation framework, updated with the latest available data and insights as of 2026.
Market Trends and Insights
Drivers Impact Analysis of United States Freestanding Emergency Department Market*
| DRIVER | (~) % IMPACT ON CAGR FORECAST | GEOGRAPHIC RELEVANCE | IMPACT TIMELINE |
|---|---|---|---|
| Consumer-driven health plans and federal grant programmes | + 0.9% | National, with concentrated gains in rural and underserved areas receiving federal Rural Health Transformation funding | Medium term (2-4 years) |
| Rising demand for convenience-care access | + 1.2% | Suburban corridors across South and West census regions, particularly Texas, Arizona, Colorado metro areas | Short term (≤ 2 years) |
| Expansion of hospital outpatient strategies | + 1.0% | National, led by large health systems deploying off-campus sites | Medium term (2-4 years) |
| Rapid uptake of AI-enabled triage and ambient documentation | + 0.7% | Early adoption in large urban systems, spillover to independent operators in competitive markets | Long term (≥ 4 years) |
| Hybrid ED/urgent-care co-licensing models | + 0.5% | States with flexible licensing frameworks such as Delaware, Tennessee, Colorado | Long term (≥ 4 years) |
| State-level regulatory easing (CON exemptions) | + 0.8% | Tennessee, Colorado, Arizona, and states considering certificate-of-need reform | Medium term (2-4 years) |
| Source: Mordor Intelligence | |||
Consumer-Driven Health Plans and Federal Grant Programmes
Federal grant programs lower capital barriers and address workforce shortages by tying loan repayments to medically underserved areas. The FY 2025 budget doubles community health center financing, positioning freestanding emergency departments as referral anchors that can absorb emergency demand for 37 million Americans.[1] In 2026, federal support plays a pivotal role, highlighted by a USD 204 million grant allocated to New Hampshire under the Rural Health Transformation Program. This funding is part of a broader USD 50 billion national initiative spanning 2026 to 2030 aimed at enhancing access to emergency and urgent care in underserved counties. Additional funding is directed toward telehealth infrastructure and advanced practice provider training, ensuring 24/7 coverage in areas with limited on-site emergency physicians. Utilization trends indicate a divide by income: higher earners prioritize time savings despite higher facility fees, while lower-income individuals often delay visits until conditions worsen. Independent operators are strategically expanding into suburban areas, offering services that align with these utilization patterns.
Rising Demand for Convenience-Care Access
Patient surveys show that door-to-provider times under 15 minutes strongly influence facility choice; freestanding emergency departments routinely meet this threshold, whereas hospital EDs average 45 minutes or more.[2] Health-system acquisitions of urgent-care chains illustrate strategic alignment around convenience: HCA Healthcare acquired 41 Texas centers in 2025 to create feeder networks for nearby freestanding EDs. Facilities situated along commuter routes capture after-work traffic and divert non-life-threatening cases from congested hospital campuses. Hybrid facilities that combine urgent-care and emergency licensure allow on-site physicians to direct nearly 70% of visits to lower-acuity billing, improving patient affordability while preserving emergency capabilities.
Expansion of Hospital Outpatient Strategies
Major systems now allocate more than half of their capital budgets to outpatient projects. HCA Healthcare’s USD 6 billion pipeline will add up to 20 outpatient locations per hospital by 2030, with freestanding emergency departments serving as anchors that cross-sell imaging, surgery, and specialty consults. Site-of-care migration could unlock USD 50 billion in value as payers incentivize treatment outside inpatient settings. AI-powered ambient documentation tools embedded in emergency bays reduce clinician charting time by 80%, supporting higher patient throughput. CommonSpirit Health, with a national network spanning 140 hospitals and more than 2,200 care sites across 24 states, continues to emphasize community-based emergency access that reduces main-campus crowding and improves experience metrics linked to reimbursement incentives.
Rapid Uptake of AI-Enabled Triage and Ambient Documentation
AI-enabled triage and ambient documentation tools are shortening throughput times while reducing dependence on in-demand emergency physicians, although rollout is uneven because of malpractice concerns and the need to align with legacy EHR workflows. A 2024 Kaiser Permanente study reported that large language models reached 72% accuracy in emergency department triage, with performance falling in cases involving multiple comorbidities or atypical symptoms, which signals hybrids of clinician oversight and AI augmentation as the practical path in the near term. Ambient documentation solutions that transcribe visits in real time and complete charts are cutting paperwork by 30% to 40%, which frees physician time for additional encounters and improves job satisfaction. Independent operators often adopt these tools faster because they face fewer IT governance layers and can contract directly with vendors, whereas large health systems must align procurement and risk review across many stakeholders.
Restraints Impact Analysis of United States Freestanding Emergency Department Market*
| RESTRAINT | (~) % IMPACT ON CAGR FORECAST | GEOGRAPHIC RELEVANCE | IMPACT TIMELINE |
|---|---|---|---|
| High total cost per visit vs urgent-care alternatives | - 0.8% | National, with acute sensitivity in Midwest and Northeast regions where urgent care density is highest | Short term (≤ 2 years) |
| CMS reimbursement and billing-policy volatility | - 1.1% | National, particularly impacting non-excepted off-campus emergency departments subject to site-neutral payment reductions | Medium term (2-4 years) |
| Price-transparency pressure on facility fees | - 0.6% | National, with enforcement concentrated in states with additional transparency mandates such as Colorado and California | Medium term (2-4 years) |
| Staffing shortages and wage inflation | - 0.9% | National, with severe constraints in rural markets and in states with restrictive scope-of-practice laws for advanced practice providers | Long term (≥ 4 years) |
| Source: Mordor Intelligence | |||
High Total Cost Per Visit Vs Urgent-Care Alternatives
Freestanding emergency departments typically charge facility fees of USD 1,500 to USD 3,000 per visit across acuity levels, compared to USD 100 to USD 200 in urgent care for many low-complexity conditions, raising consumer cost concerns and reputational risk. Commercial payers are responding with prior authorization, network design, and differential cost-sharing to steer avoidable visits to lower-cost sites, thereby narrowing the pool of commercially insured patients willing to absorb higher out-of-pocket costs. High-deductible plan designs amplify this friction because members pay the full facility fee until they reach deductibles, which drives negative reviews when patients later learn their visit was processed as out-of-network. Urgent care chains are countering convenience by expanding late hours, adding on-site diagnostics, and publishing clear prices to compete head-to-head for minor illnesses and injuries.
CMS Reimbursement and Billing-Policy Volatility
The 2025 Hospital Outpatient Prospective Payment System final rule reshapes quality-reporting requirements and prior-authorization thresholds, adding administrative cost layers for independent facilities. Out-of-network status with large commercial plans exposes patients to surprise bills, erodes satisfaction, and triggers reputational risk. Compliance with the No Surprises Act obliges facilities to invest in expanded revenue-cycle teams, tempering EBITDA margins. Independent freestanding emergency departments face a different constraint because they cannot bill facility fees under OPPS unless they convert to hospital outpatient status, which would then bring EMTALA obligations, charity care policies, and, in some states, certificate-of-need oversight. Medicare Advantage carriers are using plan networks and cost-sharing levers to steer enrollees toward urgent care or primary care for lower-acuity conditions, citing higher total costs of care when those cases present to freestanding emergency departments.
*Our forecasts treat driver/restraint impacts as directional, not additive. The impact forecasts reflect baseline growth, mix effects, and variable interactions.
United States Freestanding Emergency Department Market Segment Analysis
By Ownership Type:
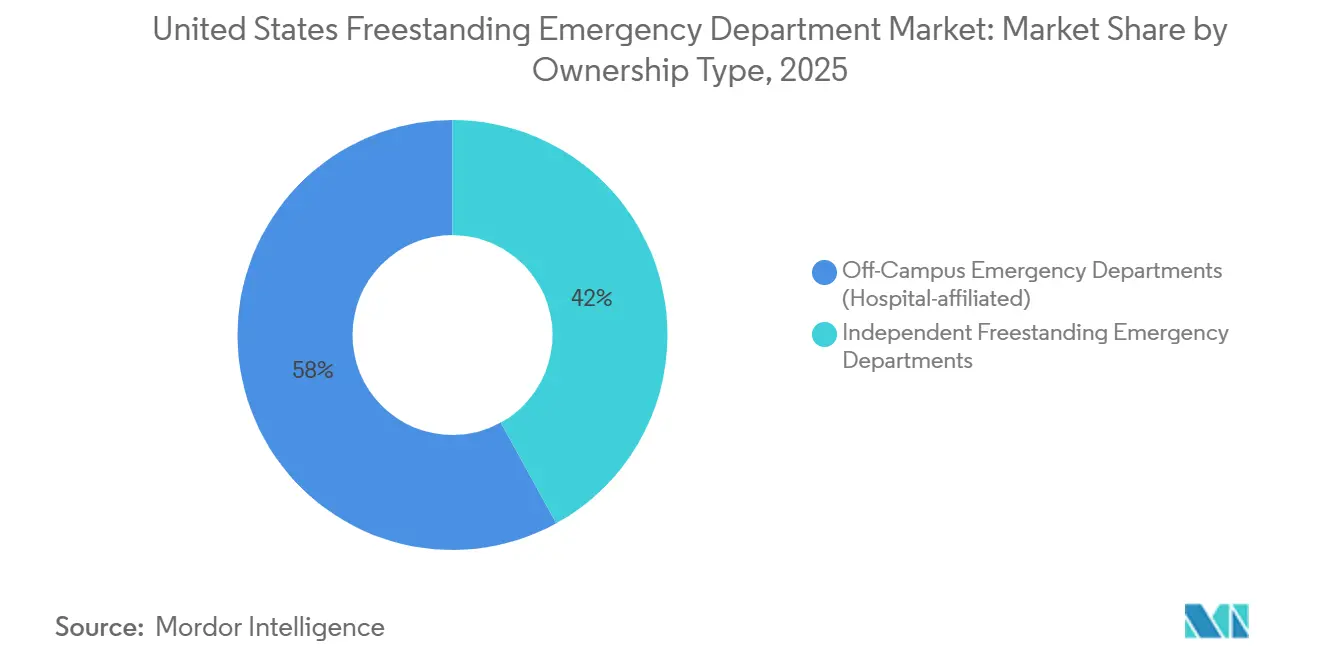
Hospital Networks Defend Share as Independents Exploit Regulatory GapsOff-campus emergency departments held a 58.02% share of the United States freestanding emergency department market in 2025, leveraging integrated electronic health records, favorable Medicare Part B billing, and hospital referral streams. Independent centers, though smaller in aggregate footprint, are projected to outpace at a 5.87% CAGR through 2031 as entrepreneurial groups exploit regulatory gaps in counties underserved by hospitals.
Hospital systems continue to treat off-campus units as strategic beachheads that deter competitors. HCA Florida’s USD 70 million plan to open three new sites across Pasco, Hernando, and Citrus Counties exemplifies an asset-light expansion play that places branded emergency access within 10 miles of growing subdivisions. Independent operators counter by specializing in pediatric trauma or geriatric-friendly environments, differentiating on shorter triage queues and concierge-style amenities.

By Service:
Imaging Revenue Surges as AI Interpretation Compresses Diagnosis TimelinesEmergency care and other services represented 58.37% of the United States freestanding emergency department market size in 2025, underscoring the core use case that drove early adoption. Imaging, however, is forecast to be the fastest-growing line at 6.39% CAGR, buoyed by high-resolution CT and point-of-care ultrasound installations that generate premium reimbursements.
High-throughput diagnostic suites allow physicians to rule out stroke, pulmonary embolism, or appendicitis within 30 minutes, aligning with value-based contracts that penalize avoidable inpatient admissions. Laboratory panels are increasingly automated, cutting stat chemistry turnaround to under 15 minutes and supporting tighter door-to-decision cycles.
By Facility Size:
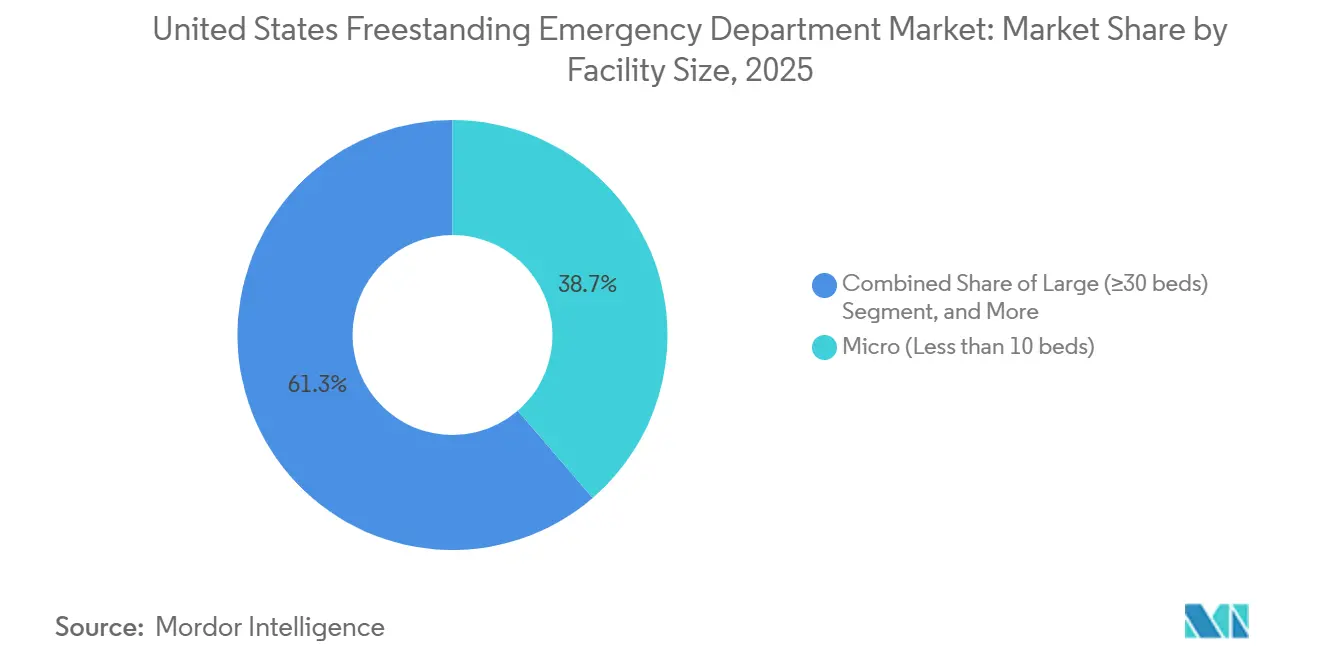
Medium Configurations Gain as Operators Balance Throughput and Capital EfficiencyIn 2025, micro facilities with fewer than 10 beds accounted for 38.70% of the U.S. freestanding emergency department market. Their popularity stems from compact real estate requirements, a lean staffing model of 2 to 3 nurses per shift, and streamlined permitting processes, making them well-suited for retail plazas and strip-mall conversions. Medium-sized facilities with 20 to 29 beds represent the fastest-growing segment, projected to grow at a 6.80% CAGR through 2031. This configuration is increasingly preferred as it effectively balances imaging utilization, laboratory throughput, and the capacity to stabilize higher-acuity patients before transfer. Small facilities, with 10 to 19 beds, remain a practical option in markets with moderate demand and uncertain growth trajectories. In contrast, extensive facilities with 30 or more beds are less common due to their cost structure and regulatory challenges, which resemble those of full-service hospitals without the benefit of a comparable case mix or trauma designation.
Geography Analysis
In 2025, the South census region is projected to hold a significant 45.62% share of the U.S. freestanding emergency department market. This growth is primarily driven by Texas's regulatory framework, which enables the expansion of both hospital-affiliated and independent freestanding emergency departments without requiring certificate-of-need approval. Consequently, cities such as Dallas-Fort Worth, Houston, Austin, and San Antonio are experiencing a high density of these facilities. In 2024, Texas saw a population increase of 473,000 residents, with growth concentrated in suburban counties that prioritize convenient access along major corridors. Florida is also expanding its market presence through strategic hospital system deployments, supported by networks like AdventHealth, which has a strong footprint in Orlando and Tampa. In Tennessee, a 2025 law is accelerating the establishment of satellite emergency departments. These facilities, exempt from certificate-of-need review if located within 10 miles of a parent hospital, are being developed in areas such as Nashville, Memphis, and Knoxville, where several major systems operate.
The West is the fastest-growing region, with a projected CAGR of 6.15% through 2031. This growth is fueled by population inflows into cities like Phoenix, Denver, Las Vegas, and Colorado Springs, while urban hospital emergency departments remain concentrated in downtown areas. Colorado's absence of certificate-of-need requirements for freestanding sites facilitates faster market entry, with timelines ranging from 12 to 18 months from site selection to operational launch under current licensure processes. While Las Vegas, Nevada, is experiencing strong metro growth, the state has been slower to develop freestanding sites than neighboring Western states, leaving opportunities for independent entrants in certain areas. In contrast, Midwestern and Northeastern states face challenges due to higher urgent care density and stricter certificate-of-need regulations. These factors extend development timelines and limit the supply of new facilities relative to demand growth. Additionally, several Northeastern metropolitan areas encounter high real estate costs, which reduce the profitability of freestanding emergency facilities compared to outpatient alternatives.
Regulatory Landscape
Freestanding emergency departments (FSEDs) in the United States operate under a fragmented, state-led licensure structure that sets requirements for facility standards, staffing, and consumer disclosures. Texas Health and Human Services oversees Freestanding Emergency Medical Care Facilities (under 26 Texas Administrative Code Chapter 509), Delaware applies rules under 16 Delaware Administrative Code Section 3340, and Rhode Island uses 216-RICR-40-10-9, which translates into differences in market-entry timelines and operating models across states.
Federal policy mainly shapes reimbursement and billing compliance rather than licensure. CMS rules around provider-based status and hospital Conditions of Participation determine whether off-campus emergency departments can bill as hospital outpatient departments, and independent freestanding sites often face constrained Medicare participation pathways. In March 2026, the HHS Office of Inspector General reported USD 15.1 million in improper or potentially improper Medicare payments tied to ED procedure codes billed at non-emergency sites of service, which increases scrutiny on site-of-service coding, claims edits, and revenue-cycle controls for operators using ED-level coding across distributed footprints.
Value Chain Analysis
The U.S. freestanding emergency department value chain starts with site selection, licensing, and facility build-out, then moves to clinical staffing, diagnostics enablement, payer contracting, and revenue-cycle execution. On the clinical side, inputs include emergency physicians, advanced practice providers, RNs, radiology technologists, lab personnel, and EMS transfer coordination. Enabling services span imaging (CT, X-ray, ultrasound), point-of-care and stat laboratory workflows, EHR connectivity, and increasingly AI-assisted triage and ambient documentation to improve throughput.
Hospital-affiliated off-campus emergency departments tend to leverage system assets such as EHR integration, referral networks, and centralized procurement. Independent operators depend more on vendor contracting and local provider groups to stand up 24/7 coverage. Downstream, reimbursement mechanics and compliance requirements shape the chain, with hospital-affiliated sites able to access hospital outpatient billing when provider-based status and Conditions of Participation are met, while independent facilities rely on state licensure, commercial payer network terms, and compliance with federal protections such as the No Surprises Act, which constrains out-of-network billing leverage and increases administrative complexity. Across the chain, key bottlenecks and cost drivers include staffing scarcity and wage inflation, payer steerage toward lower-cost urgent care for low-acuity cases, and tighter billing scrutiny tied to correct site-of-service and procedure-code use.
Competitive Landscape
In the fragmented U.S. freestanding emergency department market, no single operator commands more than a 15% national share. This is largely due to varying state licensing regimes and certificate-of-need exemptions, which create local entry conditions that favor regional growth over national consolidation. HCA Healthcare, with its extensive network of 186 hospitals and over 2,300 care sites, operates numerous freestanding emergency departments in Florida, Texas, and Tennessee. The company leverages its scale to secure advantageous payer contracts and invests in AI-driven workflows to optimize operational efficiency. Tenet Healthcare, managing 60 hospitals and 570 outpatient centers, focuses on suburban areas where off-campus emergency departments can attract commercially insured patients before they turn to independent competitors.
Western states, particularly Nevada, Idaho, and Utah, offer significant growth opportunities as suburban expansion has outpaced hospital-led freestanding deployments. Additionally, rural markets are benefiting from federal grants and state partnerships aimed at stabilizing 24/7 coverage. Technology adoption is becoming a critical differentiator, with operators integrating AI-assisted radiology interpretations and ambient documentation to reduce labor pressures and enhance patient experiences. However, challenges such as integration complexities with legacy EHRs and inconsistencies in malpractice policies are slowing the uniform implementation of these technologies across larger systems.
United States Freestanding Emergency Department Industry Leaders
-
CHRISTUS Health
-
Ascension
-
Emerus Hospital Partners, LLC.
-
Universal Health Services, Inc.
-
HCA Healthcare
- *Disclaimer: Major Players sorted in no particular order
United States Freestanding Emergency Department Market Companies Covered in this Report
- Adeptus Health LLC
- AdventHealth
- Ardent Health Services
- Ascension Health
- Baylor Scott & White Health
- CHRISTUS Health
- CommonSpirit Health
- Community Health Systems, Inc. (CHS)
- Emerus Hospital Partners, LLC
- Envision Healthcare
- HCA Healthcare, Inc.
- Intuitive Health
- LifePoint Health, Inc.
- Northwell Health Inc.
- SignatureCare Emergency Center
- Sutter Health
- Team Health Holdings, Inc.
- Tenet Healthcare
- Universal Health Services
- US Acute Care Solutions
Read Analysis of United States Freestanding Emergency Department Companies
Market Opportunities and Future Outlook
White-space remains most visible in fast-growing suburban and exurban corridors where distributed emergency access can be deployed faster than a new hospital campus, and where hospital systems use off-campus emergency departments as network anchors for imaging, labs, and downstream referrals. The South and West continue to show room for additional sites due to population inflows into metros such as Phoenix and Denver and because several states allow freestanding entry without certificate-of-need requirements, shortening development and licensure cycles versus more restrictive regions.
Opportunities also sit at the intersection of regulation-driven compliance needs and operational technology adoption. The March 2026 HHS OIG findings on improper ED-code billing at non-emergency sites point to active demand for stronger coding governance, documentation, and claims-edit tooling that reduces reimbursement leakage and audit exposure across multi-site footprints. Health systems also continue to pursue new freestanding capacity in CON states through formal applications, as reflected by Duke Healths June 2026 certificate-of-need filings in North Carolina to add a new freestanding ED alongside a broader expansion program, indicating that FSEDs are being used as targeted access points even where regulatory pathways remain structured.
Recent Industry Developments in United States Freestanding Emergency Department Market
- May 2026: Universal Health Services (UHS) was reported to be shifting development control of a new emergency department project in Washington, D.C., Ward 7 to GW Hospital. The move clarifies project sponsorship and governance for a new access point in an underserved area, shaping how operators structure partnerships and manage regulatory and community stakeholder engagement for freestanding or satellite emergency capacity.
- January 2026: Emerus announced a milestone of five million patients cared for across its network of neighborhood hospitals. The scale marker reinforces the role of specialized developers and operators in expanding distributed emergency access and supports continued joint-venture and partner-led deployment models for systems seeking capital-light growth.
- November 2024: Universal Health Services opened two nearly identical freestanding emergency departments in Bradenton, Florida, and Pharr, Texas, using a modular, standardized construction approach. Replicable facility design and faster build cycles lower deployment friction for multi-site programs and increase competitive pressure in high-growth suburban corridors where speed to open influences patient capture and referral patterns.
United States Freestanding Emergency Department Market Report Scope and Research Methodology
Market Definition and Coverage
This market is defined as the revenue generated by freestanding emergency departments (off campus emergency care sites) operating in the United States, covering the emergency visit and the related diagnostics and supporting services delivered inside these facilities.
Scope exclusions: Hospital-based emergency departments on a hospital campus, urgent care clinics that do not bill as emergency departments, and standalone imaging or lab centers are excluded.
Segments Covered in This Report
- By Ownership Type
- Off-Campus Emergency Departments (Hospital-affiliated)
- Independent Freestanding Emergency Departments
- By Service
- Emergency Care & Other Services
- Imaging Services
- Laboratory Services
- By Facility Size (Bed Count)
- Micro (<10 beds)
- Small (10-19 beds)
- Medium (20-29 beds)
- Large (>30 beds)
- By U.S. Census Region
- Northeast
- Midwest
- South
- West
Data Sources, Market Sizing, and Validation
Desk Research
Desk work was used to map the operating footprint of freestanding emergency departments and to set reasonable ranges for volumes and pricing. Public sources such as the Centers for Medicare and Medicaid Services datasets (including fee schedules and utilization files), U.S. Census regional population series, and Bureau of Labor Statistics wage inflation indicators helped anchor the demand pool and the operating cost backdrop. We also reviewed state health department licensing and facility listings (where available) and policy guidance from emergency medicine associations, along with peer reviewed papers on ED utilization and crowding.
On the commercial side, we relied on paid subscriptions for company financials and intelligence, plus a broad news and financials database to track openings, closures, affiliations, and material regulatory events. These inputs were then supplemented with provider press releases, investor decks, and local-market reporting to reduce gaps by state and metro area. The desk research sources listed here are not exhaustive, and other public references were also reviewed for data collection, validation, and clarification.
Primary Interviews and Surveys
Primary calls and short surveys were used to validate how revenue is recognized at the facility level and what mix of services is typical across hospital-affiliated and independent sites. We spoke with operators, billing and revenue-cycle leaders, clinical administrators, and local-market experts across major U.S. regions, then used their inputs to sanity-check visit volumes, payer mix impacts, and the practical split between professional and facility billing.
Distribution of primary research fieldwork respondents
| Company type | Respondent position |
|---|---|
| Top tier: 32% | CXOs: 13% |
| Mid tier: 46% | Functional/Unit leaders: 40% |
| Smaller Players: 22% | Managers: 47% |
Market-Sizing & Forecasting
The core market model was built using a top-down approach in which U.S. emergency care spend was reallocated into a freestanding ED demand pool, using facility counts, typical annual visit volumes, and a revenue-per-visit range that reflects the emergency evaluation plus in-house diagnostics. To keep the outputs grounded, we then ran selective bottom-up approximations, including sampled site roll-ups by ownership type and quick ASP x volume checks based on regional channel conversations.
A few inputs mattered most for realism, even when perfect data was not available. These included the number of operating freestanding ED sites by state, average visits per site per year, shifts in patient acuity mix that change imaging and lab attach rates, and payer mix differences that affect net revenue per encounter. We also tracked hospital affiliation trends and new site announcements because they influence capacity and utilization in a visible way over time.
For forecasting, scenario analysis was used, linking growth to a small set of drivers that interviewees could confirm. The main drivers were expected site additions, utilization normalization in mature markets, and revenue per visit progression that reflects inflation and reimbursement pressure. Where bottom-up checks were incomplete for smaller geographies, we filled gaps using region-level averages adjusted for population density and local provider concentration, then re-reviewed the approach during validation.
Data Validation & Update Cycle
Outputs were triangulated by comparing the modeled revenue pool against independent signals such as implied visits per site, the expected regional split, and whether revenue-per-visit stayed within interview-backed bounds. When a state or region showed an unusual jump, the assumptions were re-opened, and we rechecked site counts, re-tested utilization ranges, or re-contacted sources to confirm whether closures, new openings, or other changes had occurred.
Before sign-off, the model and its assumptions go through multi-step internal reviews, including checks for year-on-year continuity and unit consistency. The report is refreshed annually, and interim updates are made when material events affect the demand pool or billing environment. Right before delivery, we conduct a final pass so the most current view is reflected in the output.
Mordor Intelligence's US Freestanding Emergency Department Market Size Compared With Other Published Estimates
Published numbers for the US freestanding emergency department market can appear far apart, even when they claim to describe the same scope. In practice, gaps usually come from what is counted as a freestanding ED encounter, how facility versus professional components are treated, and whether the estimate relies more on facility counts or on broader emergency care spending proxies.
Another common driver is how revenue-per-visit is constructed, where some estimates use a single national average and others differentiate by ownership type, service mix, and regional reimbursement patterns. Base year selection, currency timing, and refresh cadence also matter, especially in a market where openings and affiliations can change local capacity quickly. By keeping the scope focused on off-campus freestanding emergency departments and tying totals to site counts, visit volumes, and validated revenue-per-visit ranges, the spread across sources is reduced in the approach applied by Mordor Intelligence.
Benchmark comparison
| Source | Market Size | Gaps in Research Methodology |
|---|---|---|
| Mordor Intelligence | USD 15.08 B (2025) | |
| Global Consultancy A | USD 17.51 B (2025) | Uses a higher projected 2025 value and appears to apply a broader revenue-per-visit assumption with limited visibility on net reimbursement adjustments by ownership type. |
| Industry Publisher B | USD 6.56 B (2025) | Likely applies a narrower revenue scope (for example, counting only selected facility components or excluding parts of diagnostics and supporting services), which compresses the revenue pool even if site counts are similar. |
The comparison shows that most of the difference is explained by scope and pricing logic, not disagreement on whether the market is growing. When site footprint, visit throughput, and realistic net revenue per encounter are used together, the final number remains traceable to clear variables and can be updated as new facilities open or reimbursement shifts.
Key Questions Answered in the Report
What is the current size and 2031 outlook for the United States freestanding emergency department market?
The market is USD 15.87 billion in 2026 and is projected to reach USD 20.47 billion by 2031 at a 5.23% CAGR.
Which service line is growing fastest in the United States freestanding emergency department space?
Imaging services are the fastest-growing, advancing at a 6.39% CAGR through 2031 as AI interpretation and point-of-care ultrasound compress diagnosis times.
How are regulations shaping independent growth in the United States freestanding emergency department ecosystem?
States such as Texas and Colorado permit freestanding sites without certificate-of-need approvals, while CMS site-neutral rules and No Surprises Act constraints shape billing and margins.
Which regions are leading and accelerating within the United States freestanding emergency department landscape?
The South holds 45.62% share led by Texas, and the West is the fastest-growing at a 6.15% CAGR driven by suburban migration into metros such as Phoenix and Denver.
How is AI changing throughput and documentation in United States freestanding emergency departments?
Large language models have shown 72% triage accuracy in one 2024 study, and ambient documentation tools are reducing charting time by 30% to 40%, which increases clinician capacity.
What are the primary margin risks for United States freestanding emergency department operators?
Site-neutral payment cuts for non-excepted off-campus sites, price-transparency enforcement on facility fees, and payer steerage toward urgent care increase revenue pressure, especially where urgent care density is high.