
Market Overview
| Study Period | 2021 - 2031 |
|---|---|
| Forecast Data Period | 2026 - 2031 |
| Base Year Market Size (2025) | USD 1.82 Billion |
| Market Size (2026) | USD 1.9 Billion |
| Market Size (2031) | USD 2.45 Billion |
| Growth Rate (2026 - 2031) | 5.22 % |
| Market Concentration | Medium |
Major Players *Disclaimer: Major Players sorted in no particular order Image © Mordor Intelligence. Reuse requires attribution under CC BY 4.0. | |
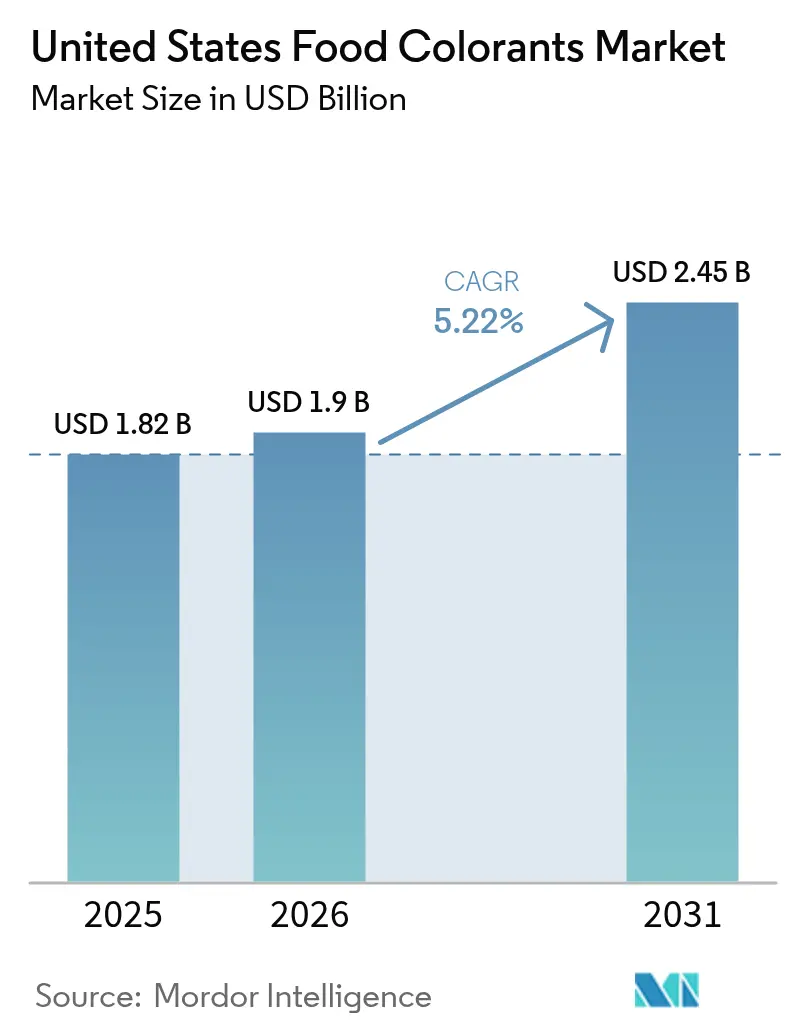
United States Food Colorants Market Analysis by Mordor Intelligence
The United States food colorants market size is projected to be USD 1.82 billion in 2025, USD 1.9 billion in 2026, and reach USD 2.45 billion by 2031, growing at a CAGR of 5.22% from 2026 to 2031.Strong retail demand for clean-label products, retailer reformulation requirements, and regulatory clarity regarding plant-derived pigments are driving growth in the United States food colorant market. Natural colorants currently dominate the ingredient landscape, with their increasing application in yogurt, plant-based meat, and functional beverages compensating for the gradual decline in the use of synthetic dyes. Investments in precision-fermentation platforms are helping to reduce historical cost disparities, while advancements in microencapsulation technology are improving pigment shelf life and light stability, particularly in transparent polyethylene terephthalate (PET) bottles. However, supply chain fragmentation for botanicals such as butterfly pea and safflower is causing price volatility, which limits short-term margin growth. Competitive intensity remains moderate, as leading suppliers focus on application-specific innovations to maintain market share against emerging botanical extractors and fermentation-based start-ups.
Key Report Takeaways
- By product type, natural colors held 77.50% of the United States food colorants market share in 2025 and are forecast to grow at 5.81% CAGR through 2031.
- By form, liquids controlled 55.01% of the United States food colorants market size in 2025, whereas powders recorded an 7.92% CAGR over the same horizon.
- By color, red dominated with 29.32% revenue contribution in 2025, while blue is set to expand the fastest at 8.58% CAGR to 2031.
- By application, bakery and confectionery represented 25.24% of the United States food colorants market size in 2025; dairy products advance the quickest at 7.61% CAGR through 2031.
Note: Market size and forecast figures in this report are generated using Mordor Intelligence’s proprietary estimation framework, updated with the latest available data and insights as of 2026.
Market Trends and Insights
Drivers Impact Analysis of United States Food Colorants Market*
| Driver | (~) % Impact on CAGR Forecast | Geographic Relevance | Impact Timeline |
|---|---|---|---|
| Rising preference for clean-label and "no artificial colors" claims | +1.2% | National, with strongest uptake in coastal urban markets | Medium term (2-4 years) |
| Loosening or clarification of "no artificial color" labeling rules for naturally derived colorants | +0.8% | National, FDA jurisdiction | Short term (≤ 2 years) |
| Growth of plant-based, vegan, and allergen-free food formats | +1.0% | National, concentrated in metropolitan areas | Medium term (2-4 years) |
| Strong growth of highly processed and convenience-food categories | +0.9% | National, with rural and suburban gains | Long term (≥ 4 years) |
| Demand from the beverage industry for stable, vivid hues | +0.7% | National, led by functional and sports drink segments | Medium term (2-4 years) |
| Advancements in extraction and formulation technologies improving yield and color intensity | +0.6% | National, R&D hubs in Midwest and Northeast | Long term (≥ 4 years) |
| Source: Mordor Intelligence | |||
Rising preference for clean-label and "no artificial colors" claims
Consumer demand for transparency has significantly impacted product offerings in grocery aisles. A recent survey revealed that many shoppers in the United States actively avoid artificial colorants when choosing packaged foods. This trend is particularly prominent among millennial and Generation Z households, who carefully review ingredient labels and favor brands utilizing plant-based sources such as beet juice, turmeric, and spirulina. In response, retailers have allocated more shelf space to clean-label stock-keeping units (SKUs), and major private-label programs now mandate natural colorants for new product development. As a result, synthetic alternatives have been largely excluded from high-demand categories like yogurt, granola bars, and refrigerated dips. Economically, this shift demonstrates a willingness to accept higher ingredient costs to achieve premium positioning and address reformulation risks as regulatory standards tighten. Smaller brands are leveraging this trend by using "no artificial colors" claims to compete with established players, securing distribution in natural-channel retailers and e-commerce platforms where such claims enhance click-through rates and drive repeat purchases. According to the International Food Information Council, in 2024, 26% of respondents in the United States identified "Natural" as the best definition of healthy food, while "NON-GMO" accounted for 14% [1].
Loosening or clarification of "no artificial color" labeling rules for naturally derived colorants
The United States Food and Drug Administration (FDA) issued updated guidance clarifying that colorants derived from fermentation processes using genetically modified microorganisms may qualify as "natural," provided the final product contains no recombinant DNA and the production method resembles traditional fermentation [2]. This regulatory clarification has encouraged investment in precision-fermentation platforms, with several major suppliers announcing pilot-scale production of beta-carotene, lycopene, and anthocyanins. The guidance resolves a long-standing ambiguity that had deterred food manufacturers from adopting fermentation-derived pigments due to concerns over consumer backlash or regulatory challenges. It also creates a level playing field for suppliers who had invested in fermentation technology but lacked the regulatory certainty to commercialize at scale. The framework established by the Food and Drug Administration for evaluating "naturalness" now prioritizes source material and processing methods over molecular structure. This allows botanical extracts processed with enzymes or supercritical carbon dioxide to carry "no artificial color" claims, even when the extraction yield or purity exceeds that of traditional solvent methods. This change is speeding up reformulation timelines, as brands that were previously hesitant to move away from synthetic options now have access to a wider range of compliant, high-performance natural alternatives.
Growth of plant-based, vegan, and allergen-free food formats
The plant-based food market in the United States demonstrated significant growth in retail sales in 2025, marking a notable increase compared to the previous year. According to the Good Food Institute, 59% of U.S. households purchased plant-based foods in 2024 [3]. This growth is encouraging colorant suppliers to address new formulation challenges. Products such as meat analogs, dairy-free cheeses, and egg replacers require colorants that replicate the appearance of animal-derived products, such as the pink hue of salmon or the golden color of cheddar, without using carmine, which is derived from insects and excluded from vegan formulations. While paprika oleoresin and annatto are commonly used as solutions, their performance in high-moisture, high-fat matrices remains inconsistent. As a result, research and development teams are exploring fermentation-derived heme proteins and precision-fermentation pigments that provide both color and functional benefits. Additionally, allergen-free requirements add complexity, as traditional stabilizers like modified food starch or maltodextrin may cause sensitivities. This has led formulators to pair natural colors with clean-label carriers such as tapioca dextrin or rice syrup solids. The convergence of vegan, allergen-free, and clean-label demands is narrowing the pool of suppliers to those with advanced technical expertise and vertically integrated supply chains capable of ensuring traceability to the farm level.
Strong growth of highly processed and convenience-food categories
Frozen meals, microwaveable entrees, and shelf-stable snacks have significantly expanded their presence in the United States retail market, driven by time-constrained households and the normalization of hybrid work arrangements, which blur traditional meal occasions. These convenience formats present significant technical challenges for colorants, including retort sterilization at high temperatures for extended durations, freeze-thaw cycling, and prolonged ambient shelf life. Carotenoids, such as beta-carotene and annatto, demonstrate better stability under these conditions compared to anthocyanins, which degrade rapidly under heat and oxidative stress, explaining their prevalence in this segment. Microencapsulation is becoming a key solution, with spray-dried or lipid-encapsulated pigments helping to maintain color intensity during processing and storage. However, this technology comes at a cost premium compared to unencapsulated alternatives. The rise in convenience foods is also influencing packaging trends. Single-serve formats and transparent films expose colorants to more light and oxygen per unit volume than bulk packaging, which accelerates degradation. This has prompted suppliers to reformulate with higher initial dosing rates or incorporate light-blocking additives. The growth of this segment is geographically widespread, encompassing urban, suburban, and rural markets. It is also less sensitive to clean-label premiums compared to fresh or refrigerated categories. This has resulted in a bifurcated market where natural and synthetic colorants coexist, with selection driven by application-specific performance requirements.
Restraints Impact Analysis of United States Food Colorants Market*
| Restraint | (~) % Impact on CAGR Forecast | Geographic Relevance | Impact Timeline |
|---|---|---|---|
| Stringent FDA regulations and evolving guidance | -0.5% | National, FDA jurisdiction | Short term (≤ 2 years) |
| Technical challenges in matching brand-iconic synthetic hues | -0.7% | National, acute in beverage and confectionery | Medium term (2-4 years) |
| Sourcing-related sustainability and biodiversity concerns | -0.4% | National, with supply-chain exposure to Latin America and South Asia | Long term (≥ 4 years) |
| Supply-chain fragmentation and multi-tier sourcing for some niche botanicals | -0.3% | National, affecting specialty applications | Medium term (2-4 years) |
| Source: Mordor Intelligence | |||
Stringent FDA regulations and evolving guidance
The United States Food and Drug Administration's Color Additive Petition process requires manufacturers to provide detailed safety data, stability studies, and manufacturing protocols before approving a new natural colorant for food use. This process can take several years and involves significant costs per petition. Such regulatory requirements place a heavier burden on smaller suppliers and novel pigment sources, such as algae-derived astaxanthin or fruit-derived betalains, which lack the long history of safe use that simplifies approval for established colorants like annatto or carotene. The 2025 guidance from the United States Food and Drug Administration on fermentation-derived colorants, while clarifying certain approval pathways, introduced new labeling requirements. These include the disclosure of the microbial host organism and fermentation substrate, raising transparency concerns among brands cautious of consumer skepticism toward biotechnology. Additionally, evolving state-level regulations add further complexity. For example, California's Proposition 65 requires warning labels for colorants containing trace levels of heavy metals or other compounds, even when these levels are far below the safety thresholds set by the United States Food and Drug Administration. This creates a fragmented compliance landscape, increasing formulation and documentation costs. These regulatory challenges slow innovation cycles and discourage investment in novel colorant platforms, particularly for applications with narrow profit margins or uncertain market acceptance.
Technical challenges in matching brand-iconic synthetic hues
Achieving the vivid and consistent color of synthetic dyes remains the most significant technical challenge for adopting natural colorants, especially for brands whose identity relies on a specific shade, such as the electric blue of a sports drink or the bright red of a candy coating. Natural pigments are prone to batch-to-batch variations caused by factors like soil conditions, harvest timing, and post-harvest handling. This necessitates the use of spectrophotometric quality control and adjustments in dosing rates, which can vary significantly between production runs. Heat stability is another critical issue: anthocyanins degrade at high temperatures, limiting their application in baked goods and retorted products, while carotenoids are susceptible to oxidation during extrusion, leading to off-flavors and color fading. The cost of reformulation, including sensory testing, shelf-life studies, and regulatory filings, can be substantial, discouraging mid-sized brands from transitioning unless driven by significant consumer or retailer demand. Some companies are mitigating risks by maintaining dual inventories of synthetic and natural variants, switching between them based on regional regulatory requirements or customer preferences. While this approach adds operational complexity, it provides flexibility in a fragmented global market.
*Our forecasts treat driver/restraint impacts as directional, not additive. The impact forecasts reflect baseline growth, mix effects, and variable interactions.
United States Food Colorants Market Segment Analysis
By Product Type:
Natural Dominance Reflects Clean-Label MomentumNatural colorants accounted for 77.50% of the market share in 2025 and are projected to grow at a compound annual growth rate (CAGR) of 5.81% through 2031. This growth is driven by retailer requirements and consumer concerns regarding synthetic additives. Synthetic colorants, while still utilized in cost-sensitive applications such as hard candy and powdered drink mixes, are experiencing a decline in market share as brands reformulate products in anticipation of potential regulatory restrictions. The United States Food and Drug Administration's 2025 clarification that certain fermentation-derived pigments qualify as "natural" has blurred traditional distinctions, allowing suppliers to develop high-intensity, stable colorants that meet clean-label requirements without compromising performance. This regulatory change has spurred increased investment in precision-fermentation platforms, with at least two major suppliers initiating pilot-scale production of beta-carotene and lycopene in 2025.
Synthetic colorants continue to offer advantages in applications requiring extreme pH stability, high-temperature processing, or vivid neon hues that cannot be achieved with plant-based extracts, such as specific sports drinks and novelty confections. However, their use is increasingly limited to export-oriented products or private-label stock-keeping units (SKUs) targeting cost-conscious consumers. The cost disparity between natural and synthetic colorants has decreased from 300% in 2020 to approximately 150% in 2025, driven by advancements in extraction efficiency and economies of scale in botanical sourcing.

By Form:
Liquid Leads, Powder Gains on Logistics and Shelf LifeLiquid colorants accounted for 55.01% of the market share in 2025, primarily due to their ease of dispersion in aqueous systems such as beverages, sauces, and dairy products, where uniformity and rapid solubility are essential. Beverage manufacturers, in particular, favor liquid formats as they integrate efficiently into continuous-flow production lines and eliminate the dust-handling challenges associated with powders. However, powder colorants are projected to grow at a Compound Annual Growth Rate (CAGR) of 7.92% through 2031, driven by their longer shelf life, lower transportation costs, and suitability for dry-mix applications, including baking mixes, seasoning blends, and instant beverage powders. A kilogram of powder colorant can replace 3 to 5 kilograms of liquid concentrate, reducing packaging waste and logistics costs, which is an important factor for sustainability-focused procurement teams.
Encapsulation technologies are improving the performance of powder colorants by protecting pigments from oxidation and moisture absorption, thereby extending shelf life from 12 months to 24 months under ambient conditions. Spray-drying and freeze-drying are the predominant encapsulation methods, with freeze-drying preserving more of the original pigment intensity but incurring costs that are 40% to 60% higher.
By Color:
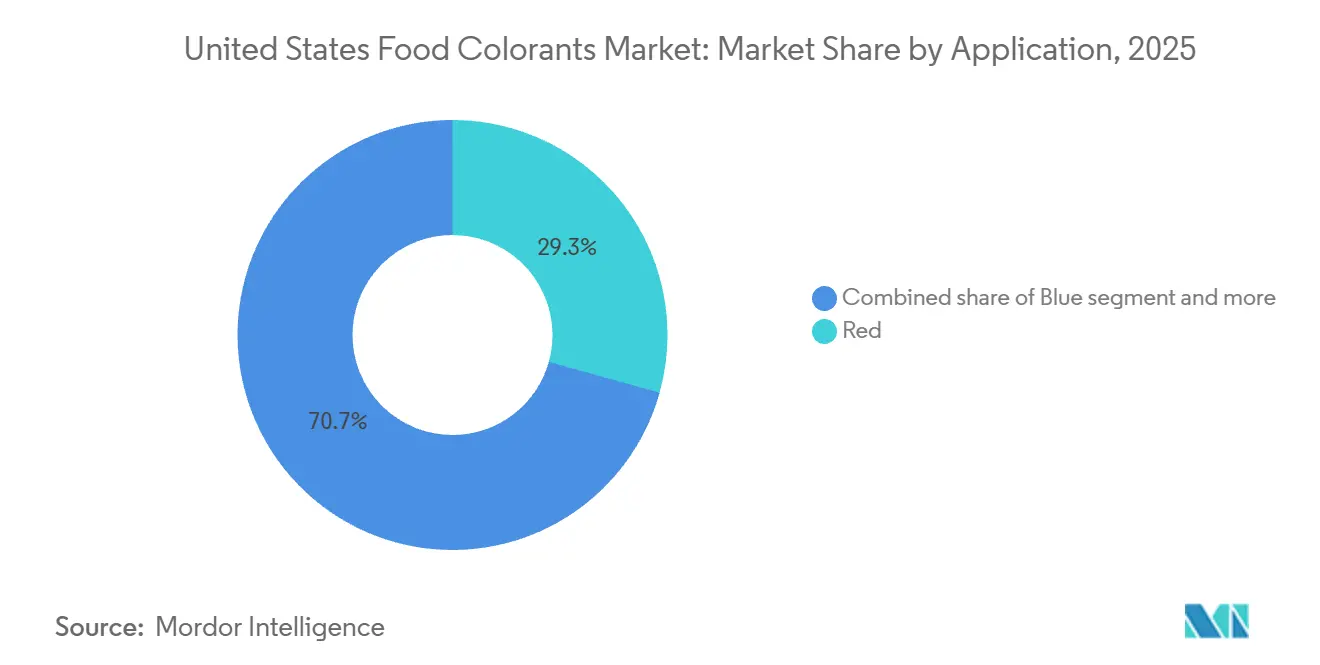
Red Dominates, Blue Surges on Functional Beverage DemandRed colorants accounted for 29.32% of the market share in 2025, driven by carmine, annatto, and beet juice, which are widely used in meat analogs, strawberry-flavored dairy products, and tomato-based sauces. Carmine, derived from cochineal insects, offers exceptional intensity and heat stability but faces challenges due to vegan and allergen-related concerns. This has led suppliers to develop insect-free alternatives, such as lycopene from tomato extract and red radish concentrate.
Blue colorants, although starting from a smaller base, are projected to grow at a compound annual growth rate (CAGR) of 8.58% through 2031. This growth is fueled by spirulina-derived phycocyanin and butterfly-pea extract, which appeal to consumers seeking visually appealing functional beverages and plant-based desserts. However, blue pigments face challenges related to pH sensitivity. For instance, butterfly-pea anthocyanins shift to purple or pink below a pH of 4.0, restricting their use in acidic formulations unless stabilized through methods such as complexation with metal ions or encapsulation. Yellow colorants, primarily turmeric and beta-carotene, are versatile and widely used in applications ranging from cheese and butter to baked goods and snack coatings. They offer good heat stability and are cost-effective. Green colorants, typically created by blending blue spirulina with yellow turmeric or using chlorophyll from alfalfa, are gaining traction in plant-based products designed to replicate the appearance of pesto, matcha, or leafy vegetables. However, chlorophyll is prone to pH-induced color shifts, turning olive or brown in acidic conditions. This has driven research into copper-chlorophyll complexes, although regulatory approval for food use remains limited in the United States.

By Application:
Bakery Leads, Dairy Accelerates on InnovationBakery applications accounted for 25.24% of the market share in 2025, emphasizing the significant role of colorants in enhancing the visual appeal of icings, fillings, and doughs. These colorants are widely used to signal flavor and freshness, which are critical factors in consumer preferences. Heat stability plays a vital role in baking processes, as oven temperatures often exceed 180°C. This makes carotenoids and annatto the preferred choices due to their ability to withstand high temperatures, unlike anthocyanins, which tend to degrade when exposed to prolonged heat.
Dairy-based products are anticipated to grow at a compound annual growth rate (CAGR) of 7.61% through 2031, representing the fastest growth among all application categories. This growth is primarily driven by advancements in yogurt, cheese, and plant-based dairy alternatives, which demand stable and visually appealing colors that can endure refrigeration and high-moisture environments. For instance, Greek yogurt brands are increasingly incorporating fruit preparations colored with natural ingredients such as beet juice and carrot extract. These additions provide consumers with natural visual cues for flavors like strawberry or peach, while also eliminating the need for artificial additives, aligning with the growing demand for clean-label products.
Geography Analysis
The United States is the sole geographic focus of this analysis, with regional dynamics shaped by consumer demographics, regulatory enforcement, and supply chain infrastructure. Coastal urban markets, particularly the Northeast corridor and West Coast metropolitan areas, exhibit the highest penetration of clean-label products. As of 2025, natural colorants hold a majority share in premium grocery channels within these regions. These areas are home to early-adopter consumers who place a high value on product transparency and are willing to pay premium prices for items that are free from artificial additives. This consumer behavior has driven significant growth in the adoption of clean-label products in these regions.
In contrast, the Midwest and Southern states show slower adoption rates, with synthetic colorants continuing to hold a significant share in value-oriented retail formats such as dollar stores and mass merchandisers. However, even these channels are beginning to introduce natural-colorant stock-keeping units (SKUs) as consumer preferences gradually shift toward more natural options. The supply chain infrastructure across the country varies significantly. Extraction and processing facilities are primarily concentrated in the Midwest and Northeast, leveraging their proximity to key agricultural inputs such as corn, beets, and soybeans. California's Central Valley remains a critical sourcing region for turmeric and paprika. However, challenges such as water scarcity and rising labor costs are encouraging some growers to explore alternative regions or transition to less water-intensive crops to ensure sustainability.
Distribution networks are increasingly optimized for just-in-time delivery to meet market demands efficiently. Liquid colorants, which require cold-chain logistics to maintain their stability, add between 8 and 12 percent to landed costs compared to ambient-stable powders. Regulatory enforcement is consistent at the federal level under the jurisdiction of the Food and Drug Administration (FDA). However, state-level initiatives, such as California's Proposition 65 warnings and New York's transparency mandates, are creating a patchwork of compliance requirements. These state-specific regulations favor suppliers who have robust documentation and traceability systems in place, enabling them to meet the varying requirements effectively and maintain compliance across different regions.
Regulatory Landscape
Food colorants in the United States are regulated by the US Food and Drug Administration (FDA) under the Federal Food, Drug, and Cosmetic Act and the Color Additive Amendments of 1960, with oversight administered through the FDA Office of Food Additive Safety. The framework distinguishes between certified colors (FD&C colors) that require batch certification prior to marketing (with controls such as lot identification on labeling) and colors exempt from certification, which are often plant- or fermentation-derived but still must be authorized for intended uses through the Color Additive Petition process (21 CFR Part 71) and must meet identity and purity specifications.
Regulatory actions in 2026 reinforced ongoing transition activity toward naturally derived pigments. In February 2026, the FDA issued final orders amending 21 CFR Part 73 to permit beetroot red in human foods (with exclusions including infant formula and certain products under USDA jurisdiction) and to expand approved uses of spirulina extract at GMP-consistent levels, widening the compliant toolkit for blue and red solutions in mainstream formulations. In parallel, the FDA updated its approach to \"no artificial colors\" claims by allowing more labeling flexibility when petroleum-based colors are absent, which increases the importance of documentation and compliant naming for both domestic and imported products using certified and exempt colorants.
Value Chain Analysis
The US food colorants value chain runs from raw-material sourcing (botanicals such as beet, turmeric, paprika, safflower, butterfly pea, and algae inputs for spirulina) and fermentation feedstocks, through extraction or fermentation production, formulation (stabilization, blending, and microencapsulation), and quality and regulatory compliance activities (specification testing and, for certified colors, FDA batch certification). Finished color systems then move through ingredient distributors and direct supply agreements to food and beverage manufacturers, where application labs and technical service teams support shade matching, processing stability (heat, pH, and light), and shelf-life validation for categories such as dairy, beverages, bakery, and confectionery.
In 2026, the value chain showed clear signs of reconfiguration toward scaled domestic capacity and higher-value formulation services. Sensient Technologies began a USD 250 million expansion of its natural color manufacturing footprint in St. Louis, Missouri, adding specialized production space to support customer conversions from synthetic dyes and improving the availability of standardized natural systems for large manufacturers. Downstream, major branded players accelerated reformulation activity, including Nestle USA completing the removal of FD&C artificial colors from its US portfolio in June 2026, which pulls demand toward suppliers that can provide consistent natural replacements, stability technologies (including encapsulated powders for longer shelf life), and robust traceability. Regulatory dynamics also influence supply continuity, as illustrated by the FDA action expanding spirulina extract uses in February 2026 followed by an indefinite effective-date delay in March 2026, reinforcing the need for dual sourcing strategies and contingency formulations in customer qualification programs.
Competitive Landscape
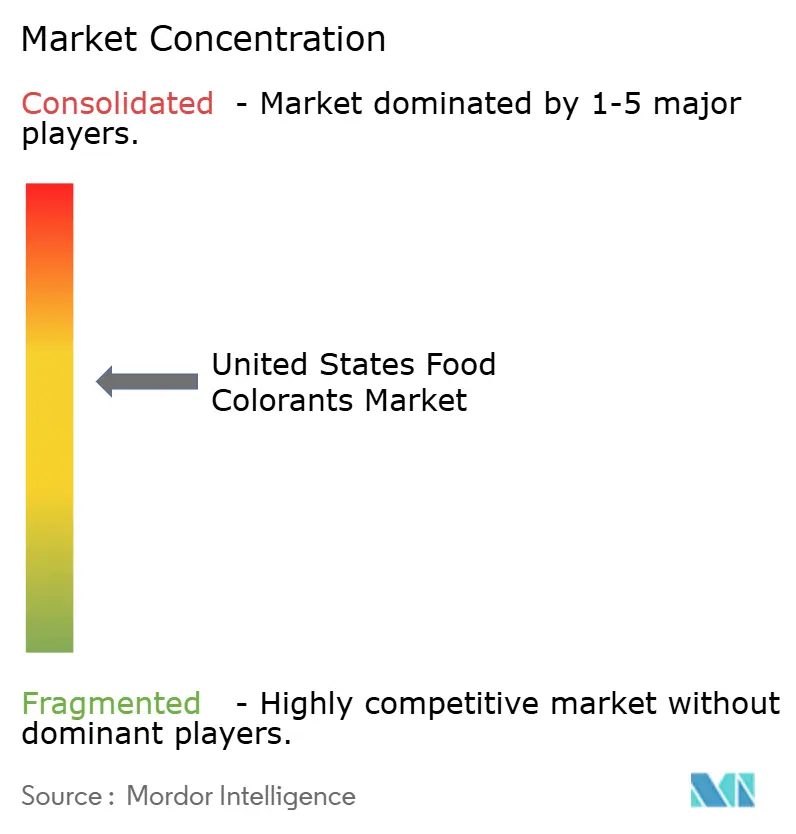
The United States food colorant market exhibits moderate concentration, characterized by a competitive landscape dominated by a few multinational suppliers. These include Sensient Technologies Corporation, BASF SE (Badische Anilin und Soda Fabrik), International Flavors and Fragrances Incorporated, and Archer Daniels Midland Company. These leading companies hold significant market shares through vertically integrated supply chains, global sourcing networks, and extensive technical expertise in formulation and application support. They compete based on the speed of innovation, robust regulatory compliance capabilities, and the ability to co-develop customized solutions with large food manufacturers. This often involves deploying technical service teams at customer sites to address challenges related to color stability, dosing accuracy, and sensory interactions.
Mid-tier suppliers, such as Döhler Group, Oterra, and DSM-Firmenich, differentiate themselves through regional sourcing advantages, specialized botanical portfolios, and quicker time-to-market for emerging pigments like butterfly-pea and purple sweet potato. These companies are gaining traction in high-growth segments, including plant-based foods and functional beverages. Their ability to cater to niche demands and adapt to evolving consumer preferences has allowed them to carve out a significant presence in these expanding markets.
Opportunities are also emerging in the precision-fermentation colorants segment, where both startups and established players are leveraging microbial engineering to produce pigments with enhanced stability, intensity, and sustainability compared to agricultural extracts. For example, a 2025 patent filing by a leading supplier outlined a fermentation process for producing beta-carotene with 95 percent purity and no reliance on agricultural inputs. This innovation positions the technology as a safeguard against climate-induced supply disruptions, offering a more sustainable and reliable alternative to traditional agricultural methods.
United States Food Colorants Industry Leaders
-
Archer Daniels Midland Company
-
BASF SE
-
Sensient Technologies Corporation
-
Givaudan S.A.
-
International Flavors & Fragrances Inc.
- *Disclaimer: Major Players sorted in no particular order
United States Food Colorants Market Companies Covered in this Report
- Sensient Technologies Corporation
- BASF SE
- International Flavors & Fragrances Inc.
- Archer Daniels Midland Company
- Givaudan S.A.
- Döhler Group SE
- Oterra A/S
- DSM-Firmenich AG
- Kalsec Inc.
- GNT Group B.V.
- San-Ei Gen F.F.I., Inc.
- IFC Solutions Inc.
- Flavorchem Corporation
- Proquimac Color, S.L.
- Syngenta Group Co., Ltd.
- Biocon Colors
- Nactarome S.P.A.
- ROHA Dyechem Pvt. Ltd.
- Mane Kancor Ingredients
- ColorKitchen, Inc.
Market Opportunities and Future Outlook
Opportunities in the United States food colorants market are concentrated in natural replacements that can meet brand color targets while complying with evolving labeling and use-authorizations. The FDA action in February 2026 providing greater flexibility for \"no artificial colors\" claims when petroleum-based dyes are absent creates whitespace for suppliers that can offer compliant natural systems with strong documentation and application support, particularly for high-visibility categories such as beverages and dairy where shade consistency and light stability are frequent pain points. Regulatory expansion of permitted uses for pigments such as spirulina extract and the authorization of beetroot red for broader human-food applications also widens the formulation toolbox for suppliers targeting blue and red, the segments most associated with synthetic-to-natural conversion challenges.
Capacity and technology investments provide additional headroom to serve large-scale reformulations. Sensient Technologies launched Project Prism in March 2026 as a USD 250 million investment to expand natural color manufacturing capacity at its St. Louis site, signaling continued scaling of extraction and stabilization infrastructure to supply national brand demand. On the demand side, manufacturers have formalized conversion programs, including Nestle USA completing the removal of FD&C artificial colors from its US portfolio in June 2026, and the FDA has increased visibility by tracking industry pledges to remove petroleum-based food dyes. These actions support near-term commercial opportunities for suppliers that can deliver heat- and pH-stable natural systems (including encapsulated powders for logistics and shelf-life benefits) and for innovators advancing precision-fermentation pigments that fit clean-label positioning under current FDA interpretations of process and final-product composition.
Recent Industry Developments in United States Food Colorants Market
- March 2026: Sensient Technologies commenced Project Prism, a USD 250 million expansion of its natural color manufacturing facility in St. Louis, Missouri. The project adds specialized production capacity within its large site footprint to support customer conversions from synthetic dyes to natural systems. This strengthens domestic supply availability and application-specific manufacturing depth for high-volume US food and beverage reformulations.
- September 2025: ROHA Group acquired Brazilian natural color manufacturer Tebracc to strengthen its natural colors platform and secure annatto-related raw material supply. The transaction expands ROHA's access to upstream agricultural inputs and processing capacity in a key natural-pigment supply region. Greater backward integration supports more stable sourcing for customers facing volatility in botanical supply chains.
- December 2024: BASF SE signed a binding agreement to sell its Food and Health Performance Ingredients business, including the Illertissen production site, to Louis Dreyfus Company (LDC). The divestment reshapes ownership and strategic priorities for part of the food-ingredient supply base tied to performance ingredients. Portfolio shifts of this scale can influence supplier relationships and long-term investment focus across food ingredient segments that interface with colorant formulations.
United States Food Colorants Market Report Scope and Research Methodology
Market Definition and Coverage
This market covers the value of colorant ingredients used to add or restore color in food and beverage products sold in the United States, including natural and synthetic options supplied in common commercial forms.
Scope exclusions: It excludes coloring used in pharmaceuticals, cosmetics, and industrial applications, even if the same pigment chemistry is involved.
Segments Covered in This Report
- By Product Type
- Natural Color
- Synthetic Color
- By Form
- Powder
- Liquid
- By Color
- Blue
- Red
- Green
- Yellow
- Others
- By Application
- Bakery
- Confectionery
- Dairy-based Products
- Meat and Seafood
- Beverage
- Alcoholic Beverages
- Non-Alcoholic Beverages
- Dietary Supplement
- Snacks and Cereals
- Others
Data Sources, Market Sizing, and Validation
Desk Research
Desk research was used to set the industry context and to anchor assumptions that can be checked in public data. We referred to sources such as FDA color additive listings and guidance, USDA food manufacturing and consumption statistics, and USITC trade data for colorant related imports and exports. Supporting signals were also taken from sources such as Bureau of Labor Statistics producer price data, peer reviewed food science journals on pigment stability and usage rates, and association websites that discuss additive regulations and labeling.
Alongside these, company filings, investor presentations, and reputable press were reviewed to understand portfolio mix, pricing direction, and capacity changes that can shift the market. Where needed, paid subscriptions were used only for company financials and intelligence, patents, and shipment level import and export screening to validate supply side moves. The desk sources cited here are illustrative, and many other public and internal references were used for cross checks and clarification during the study.
Primary Interviews and Surveys
Primary work focused on interviews and structured surveys with ingredient suppliers, distributors, food and beverage manufacturers, and formulation specialists who track color usage in products. Since this is a US focused market, discussions were balanced across major consumption hubs and key end use categories, and then used to confirm pricing assumptions, the natural versus synthetic mix, and substitution patterns when reformulations occur.
Distribution of primary research fieldwork respondents
| Company type | Respondent position |
|---|---|
| Top tier: 33% | CXOs: 12% |
| Mid tier: 50% | Functional/Unit leaders: 30% |
| Smaller Players: 17% | Managers: 58% |
Market-Sizing & Forecasting
Sizing starts with a top-down build where food and beverage production and consumption indicators are translated into a demand pool for colorant use, then filtered by the share of products that typically carry added colors. After the first pass is prepared, it is checked with selective bottom-up approximations such as sampled supplier revenues by colorant lines, channel checks with distributors, and a volume times average selling price logic for a few high-usage applications. Totals are then adjusted when checks do not align.
Inputs used in the model include, in an illustrative way, processed food and beverage output trends, labeling driven reformulation activity toward natural colors, average dosage ranges by application type, pricing spreads between natural and synthetic solutions, and the impact of color form (powder versus liquid) on unit economics. Where gaps appear in bottom-up checks for smaller brands and private label activity, we use conservative share assumptions that are later pressure tested in interviews.
Forecasts rely on multivariate regression, where demand is linked to packaged food volume growth, premiumization in categories like beverages and confectionery, and expected substitution rates from synthetic to natural colors. The forward view is refined through scenario analysis so that regulatory and supply volatility, for example crop driven pigment availability, can be reflected without treating one-off events as a long term shift.
Data Validation & Update Cycle
Findings are validated through several rounds of checks so the final number is traceable to clear assumptions. We compare modeled totals with independent signals like trade flows, public pricing trends, and supplier commentary, and then investigate any sharp jumps that do not match what stakeholders describe. If a variance is material, respondents are re-contacted and the input set is reworked before sign-off.
The report is refreshed on an annual cycle, and interim updates are triggered when major events occur, such as regulatory changes, notable capacity additions, or sudden raw material disruptions. Before delivery, an analyst performs a final pass to ensure the latest public releases and key market moves are reflected in the tables and narrative.
Mordor Intelligence's US Food Colorants Market Size Compared Against Other Published Estimates
It is normal to see different market values for US food colorants because publishers do not always count the same product set, they pick different base years, and they apply different price and mix assumptions. Variations also come from whether a study uses shipment oriented supply signals or leans more on end use consumption indicators.
Cosmetic and personal care color additives are a common add-on in some estimates, and this sits outside Mordor Intelligence's scope because only food and beverage use in the United States is counted in our total. In addition, the spread is often driven by how natural colors are priced over time, how fast synthetic to natural substitution is assumed to happen, and whether volumes are validated against trade and manufacturing signals before the forecast is finalized.
Benchmark comparison
| Source | Market Size | Gaps in Research Methodology |
|---|---|---|
| Mordor Intelligence | USD 1.90 B (2026) | |
| Global Consultancy A | USD 2.75 B (2024) | Uses an earlier base year and appears to apply broader inclusion logic, which can pull in adjacent coloring uses and different form factor assumptions, leading to a higher total than a food and beverage only view. |
| Industry Publisher B | USD 0.64 B (2025) | Likely narrows the counted universe to a smaller portion of food colors or a limited set of applications, and its longer range forecast horizon can also amplify growth assumptions without the same near term price and volume cross checks. |
Looking across the three figures, the gap mainly comes from what is included in the demand pool and how pricing and mix shifts are carried forward year to year. By tying the model to observable food and beverage output signals and then validating with supplier and channel feedback, we keep a balanced number that can be replicated and updated as market conditions change.
Key Questions Answered in the Report
How large is the United States food colorant market in 2026?
The United States food colorant market size stands at USD 1.90 billion in 2026 and is on track to reach USD 2.45 billion by 2031.
Which segment grows fastest within United States food colorants?
Blue pigments lead growth at an 8.58% CAGR to 2031, driven by spirulina and butterfly-pea use in functional drinks.
Why are natural colorants gaining share so quickly?
Clean-label consumer demand and FDA guidance that fermentation pigments qualify as natural are shifting formulations away from synthetics despite higher costs.
What drives powder format adoption?
Encapsulation technology now delivers 24-month shelf life and lower freight weight, which fuels a 7.92% CAGR for powder colorants.
Which application will add the most incremental value?
Dairy-based products show the fastest 7.61% CAGR as yogurt and cheese lines seek vibrant stable hues for refrigerated displays.