
United States Continuous Glucose Monitoring Market Size and Share
Market Overview
| Study Period | 2020 - 2031 |
|---|---|
| Forecast Data Period | 2026 - 2031 |
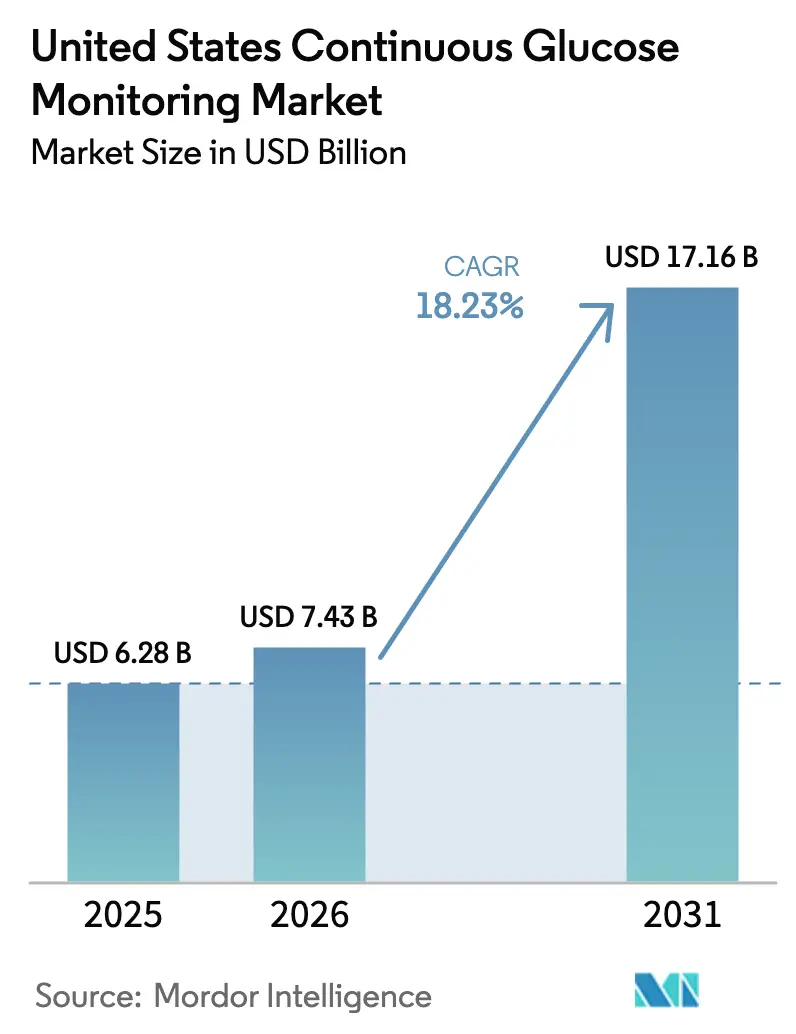
| Base Year Market Size (2025) | USD 6.28 Billion |
| Market Size (2026) | USD 7.43 Billion |
| Market Size (2031) | USD 17.16 Billion |
| Growth Rate (2026 - 2031) | 18.23 % |
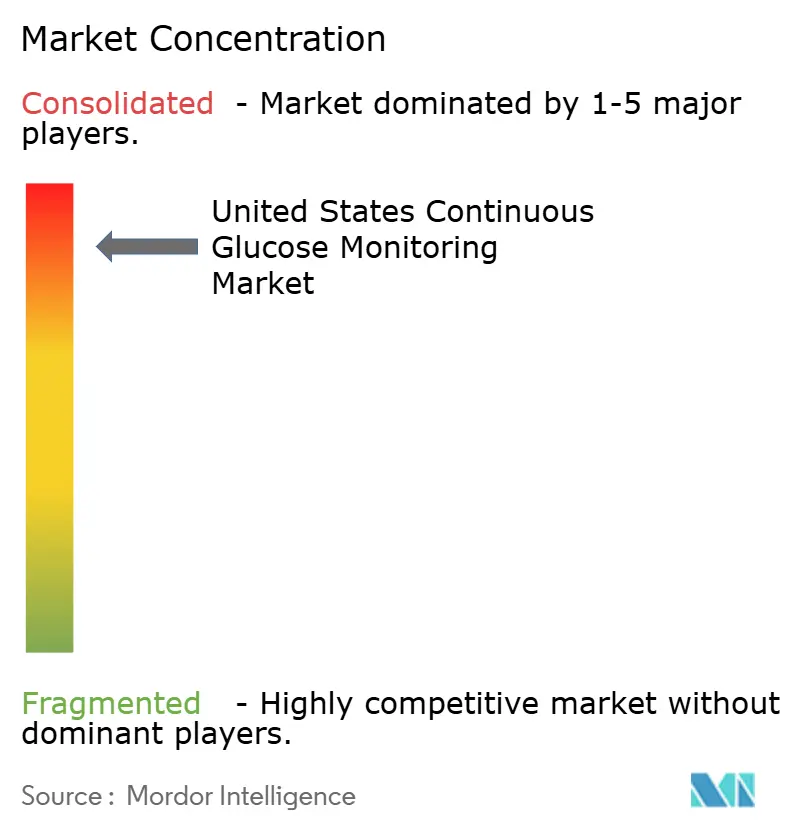
| Market Concentration | High |
Major Players *Disclaimer: Major Players sorted in no particular order Image © Mordor Intelligence. Reuse requires attribution under CC BY 4.0. | |
United States Continuous Glucose Monitoring Market Analysis by Mordor Intelligence
The continuous glucose monitoring market size in 2026 is estimated at USD 7.43 billion, growing from 2025 value of USD 6.28 billion with 2031 projections showing USD 17.16 billion, growing at 18.23% CAGR over 2026-2031. The growth reflects expanded Medicare coverage for Type-2 basal-only patients, accelerating over-the-counter approvals, and steady sensor price erosion below USD 100 per 14-day wear period. Market momentum also comes from earlier diabetes diagnoses, hospital cost-saving pilots, and AI-enabled insulin dosing algorithms that embed CGM into routine clinical pathways. Alongside these medical drivers, wellness applications that let non-diabetic consumers track daily glucose trends continue to broaden the continuous glucose monitoring market beyond its historical insulin-dependent core.
Key Report Takeaways
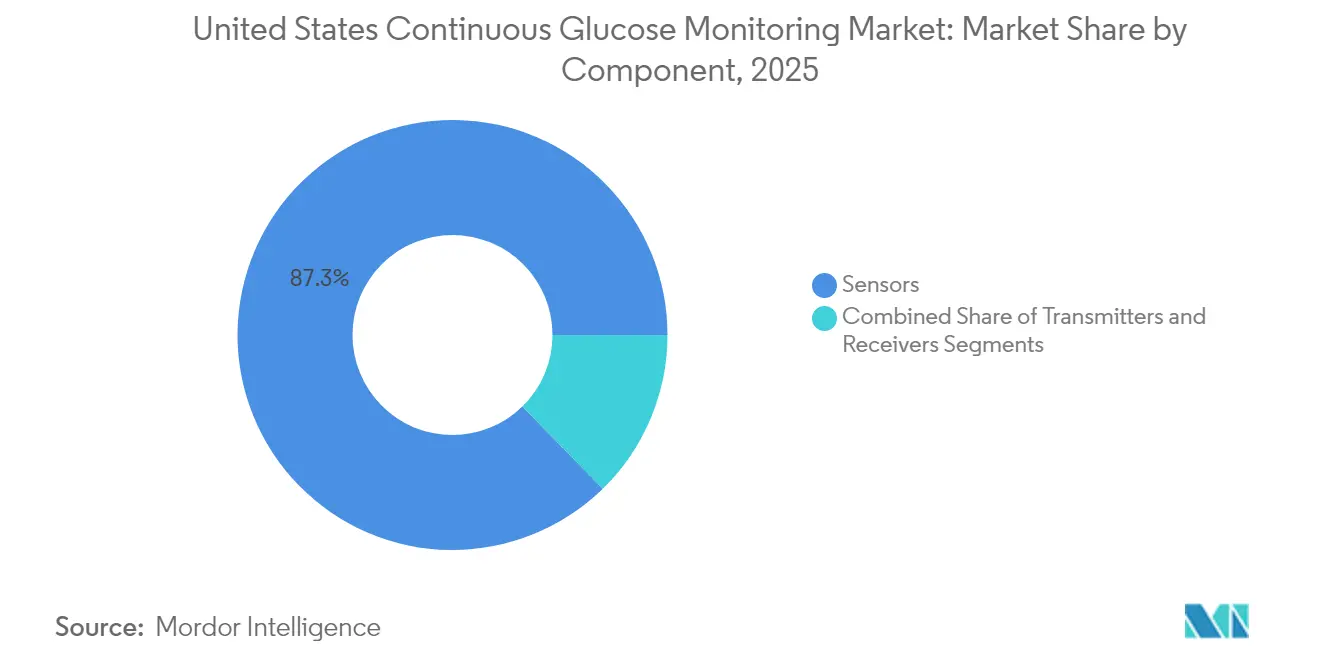
- By component, sensors held an 87.32% share of the continuous glucose monitoring market in 2025, while durable components recorded the fastest 19.35% CAGR between 2026 and 2031.
- By end user, home and personal use captured 67.10% of the continuous glucose monitoring market share in 2025; hospital and clinical settings are expanding at the leading 19.01% CAGR through 2031.
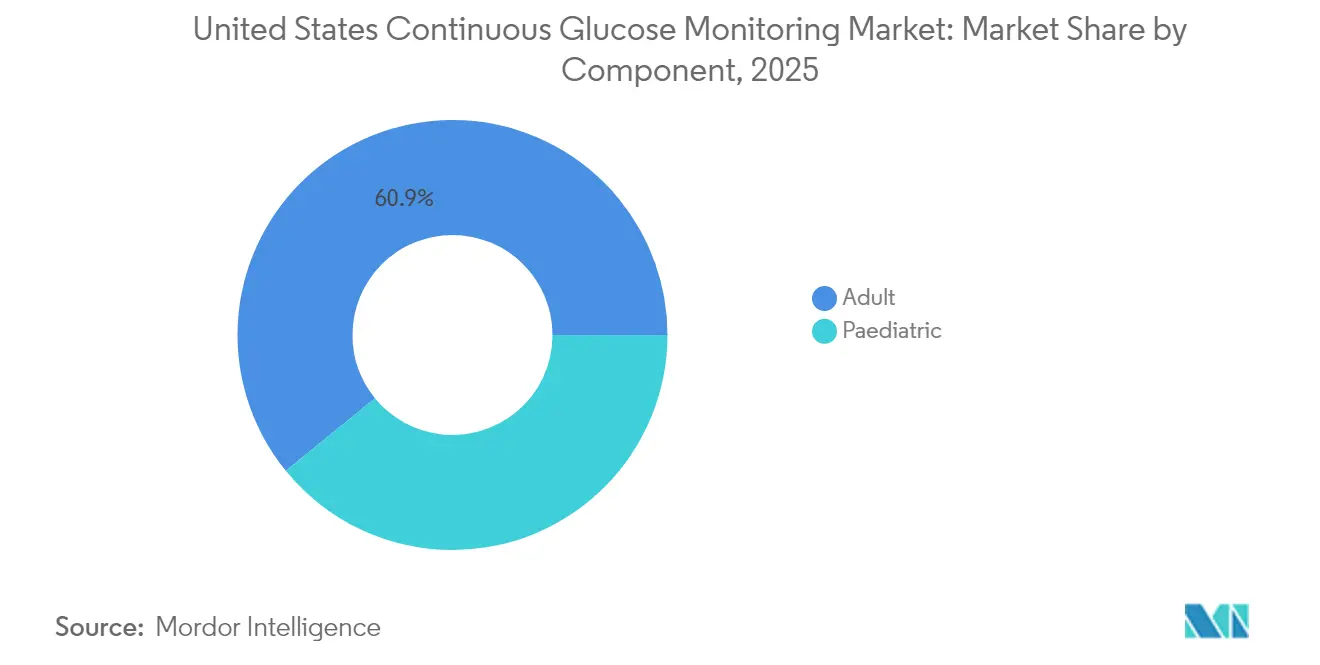
- By demography, adults accounted for 60.88% of the continuous glucose monitoring market size in 2025, whereas the pediatric segment posts the highest 19.12% CAGR during the forecast window.
Note: Market size and forecast figures in this report are generated using Mordor Intelligence’s proprietary estimation framework, updated with the latest available data and insights as of 2026.
United States Continuous Glucose Monitoring Market Trends and Insights
Drivers Impact Analysis*
| Driver | (~) % Impact on CAGR Forecast | Geographic Relevance | Impact Timeline |
|---|---|---|---|
| Rising Diabetes Prevalence and Earlier Diagnoses | +4.2% | National, highest in Southern and Midwest states | Long term (≥ 4 years) |
| Medicare/Medicaid Expansion For Type-2 Basal-Only Patients | +3.8% | National with state-level Medicaid variation | Medium term (2-4 years) |
| Price Erosion Of Sensors Below USD 60 Per 14-Day Wear Period | +2.9% | National, fastest in competitive metro areas | Short term (≤ 2 years) |
| Shift To OTC Wellness CGMs (Stelo, Lingo) Expands Addressable Base | +3.1% | National, early uptake in urban/suburban zones | Medium term (2-4 years) |
| AI-Driven Dosing Algorithms Boost Clinical Outcomes and Adoption | +2.4% | National, led by integrated health systems | Long term (≥ 4 years) |
| Hospital Ward Pilots Proving Cost-Savings Over POC Testing | +1.7% | National, concentrated in large hospital systems | Short term (≤ 2 years) |
| Source: Mordor Intelligence | |||
Rising Diabetes Prevalence and Earlier Diagnoses
CDC surveillance shows adult diabetes prevalence rising from 9.7% in 1999-2000 to 15.8% in 2021-2023, translating to 38.4 million Americans who potentially benefit from continuous glucose monitoring market solutions. Younger adults are being screened sooner, which pushes CGM adoption earlier in the disease course. Payers increasingly view CGM as a frontline therapy that prevents severe hypoglycemia and costly hospitalizations, making reimbursement justification easier. Providers treat CGM as a foundational self-management tool rather than an advanced add-on, a perception shift that enlarges the addressable base. As a result, the continuous glucose monitoring market gains sustained volume tailwinds from both Type-1 and Type-2 cohorts, whose treatment plans now anchor around real-time data feedback.
Medicare/Medicaid Expansion for Type-2 Basal-Only Patients
In April 2023, CMS broadened coverage to include Type-2 patients using basal insulin only, opening CGM eligibility to an extra 1.5 million beneficiaries. Adoption momentum varies by state Medicaid policy, yet progressive states already report higher authorization rates that speed volume uptake. The policy decision rests on evidence that CGM reduces emergency visits and inpatient costs, benefits that resonate with value-based care contracts. Pharmacy benefit pathways continue to evolve, so manufacturers are expanding distribution channels and patient support programs to navigate differing durable-equipment billing rules. The net effect is a medium-term surge in unit sales as both public and commercial payers harmonize benefit designs.
Sensor Price Erosion Below USD 60 per 14-Day Wear Period
Dexcom’s Stelo debut at USD 89-99 and Abbott’s similar OTC strategies indicate a broader slide toward sub-USD 60 sensor pricing over the next two years. Manufacturing automation, longer wear times, and simplified calibration have trimmed unit costs, allowing lower retail prices without eroding gross margins as steeply as feared. Affordable cash-pay options widen access for under-insured patients who previously rationed self-monitoring supplies. As prices fall, manufacturers pivot toward volume-based recurring revenue, favoring firms that already produce more than 10 million sensors annually. These economics could raise the entry barrier for smaller challengers, thereby reinforcing the high-volume leadership positions inside the continuous glucose monitoring market.
Shift to OTC Wellness CGMs Expands Addressable Base
The FDA cleared Dexcom’s Stelo as the first over-the-counter CGM in March 2024[1]. Without prescription hurdles, marketing now targets health-conscious consumers who seek metabolic insight rather than strict diabetes control. Usage patterns differ; wellness buyers may use CGMs episodically alongside diet or fitness regimens, setting up demand spikes around seasonal initiatives like New Year resolutions. To cultivate recurring revenue, vendors bundle data analytics and lifestyle coaching subscriptions that deepen engagement beyond sensor hardware. Success in this arena could double the continuous glucose monitoring market’s reachable population by 2030.
Restraints Impact Analysis*
| Restraint | (~) % Impact on CAGR Forecast | Geographic Relevance | Impact Timeline |
|---|---|---|---|
| GLP-1–Induced Glucose Normalization Reduces CGM Starts | -2.8% | National, strongest where GLP-1 use is high | Medium term (2-4 years) |
| Patch-Pump/CGM Bundles Limit Stand-Alone Sensor Sales | -1.9% | National, led by integrated tech adoption | Long term (≥ 4 years) |
| Data-Overload Fatigue Among Non-Insulin Users | -1.3% | National | Short term (≤ 2 years) |
| Uneven State-Level Medicaid Coverage Creates Access Gaps | -1.1% | National | Short term (≤ 2 years) |
| Source: Mordor Intelligence | |||
GLP-1 Induced Glucose Normalization Reduces CGM Starts
Rapid uptake of GLP-1 receptor agonists such as semaglutide brings many patients to normalized HbA1c levels, lowering perceived need for continuous monitoring. Studies show approximately 46% of non-diabetic users discontinue GLP-1 within a year, causing unpredictable sensor demand[2]. Early discontinuation produces gaps in monitoring continuity, making it difficult for providers to justify CGM prescriptions. Nonetheless, emerging evidence supports CGM use during dose titration and to catch hypoglycemia in aggressively treated cohorts. Manufacturers now educate clinicians on complementary roles for CGM even when pharmacotherapy remains effective, which may soften this negative impact over time.
Patch-Pump and CGM Bundles Limit Stand-Alone Sensor Sales
Automated insulin delivery systems increasingly bundle proprietary sensors with pumps, locking users into specific ecosystems. Tandem’s Control-IQ platform requires Dexcom G6 sensors, and Abbott has exclusive supply deals with several pump makers. These arrangements create predictable high-margin revenue for participants yet reduce open-market sensor volumes. Closed-loop systems represent a large number of pump users today and grow 15-20% each year. If bundling becomes the norm, smaller or sensor-only companies may find access to the continuous glucose monitoring market more constrained, pushing them toward niche or wellness segments.
*Our forecasts treat driver/restraint impacts as directional, not additive. The impact forecasts reflect baseline growth, mix effects, and variable interactions.
Segment Analysis
By Component: Sensors Anchor Recurring Revenue Streams
Sensors captured 87.32% of the continuous glucose monitoring market in 2025 and are forecast to compound at an 18.05% rate through 2031. This dominance stems from 14- to 15-day replacement cycles that create subscription-like revenue predictability. The continuous glucose monitoring market size for sensor hardware is on track to surpass USD 14.2 billion by 2031, underpinned by mass-production cost advantages and AI-ready data output. Dexcom’s G7 15-day sensor, cleared in April 2025, sustains 8.0% MARD accuracy, demonstrating how incremental performance gains support premium price points. Longer wear times and Bluetooth direct-to-phone links minimize the role of dedicated receivers, paving the way for consumer-scale adoption well beyond diabetes.
Durable components—receivers and transmitters—hold 12.68% share and grow at just 19.35% through the forecast. Their decelerating curve reflects smartphone ubiquity that makes proprietary displays obsolete. Transmitters lasting 90-180 days dampen replacement frequency, and regulatory scrutiny pushes manufacturers to extend life cycles further. Higher per-unit prices cushion revenue, yet overall share slips as sensors absorb much of the system’s value. Competitive focus, therefore, centers on transmitter miniaturization and waterproofing to simplify closed-loop pump pairing.

By End User: Home-Based Management Leads Adoption
Home and personal users represent 67.10% of the continuous glucose monitoring market share in 2025, a figure projected to climb with an 17.62% CAGR as self-management becomes standard care. COVID-19 accelerated remote monitoring norms, and these behaviors persist because patients value autonomy. Pharmacy benefit coverage and direct-ship logistics cut clinic dependency, while mobile apps translate glucose patterns into actionable guidance. Health coaches and telehealth consults reinforce proper usage, embedding CGM into everyday routines.
Hospitals and clinics account for 32.90% of 2025 revenue yet rise at a faster 19.01% CAGR from a smaller base. Value-based purchasing encourages inpatient systems to swap point-of-care finger sticks for continuous tracking, particularly on surgical floors and high-risk medical units. Integration with electronic medical records is improving, reducing nursing workload while elevating patient safety. Over time, many admitted patients already wearing CGM at home will stay on their own devices during hospitalization, bridging both end-user categories and deepening market entrenchment.
By Demography: Pediatric Uptake Surges on Early Intervention
Adults held the majority, 60.88% share of the continuous glucose monitoring market size in 2025, supported by Medicare expansions and employer wellness programs. Yet adoption rates vary within this age range. Younger adults under 50 embrace device ecosystems quickly, while older cohorts face smartphone literacy and cost hurdles even after coverage reforms. Education campaigns that pair CGM data with nutrition counseling show promise in improving long-term adherence.
The pediatric population, still smaller in absolute terms, grows fastest at 19.12% CAGR. Early use prevents long-term complications, making payers willing to absorb sensor costs. School nurses increasingly manage CGM alerts during class, an operational change that removes a prior barrier to classroom participation. Parents also leverage cloud portals to monitor children remotely, reducing fear of nocturnal hypoglycemia and driving strong word-of-mouth advocacy that furthers adoption.
Geography Analysis
The United States' continuous glucose monitoring market shows notable regional clusters. Medicare Advantage penetration above 40% in these areas provides richer benefits that quicken uptake. By contrast, Medicaid policies range widely; Washington state covers CGM broadly, while several Midwestern states still require prior authorizations that impede installation.
California stands out because both Dexcom and Abbott operate sizable development hubs there. Early employee trials often precede formal FDA submissions, seeding local physician familiarity. Meanwhile, employer-sponsored wellness plans in Silicon Valley offer CGM stipends that illustrate broader consumer possibilities. International sales success of U.S. brands feeds domestic R&D budgets, with European FreeStyle Libre volumes helping Abbott price competitively at home. Balancing foreign expansion and domestic defense remains a strategic tightrope for all major manufacturers.
Regulatory Landscape
In the United States, continuous glucose monitoring (CGM) systems are regulated by the US Food and Drug Administration (FDA) as medical devices, including the integrated CGM classification under 21 CFR 862.1355. FDA clearance activity continues to affect competitive timelines, including 510(k) clearance for Dexcom G7 15-day (K253737) in February 2026, and software-related post-market actions such as the April 2026 Class 2 recall for the Dexcom ONE+ and G7 iOS apps tied to a display issue. Alongside device authorizations, FDA issued final guidance in May 2026 on submitting CGM data in clinical trials to support marketing applications for drugs and biologics, reinforcing expectations for CGM data as these sensors are used as endpoints and safety inputs in broader therapeutic programs.
Coverage policy is a central demand enabler. CMS maintains national and local coverage pathways under Medicare Part B, including criteria for CGM access for insulin-treated beneficiaries and those with problematic hypoglycemia, alongside LCDs such as L38662 (effective October 2025) addressing implantable CGMs and related coverage requirements. These coverage rules feed into durable medical equipment and pharmacy benefit workflows, shaping documentation burden and authorization speed for home and personal use, as well as for hospital and clinic adoption.
Competitive Landscape
The continuous glucose monitoring market remains oligopolistic. Abbott, Medtronic, and Dexcom jointly command roughly 98% of unit sales, yet the pace of technology keeps rivalry intense. Abbott leverages its high-volume FreeStyle Libre platform to undercut on price and to branch into wellness under the Lingo brand. Medtronic focuses on fully integrated insulin delivery, strengthening stickiness through Simplera sensor approvals that align with its pump portfolio. Dexcom positions G7 as the accuracy leader and pushes deeper into Type-2 populations via pharmacy benefit deals that simplify prescription processes.
Partnerships exemplify the move from devices to ecosystems. Medtronic and Abbott now collaborate on transmitter protocols so hospitals can adopt hybrid device fleets without data silos. Start-ups develop AI coaches that interpret CGM data for weight-loss or athletic performance, broadening competitive dimensions beyond pure hardware.
United States Continuous Glucose Monitoring Industry Leaders
-
Dexcom Inc.
-
Medtronic plc
-
Abbott Laboratories
-
Senseonics Holdings Inc.
-
F. Hoffmann-La Roche Ltd
- *Disclaimer: Major Players sorted in no particular order
Market Opportunities and Future Outlook
Coverage expansion and benefit design simplification are practical whitespace levers in the United States CGM market, especially for people with type 2 diabetes and for users managed outside intensive insulin regimens. Under CMS Part B coverage, CGM eligibility extends to insulin-treated patients and those with a history of problematic hypoglycemia, while state-level Medicaid variability continues to create access gaps that manufacturers and channel partners can address through payer contracting, documentation tools, and pharmacy benefit distribution. OTC CGM availability also expands the addressable base beyond traditional endocrinology prescribing, supporting service models that pair episodic sensor use with coaching and digital interpretation for non-insulin and wellness consumers.
Product and ecosystem differentiation also creates opportunity areas where clinical risk is not fully captured by glucose-only sensing or where wear-time and interoperability are decisive. Abbott and Medtronic have publicly advanced dual glucose-ketone sensing initiatives, and Senseonics has positioned Eversense 365 commercialization alongside pipeline programs (including Gemini and Freedom) and efforts to expand compatibility with automated insulin delivery systems. These efforts support whitespace in higher-acuity management, such as ketone monitoring to help manage ketoacidosis risk, and in longer-wear implantable formats. They also raise the importance of software reliability and data integration as CGM becomes embedded in routine care pathways and connected therapy stacks.
Recent Industry Developments
- June 2026: Expansion of partnership to commercialize dual glucose-ketone sensors designed for MiniMed's smart dosing systems. The collaboration aligns dual sensing with advanced insulin delivery to broaden utility in CGM driven therapy. The partnership strengthens ecosystem collaboration and expands the addressable market for integrated CGM solutions.
- June 2026: FDA clearance of the Stelo Glucose Biosensor System for use in children aged 2 years and older. The clearance supports earlier intervention by extending CGM access to pediatric patients. The development accelerates Dexcom's pediatric adoption strategy and expands its market footprint in early life segments.
- May 2026: CE Mark for Libre Duo, the world's first dual glucose-ketone sensing technology. The clearance enables EU market launch for dual sensing capabilities. The approval enhances global dual sensing and strengthens Abbott's competitive positioning in the CGM ecosystem.
Research Methodology Framework and Report Scope
Market Definition and Coverage
This market covers revenues generated in the United States from continuous glucose monitoring systems used to track glucose levels over time, including the device hardware and related consumables sold for personal and clinical use.
Scope exclusions: Traditional blood glucose meters and fingerstick test strips are excluded from this market sizing.
Segmentation Overview
- By Component
- Sensors
- Transmitters
- Receivers
- By End User
- Hospitals/Clinics
- Home/Personal Use
- By Demography
- Adult
- Pediatric
Data Sources, Market Sizing, and Validation
Desk Research
Desk research starts by framing the diagnosed diabetes pool, therapy patterns, and monitoring adoption, so the demand logic stays grounded before any revenue math is applied. We typically lean on non-paywalled public sources such as CDC diabetes surveillance, NIH and NIDDK publications, CMS coverage and payment references, and FDA device databases and safety communications to track indication changes and clearance timing.
Next, the sizing inputs are strengthened using public company filings and investor decks for category revenue cues, along with reputable press, conference proceedings, and association websites that summarize clinical guideline shifts. Where gaps appear, selected paid subscriptions are used for company financials and intelligence, patent databases, and shipment-level import and export signals to sanity check device flow and component pricing. The specific desk sources listed here are illustrative only, and many other references were also used for data collection, validation, and clarification.
Primary Interviews and Surveys
Primary work is used to confirm how CGM is being purchased and used across channels, and to pressure-test assumptions on replacement cycles, sensor wear duration, and reimbursement mix in day-to-day settings. We spoke with a mix of clinical stakeholders, payor and distributor informed sources, and device ecosystem participants, which helped close gaps that desk research cannot reliably answer. Since this is a US-only market, coverage was balanced across major states and care settings so the final inputs reflect common practice, not one local pattern.
Distribution of primary research fieldwork respondents
| Company type | Respondent position |
|---|---|
| Top tier: 33% | CXOs: 13% |
| Mid tier: 48% | Functional/Unit leaders: 42% |
| Smaller Players: 19% | Managers: 45% |
Market-Sizing & Forecasting
The core model uses a top-down build where the diagnosed and treated diabetes pool, mapped to CGM penetration by setting and age group, is converted into annual unit demand and then into value using average selling prices by component. Those totals are then checked with selective bottom-up approximations, such as sampled price points for sensors, transmitters, and receivers, channel feedback on mix shifts, and supplier-side volume direction to adjust any obvious over or under counts.
Inputs used in the model include the split of home versus hospital use, sensor wear duration and replacement frequency, transmitter replacement cycles, the share of users relying on smartphone viewing versus a dedicated receiver, and coverage expansion signals that affect eligible patient counts. Once these variables are stress-tested, the forecast is produced using scenario analysis supported by expert views on reimbursement, pricing pressure, and technology refresh timing. Any gaps in supplier signals are handled by applying conservative ranges for ASP and utilization, followed by a re-check against the implied per-user annual spend.
Data Validation & Update Cycle
Outputs are validated through consistency checks across independent signals, including implied active user counts, per-patient annual spend, and the direction of component mix over time. If a number looks off, we revisit the assumptions that typically drive variance, such as wear duration, coverage eligibility, or receiver attach rates, and then re-contact sources when a mismatch stays unresolved.
Before sign-off, the model is reviewed in steps by another analyst so calculation logic, units, and time alignment are confirmed. Reports are refreshed annually, and interim updates are made when a material event changes demand or pricing, such as a major coverage rule, product clearance, or meaningful price reset. Right before delivery, a final pass is completed so clients receive the most current view available.
Mordor Intelligence's US Continuous Glucose Monitoring Market Sizing Compared With Other Published Estimates
Published market sizes for US continuous glucose monitoring can vary even when the topic sounds the same, because firms do not always count the same products, user groups, and revenue components. Differences also show up when one estimate uses a different base year, applies an aggressive or conservative adoption curve, or assumes faster sensor price declines.
Blood glucose meter strips sit outside Mordor Intelligence's scope, and that single exclusion can push some broader diabetes monitoring numbers higher than a CGM-only view. Other gaps usually come from whether non-diabetic wellness use is included, how receiver revenue is treated when smartphones are used, and whether reimbursement changes are modeled from their effective date or blended in gradually across the year.
Benchmark comparison
| Source | Market Size | Gaps in Research Methodology |
|---|---|---|
| Mordor Intelligence | USD 6.28 B (2025) | |
| Industry Tracker A | USD 4.90 B (2024) | Uses an earlier base year and tends to keep penetration assumptions closer to the insulin-dependent user pool, which can understate newer Type 2 and OTC-driven demand that is visible in recent coverage expansions. |
| Market Bulletin B | USD 3.70 B (2024) | Appears to apply a narrower device scope and a slower replacement cycle assumption, which reduces implied annual sensor volume and lowers the total value even before pricing is applied. |
Looking across the table, the spread is mostly explained by what gets counted and when it is counted, rather than by math errors. By keeping the demand pool tied to diagnosed and treated cohorts, then checking the implied per-user spend against component replacement logic, the estimate stays traceable to simple inputs that can be revisited as reimbursement and usage patterns change.
Key Questions Answered in the Report
How large is the U.S. continuous glucose monitoring market in 2026?
It sits at USD 7,430.15 million and is tracking an 18.23% CAGR toward USD 17,164.69 million by 2031.
Which component leads sales today?
Disposable sensors dominate with an 87.32% share and drive most recurring revenue.
What policy shift is boosting Type-2 patient adoption?
The April 2023 CMS rule that now reimburses CGM for basal-only insulin users expands eligibility to about 1.5 million beneficiaries.
Which demographic segment is growing fastest?
Children and adolescents post a 19.12% CAGR thanks to early intervention programs and improved pediatric insurance coverage.