
US Conducted Energy Weapons Market Size and Share
Market Overview
| Study Period | 2019 - 2031 |
|---|---|
| Forecast Data Period | 2026 - 2031 |
| Historical Data Period | 2019 - 2024 |
| Market Size (2026) | USD 747.75 Million |
| Market Size (2031) | USD 980.34 Million |
| Growth Rate (2026 - 2031) | 5.57 % |
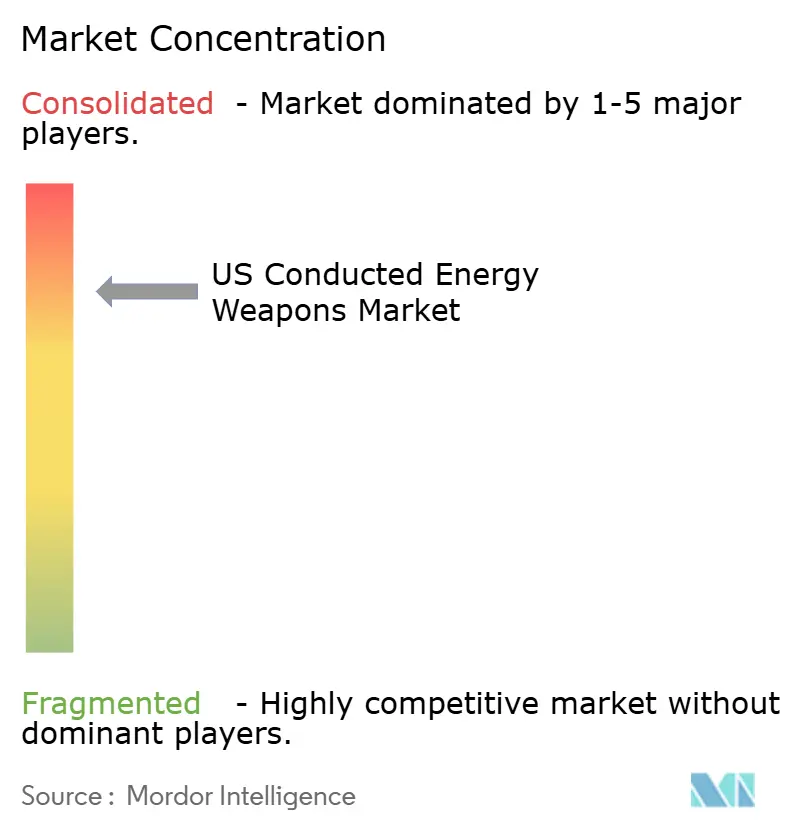
| Market Concentration | High |
Major Players *Disclaimer: Major Players sorted in no particular order Image © Mordor Intelligence. Reuse requires attribution under CC BY 4.0. | |
US Conducted Energy Weapons Market Analysis by Mordor Intelligence
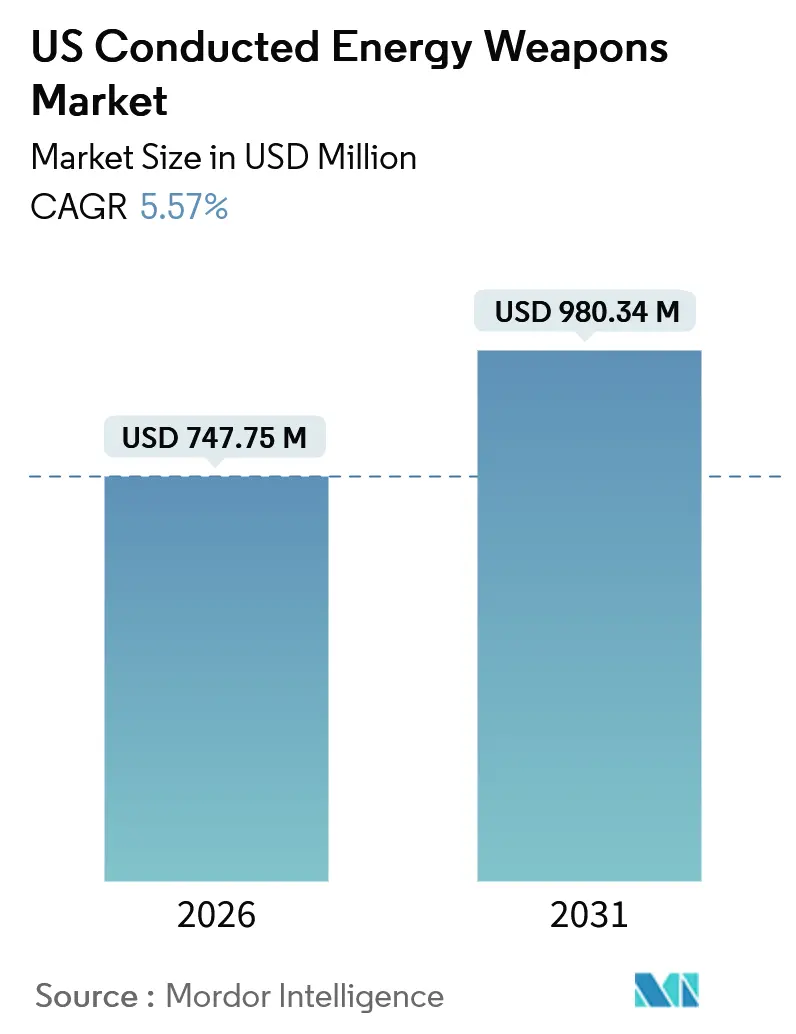
The conducted energy weapons market size in the United States is projected to reach USD 980.34 million by 2031, reflecting a 5.57% CAGR over the forecast period, from USD 747.75 million in 2026. This steady headline growth conceals a shift in demand drivers, with law enforcement replacement cycles giving way to rising civilian purchases and rapid upgrades to dual-shot, innovative platforms. Federal de-escalation mandates, bundled training requirements, and integration with cloud-based evidence systems continue to drive agency spending, even as litigation risks rise. Civilian buyers tend to gravitate toward lightweight, rechargeable stun guns priced under $30, thereby fragmenting the personal protection segment across multiple brands. Meanwhile, corrections facilities are fueling demand for extended-reach stun batons that operate reliably in confined spaces, and weapon upgrades are outpacing cartridge replenishment as agencies migrate to TASER 10.
Key Report Takeaways
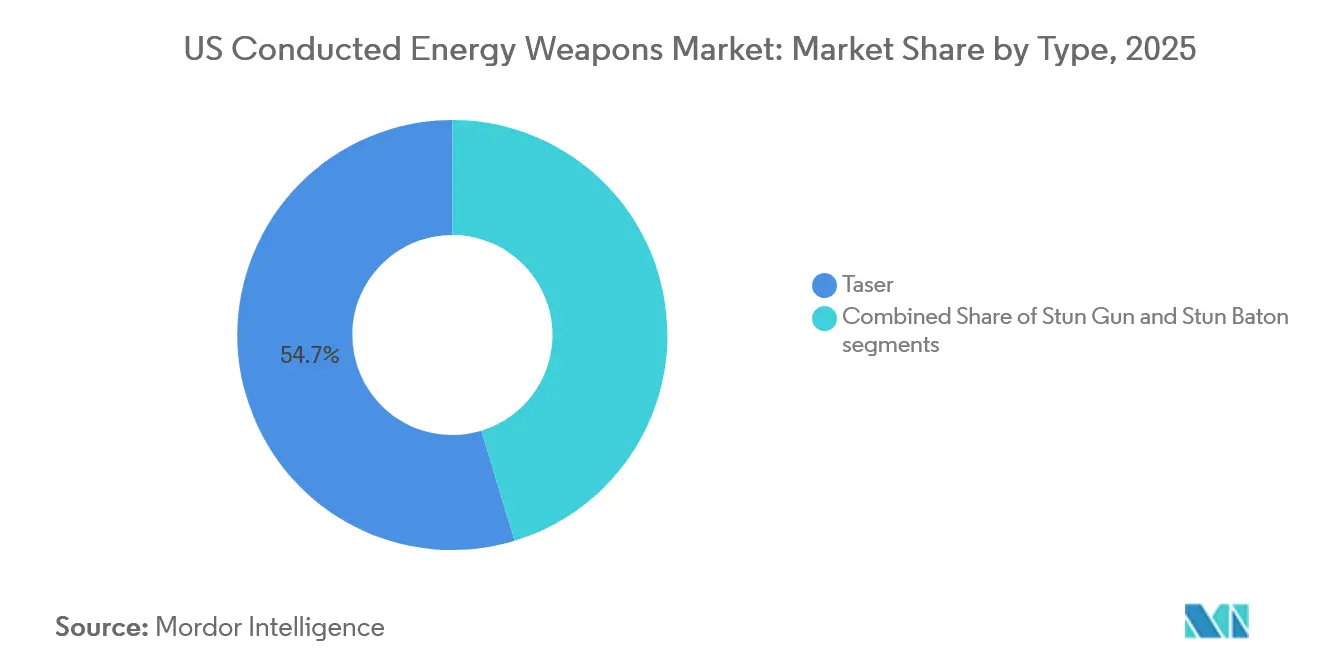
- By product type, tasers led with 54.67% revenue share in 2025; stun batons are projected to expand at a 5.97% CAGR through 2031.
- By equipment type, weapon platforms commanded 64.78% of the conducted energy weapons market size in 2025 and are projected to advance at a 6.12% CAGR through 2031.
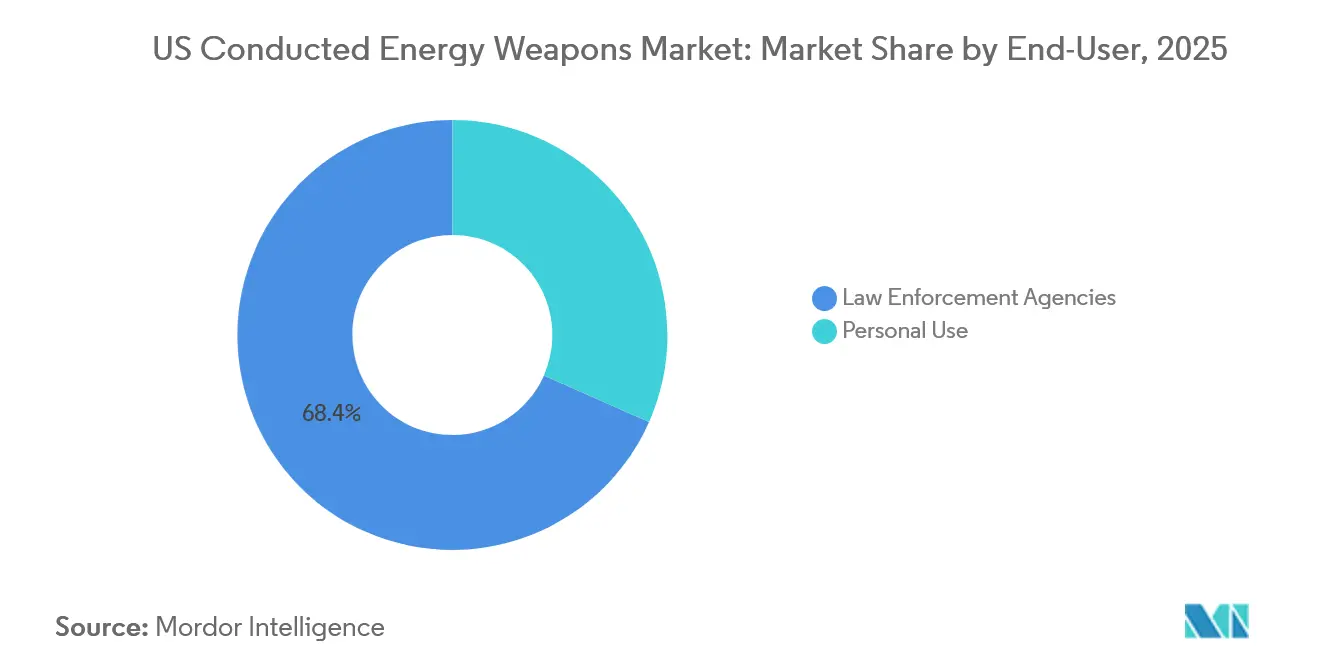
- By end-user, law enforcement agencies held 68.37% of the conducted energy weapons market share in 2025, while personal use is forecast to grow at a 6.78% CAGR through 2031.
Note: Market size and forecast figures in this report are generated using Mordor Intelligence’s proprietary estimation framework, updated with the latest available data and insights as of January 2026.
US Conducted Energy Weapons Market Trends and Insights
Drivers Impact Analysis*
| Driver | (~) % Impact on CAGR Forecast | Geographic Relevance | Impact Timeline |
|---|---|---|---|
| Federal de-escalation grants fueling LE procurement | +1.2% | National, urban jurisdictions benefiting from BJA JAG and COPS BWC funding | Medium term (2-4 years) |
| Rising civilian demand for non-lethal self-defense devices | +1.5% | National, strongest in 49 states permitting ownership | Short term (≤ 2 years) |
| Smart CEWs with data analytics and AI capabilities | +1.1% | National, led by large metro departments adopting Evidence.com ecosystems | Long term (≥ 4 years) |
| State-level legalization expanding retail addressable market | +0.8% | State-specific jurisdictions easing permit requirements | Medium term (2-4 years) |
| Wearable CEWs for corrections and prisoner transport | +0.6% | National, early uptake in federal and large state corrections systems | Long term (≥ 4 years) |
| Integration with body-worn cameras and evidence ecosystems | +0.9% | National, mandated where BWC policies tie to grant compliance | Medium term (2-4 years) |
| Source: Mordor Intelligence | |||
Federal De-escalation Grants Fueling LE Procurement
The Law Enforcement De-Escalation Training Act of 2022 links federal funding to alternative-force training, effectively positioning CEWs as compliant tools in grant-eligible purchase plans. JAG guidelines classify standalone weapons as “generally unallowable,” so agencies increasingly buy training-and-hardware bundles that satisfy eligibility rules. Axon reported TASER segment revenue of USD 238 million for Q3 2024, a 17% year-over-year increase, driven by upgrades to TASER 10 packages that include VR simulators and Evidence.com subscriptions.[1] The COPS Office Body-Worn Camera program further reinforces this pattern by subsidizing systems that synchronize weapon data with video evidence. As a result, agency refresh cycles shorten despite municipal budget headwinds, sustaining the conducted energy weapons market.
Rising Civilian Demand for Non-Lethal Self-Defense Devices
Personal-use sales are rising at a 6.78% CAGR through 2031, nearly a percentage point faster than institutional procurement. Google Trends reported a 23% surge in searches for “self-defense stun guns with flashlights” between April and August 2025, confirming heightened safety concerns in urban and suburban areas. Budget-friendly Vipertek VTS-880 units sell for USD 15.99, while SABRE’s premium rechargeable models reach USD 199 and promote NIJ-compliant microcoulomb ratings. Forty-nine states allow civilian ownership; only Rhode Island bans CEWs outright, and Hawaii requires permits, adding complexity for national retailers. This fragmentation contrasts with Axon’s dominance in policing, creating a white space for brands that can navigate regulatory variance while offering transparent performance metrics.
Smart CEWs with Data Analytics and AI Capabilities
TASER 10, introduced in 2023, delivers dual-shot capacity, 45-foot range, and automatic data upload to Evidence.com, embedding AI analysis into every use-of-force report. Agencies adopting the platform also commit to multi-year cloud subscriptions and VR training, raising switching costs. The Los Angeles Police Department’s 2023 directive mandates the automatic transfer of data within 24 hours of deployment, a workflow reliant on Axon’s ecosystem. Competitors such as PhaZZer cannot match this software stack, limiting their appeal outside price-sensitive departments. Consequently, innovative capability, not voltage specs, drives procurement, reinforcing Axon’s platform strategy.
Integration with Body-Worn Cameras and Evidence Ecosystems
Federal BWC grant rules encourage equipment packages that auto-activate cameras when a CEW is armed, streamlining evidence capture and reducing report errors.[2] TASER 10 supports this synchronized workflow, turning each deployment into a data-rich event that populates Axon’s cloud dashboard. The LAPD’s 2023 policy exemplifies the compliance load, requiring uploads within 24 hours and immediate submission of medical documentation. Vendors without camera ecosystems must rely on agencies to manage separate platforms, raising administrative friction. The resulting integration advantage underpins Axon’s 17% TASER revenue growth in Q3 2024 despite flat officer headcounts.
Restraints Impact Analysis*
| Restraint | (~) % Impact on CAGR Forecast | Geographic Relevance | Impact Timeline |
|---|---|---|---|
| Litigation and liability cost escalation | -1.3% | National, concentrated in jurisdictions with high-profile cases | Short term (≤ 2 years) |
| Municipal budget constraints on LE spend | -0.9% | National, pronounced in mid-size cities facing revenue gaps | Medium term (2-4 years) |
| Patchwork regulations limiting civilian sales | -0.7% | State-specific, notably Rhode Island and Hawaii | Long term (≥ 4 years) |
| Public scrutiny calling for bans/moratoria | -0.6% | Urban jurisdictions with active reform coalitions | Medium term (2-4 years) |
| Source: Mordor Intelligence | |||
Litigation and Liability Cost Escalation
More than 1,000 deaths following CEW exposure have been cataloged by the Congressional Research Service, keeping wrongful-death suits in the spotlight and pushing insurers to raise municipal premiums.[3] High-profile cases such as Keenan Anderson in 2023 intensified scrutiny, prompting directives that mandate medical exams and rapid data uploads after each use. Axon acknowledged “elevated legal expenses” during its Q3 2024 call, although it argues that robust training mitigates the risk. Smaller rivals have thinner balance sheets, which reduces their resilience to protracted litigation and consolidates market power among established players. Rising liability costs, therefore, dampen the overall growth of the conducted energy weapons market even as they entrench incumbent dominance.
Municipal Budget Constraints on LE Equipment Spend
Post-pandemic revenue gaps compel many cities to triage capital budgets, delaying CEW refresh cycles despite federal grants. Because JAG funds generally prohibit standalone CEW purchases unless paired with training, agencies must allocate scarce dollars to bundled packages that cost more upfront. The TASER 10 carries a significant premium over legacy TASER 7 units, forcing departments to justify their investments on data analytics grounds. COPS BWC grants offset some expenses, yet matching-fund requirements exclude fiscally strained jurisdictions. Budget pressure thus splits demand between large urban departments that can afford upgrades and smaller agencies that extend service lives or seek lower-cost alternatives.
*Our forecasts treat driver/restraint impacts as directional, not additive. The impact forecasts reflect baseline growth, mix effects, and variable interactions.
Segment Analysis
By Type: Stun Batons Extend Reach for Corrections Operators
Tasers account for 54.67% of 2025 revenue, reflecting long-standing agency preference for ranged incapacitation platforms that integrate with cloud evidence systems. This share stems chiefly from Axon’s TASER 10 upgrade wave, which boosted CEW revenue by 17% in Q3 2024. In contrast, stun batons are projected to register the fastest growth at a 5.97% CAGR, driven by corrections officers who require a reliable drive-stun capability without the logistical burden of cartridge usage. Baton Rouge PD’s 2024 policy review endorses weekly function tests and capped exposure, reinforcing preference for contact devices in inmate transfer corridors.
Stun guns occupy the budget-friendly middle ground for civilians. Vipertek’s VTS-880 integrates flashlight and alarm functions at USD 15.99, appealing to buyers in 49 permissive states. SABRE’s rechargeable models, rated at 1.820 microcoulombs, command a premium price of USD 199 by leveraging their law enforcement pedigree.[4] As NIJ pushes performance metrics beyond voltage claims, informed consumers are shifting evaluations toward charge delivery effectiveness, a trend that may alter future category shares.
By Equipment Type: Weapon Platforms Outpace Cartridge Sales
Weapons captured 64.78% of 2025 revenue and are projected to climb 6.12% annually to 2031, outperforming cartridges despite Axon’s consumable-centric business model. Agencies prioritize dual-shot TASER 10 upgrades to meet analytics and training requirements, compressing replacement cycles for older single-shot units. Extended-range cartridges priced at a premium elevate per-unit economics but slow volume replenishment, especially in budget-constrained municipalities. The personal segment relies on rechargeable designs that bypass cartridges entirely, shifting recurring revenue toward battery sales and accessories.
Legacy TASER 7 inventories still function adequately, encouraging some departments to stretch cartridge stockpiles rather than commit to complete platform swaps. BJA grant language accentuates this pattern by tying cartridge purchases to curriculum spending, further tempering demand growth for consumables. Over time, however, data-driven reporting obligations may prompt lagging agencies to undertake holistic platform refreshes, thereby maintaining a higher trajectory for weapon revenue within the conducted energy weapons market.
By End-User: Civilian Sales Accelerate While Agencies Consolidate
Law-enforcement buyers held 68.37% of the conducted energy weapons market share in 2025, with nearly 94% of agencies authorizing the deployment of CEWs. The installed base now focuses on upgrading to interconnected TASER 10 systems that synchronize with body-worn cameras and evidence platforms, locking departments into recurring SaaS payments. Axon’s Q3 2024 TASER revenue of USD 238 million underscores the durability of this channel despite plateauing officer headcounts.
Personal purchasers represent the fastest-growing end-user group, with an annual expansion rate of 6.78% through 2031. Portability, USB rechargeability, and pricing under USD 30 drive volume, while premium buyers seek NIJ-validated charging ratings. Regulatory friction persists in Rhode Island and Hawaii, but most states permit mail-order delivery, granting e-commerce retailers a broad reach. The divergence between consolidated institutional demand and fragmented civilian demand defines competitive strategy within the conducted energy weapons market.
Geography Analysis
The conducted energy weapons market shows pronounced regional variation within the United States. Urban departments in California, Texas, and New York allocate larger budgets to dual-shot innovative platforms that integrate with evidence clouds, contributing a disproportionate share of TASER 10 sales. Federal grants flow heavily to these jurisdictions, accelerating refresh cycles even as litigation risk remains elevated. Suburban counties in the Midwest follow at a measured pace, often deferring upgrades until grant matches materialize. Rural departments across the Plains states face tighter operating budgets, which slow platform replacement and sustain demand for lower-cost alternatives such as PhaZZer Enforcer units.
Civilian adoption likewise differs by region. Southern states with permissive carry laws show higher retail velocity for compact stun guns, aided by big-box distribution. In contrast, Northeastern states maintain more rigorous training mandates, channeling sales toward premium NIJ-rated devices from brands like SABRE. Western states exhibit robust e-commerce activity, although logistical hurdles persist in Hawaii due to its unique permit structure. Overall, regional regulatory heterogeneity both restrains and redistributes the growth of the conducted energy weapons market.
The corrections segment's growth mirrors the distribution of the inmate population. Large state systems in Florida, Texas, and California spearhead the adoption of stun batons for prisoner transport, whereas smaller Northeastern facilities rely on existing probe-mode inventories. Federal Bureau of Prisons facilities scattered nationwide account for a steady baseline of demand as they standardize compliance logging protocols that favor wearable devices. Across all regions, post-incident documentation requirements, as narrowed by grant programs, reinforce the shift toward data-integrated platforms, confirming the nationwide orientation of conducted energy weapons market dynamics.
Regulatory Landscape
Conducted Energy Weapons (CEDs/CEWs) sit under a mixed U.S. rule set that combines state-by-state possession limits with federal constitutional use-of-force case law and federal procurement compliance. On the civilian side, restrictions vary materially, with Rhode Island cited in-market as a full ban and Hawaii applying a permit framework, which complicates national retail and e-commerce fulfillment strategies. On the law enforcement side, NIJ has continued to document how CED policies evolve with research and field deployment, reinforcing the ongoing need for standardized training, reporting, and medical follow-up protocols as agencies expand deployments.
For institutional users, policy and oversight also flow through federal standards and acquisition governance. DOJ grant compliance (including de-escalation and body-worn camera related requirements) has pushed agencies toward training-and-hardware bundles and evidence-handling workflows, which increases the importance of digital evidence chain-of-custody. Separately, Department of Defense Instruction 5000.69 (issued August 2023) formalizes joint safety review processes for weapon systems (including directed energy), underscoring the broader federal emphasis on weapon system safety governance and documentation, which can influence how contractors package training, safety, and data requirements alongside devices and supporting systems.
Value Chain Analysis
The U.S. conducted energy weapons value chain starts with upstream electronics, battery cells, polymers, and cartridge consumables, then moves through device engineering, assembly, and quality assurance before distribution to agencies and consumer channels. Battery and electronics sourcing remains a key sensitivity point, as lithium-ion cells and certain electronic components often involve international supply exposure, while public-sector procurement pressures (including Buy American provisions where applicable) increase focus on U.S.-based assembly and traceability. For civilian products, branded importers and private-label sellers rely heavily on mass retail and e-commerce fulfillment, which elevates compliance screening (state restrictions, shipping rules, and product labeling) as a core operational step rather than a back-office function.
Downstream, the law enforcement chain increasingly behaves as an ecosystem business rather than a stand-alone hardware flow. Vendors, led by Axon, bundle CEW platforms (such as TASER 10), docks and accessories, training (including VR), and cloud evidence software into multi-year agreements, shifting value capture toward subscriptions and device-to-cloud connectivity with analytics. This structure raises switching costs for agencies and concentrates channel power among vendors that can provide an integrated package spanning procurement, training, data retention, and audit-ready reporting.
Competitive Landscape
Dominance within law enforcement procurement remains firmly with Axon, whose Evidence.com integration, VR training modules, and automatic BWC synchronization establish a closed platform that smaller vendors struggle to penetrate. Axon’s 17% year-over-year increase in TASER revenue in Q3 2024 illustrates the payoff from ecosystem lock-in. The firm regularly secures multi-year contracts that bundle weapons, cartridges, software, and training, minimizing churn and elevating the entry barriers to the conducted energy weapons market.
In the civilian market, competition is concentrated among various brands. SABRE leverages its policing heritage to justify premium pricing for NIJ-rated rechargeable models, while Vipertek captures consumers prioritizing price and USB convenience. Guard Dog Security fills a niche with multi-function flashlights that incorporate low-voltage stun outputs. PhaZZer positions its Enforcer as a budget-friendly option for rural agencies, but lags behind Axon in range, analytics, and cloud connectivity.[5] Byrna competes indirectly by selling chemical irritant launchers rather than electro-shock devices, limiting overlap but drawing from the same personal-defense wallet share.
Technology integration is the primary differentiation lever. Axon’s VR training simulators, AI-driven use-of-force analytics, and automated evidence upload tie each weapon deployment into a broader data ecosystem, raising exit costs for agencies. Smaller vendors attempt to close the gap by offering open-API firmware or partnering with third-party camera makers; yet, they seldom match the one-vendor convenience that departments prefer. As a consequence, the conducted energy weapons market remains bifurcated, with highly concentrated institutional sales and intensely competitive civilian sales.
US Conducted Energy Weapons Industry Leaders
-
Axon Enterprises Inc.
-
Streetwise Security Products
-
PhaZZer LLC
-
Guard Dog Security
-
Vipertek
- *Disclaimer: Major Players sorted in no particular order
Market Opportunities and Future Outlook
A major opportunity sits in procurement packages that connect CEWs with agency-wide evidence and incident documentation workflows, since grant-linked de-escalation and body-worn camera practices have made integrated data handling part of operational compliance. Axon has reinforced this direction with federal adoption of digital evidence management, including a 5-year, USD 30.2 million sole-source contract with the U.S. Marshals Service (awarded January 2026) for a high-authorized Digital Evidence Management System. This strengthens the commercial logic for vendors and integrators that can deliver end-to-end bundles covering weapon data, video, chain-of-custody, and policy-driven retention.
Another whitespace area is expansion beyond traditional patrol use into broader frontline and custodial environments where compact cameras, reporting automation, and training can be procured together with force options and governance. Procurement signals around body-worn cameras also matter for CEWs, because synchronized activation and unified evidence handling directly influence CEW platform selection in many agencies. For example, ICE has been associated with a potential USD 220 million body-camera-related requirement, indicating the scale at which federal buyers can expand integrated hardware-software stacks. In parallel, the fragmented personal-use segment creates room for brands that differentiate on transparent performance metrics (beyond voltage marketing) and retail-compliant distribution across 49 permissive states while navigating the remaining restrictive jurisdictions.
Recent Industry Developments
- July 2026: Axon Enterprises Inc. announced an ICE delivery order for body-worn cameras (non-competitive contract modification). The development reshapes public-safety hardware procurement dynamics by reinforcing an integrated hardware and software ecosystem. It strengthens Axon’s ecosystem lock-in via hardware-software contracts in law-enforcement deployments.
- June 2026: Axon Enterprises Inc. made the Axon Body Mini generally available for frontline teams. The expansion broadens Axon’s compact CEW-adjacent body-camera lineup for frontline agencies and accelerates field readiness. Broadens Axon’s influence in law-enforcement hardware ecosystems and data integration.
- April 2026: Axon Enterprises Inc. introduced AI-powered capabilities Axon Vision and Axon Assistant and integrated the Axon 911 platform. The rollout enhances data handling and interoperability in public-safety tech stacks. Supports higher value-per-user deployments and potential bundling with other Axon devices in procurement cycles.
Research Methodology Framework and Report Scope
Market Definition and Coverage
This market covers United States demand for conducted energy weapons (CEWs) used to temporarily incapacitate a person through an electric charge, measured as revenue from CEW devices and their related consumables sold into civilian and agency channels.
Scope exclusions: It excludes chemical irritants, impact munitions, acoustic devices, and directed energy systems that do not rely on conducted electrical discharge.
Segmentation Overview
- By Type
- Stun Gun
- Taser
- Stun Baton
- By Equipment Type
- Weapon
- Cartridges
- By End-User
- Law Enforcement Agencies
- Personal Use
Data Sources, Market Sizing, and Validation
Desk Research
Desk work starts by mapping what can be measured consistently for CEWs in the US, then collecting the data points that anchor volume and price assumptions. We leaned on public procurement and safety context sources such as SAM.gov and USASpending.gov, along with DOJ and NIJ publications that describe use-of-force and training expectations.
To keep the model tied to purchase behavior, we also reviewed SEC filings and investor presentations for market-facing revenue signals, and we used U.S. Census Bureau trade and manufacturing statistics where the category breakdown provided useful clues. Patent databases were included to understand technology refresh cycles that can influence replacement demand and cartridge innovation. For checks on public agency buying patterns, we screened selected contract and tender records using a paid contracts and tenders subscription. The sources listed here are illustrative rather than exhaustive, because we also used other public documents during data collection, validation, and clarification.
Primary Interviews and Surveys
Primary work focused on validating what gets purchased, how often units are replaced, and what drives price changes across devices and cartridges. We spoke with law enforcement procurement stakeholders, trainers, distributors, and participants in personal safety channels across the US so the desk research assumptions could be adjusted to match current buying cycles.
Where answers differed across groups, we went back to confirm the use-case (patrol, corrections, or personal protection), then rechecked the pricing logic and attach-rate assumptions before finalizing the model inputs.
Distribution of primary research fieldwork respondents
| Company type | Respondent position |
|---|---|
| Top tier: 39% | CXOs: 15% |
| Mid tier: 44% | Functional/Unit leaders: 41% |
| Smaller Players: 17% | Managers: 44% |
Market-Sizing & Forecasting
Sizing used a top-down approach, with agency procurement demand, personal protection indicators, and replacement cycles combined to reconstruct the addressable spend pool for CEWs in the US. We then cross-checked through selective bottom-up approximations using sampled average selling prices times estimated unit volumes for devices and cartridges, followed by distributor and channel feedback to correct obvious gaps.
Key inputs that shaped the model included device-to-cartridge attach rates, typical replacement timing for agency-issued units, and training and policy-driven adoption (including de-escalation and reporting requirements). We also accounted for the mix shift between single-shot and multi-shot platforms, and we reflected price differences between agency purchasing and consumer retail. Forecasting relied mainly on scenario analysis, starting from a base case agreed with interviewees and then adjusting for policy changes, procurement timing swings, and technology upgrade pacing.
Where direct unit visibility was limited, we handled gaps by using public award values and timing, then allocating spend across devices and consumables based on validated usage patterns rather than applying a flat split.
Data Validation & Update Cycle
Outputs were checked in a few steps so large swings could be explained before sign-off. We compared modeled totals against independent signals such as contract awards, company-reported directional performance, and replacement cycle logic, then reviewed any variances that appeared inconsistent with what interviews indicated.
If a major mismatch appeared, we re-tested the underlying assumptions and re-contacted relevant respondents to confirm whether a pricing change, a product transition, or a procurement delay was driving the change. Reports refresh annually, with interim updates when material events occur, and a final pre-delivery review is completed so clients receive the latest updated view.
Mordor Intelligence's US Conducted Energy Weapons Market Size Compared Against Other Published Estimates
Different published market sizes for US conducted energy weapons are common because each study can count a different mix of products, buyers, and revenue streams, and then apply its own timing for currency and price updates. The spread usually becomes wider when the scope mixes devices with broader less-lethal categories, or when the forecast period starts in a different base year.
The biggest gap driver is whether cartridges and replacement demand are fully counted alongside devices, where Mordor Intelligence treats the market as equipment plus consumables across law enforcement agencies and personal use. We validate the device-to-cartridge relationship through channel and trainer feedback before final totals are locked.
Benchmark comparison
| Source | Market Size | Gaps in Research Methodology |
|---|---|---|
| Mordor Intelligence | USD 0.75 B (2026) | |
| Industry Bulletin A | USD 0.62 B (2023) | Uses an earlier base year and can understate replacement-led spend when agency transition periods and cartridge usage rates are not refreshed to current platform mix. |
| Trade Brief B | USD 0.84 B (2028) | Leans on a higher-growth case over a shorter window, which can lift totals when upgrade cycles are assumed to convert faster and average prices rise more aggressively. |
Taken together, differences in year selection and what gets counted as recurring spend explain most of the variance across published figures. By tying assumptions to procurement timing, cartridge usage, and realistic upgrade pacing, the estimate stays traceable to clear variables that can be revisited as new awards and policies appear.
Key Questions Answered in the Report
How large is the Conducted Energy Weapons market in the United States today?
The Conducted Energy Weapons market size stands at USD 747.75 million in 2026 and is forecast to reach USD 980.34 million by 2031.
Which product type is growing fastest?
Stun batons show the quickest rise, expanding at a 5.97% CAGR through 2031.
What drives agency upgrades to TASER 10?
Federal de-escalation mandates and automatic integration with body-worn cameras and Evidence.com spur departments to adopt dual-shot TASER 10 platforms.
Why are civilian CEW purchases accelerating?
Portability, USB rechargeability and sub-USD 30 pricing are boosting civilian demand, particularly in states with minimal ownership restrictions.
Which states restrict civilian CEWs the most?
Rhode Island bans them outright, and Hawaii enforces a permit requirement, creating notable distribution hurdles.