
US Commercial Banking Market Size and Share
Market Overview
| Study Period | 2020 - 2031 |
|---|---|
| Forecast Data Period | 2026 - 2031 |
| Base Year Market Size (2025) | USD 732.5 Billion |
| Market Size (2026) | USD 765.53 Billion |
| Market Size (2031) | USD 954.48 Billion |
| Growth Rate (2026 - 2031) | 4.51 % |
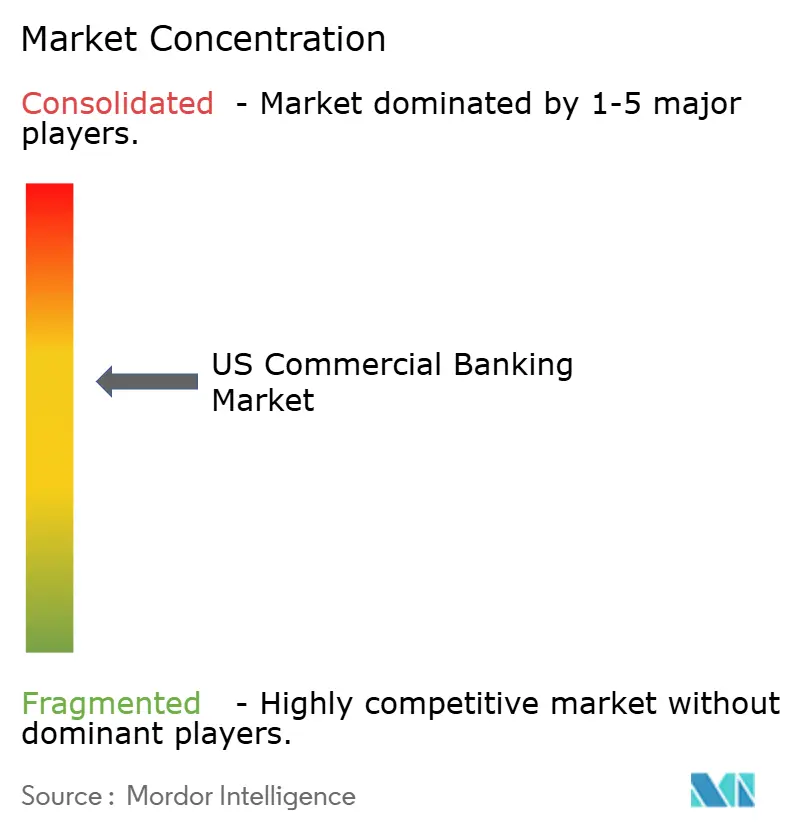
| Market Concentration | Medium |
Major Players *Disclaimer: Major Players sorted in no particular order Image © Mordor Intelligence. Reuse requires attribution under CC BY 4.0. | |
US Commercial Banking Market Analysis by Mordor Intelligence
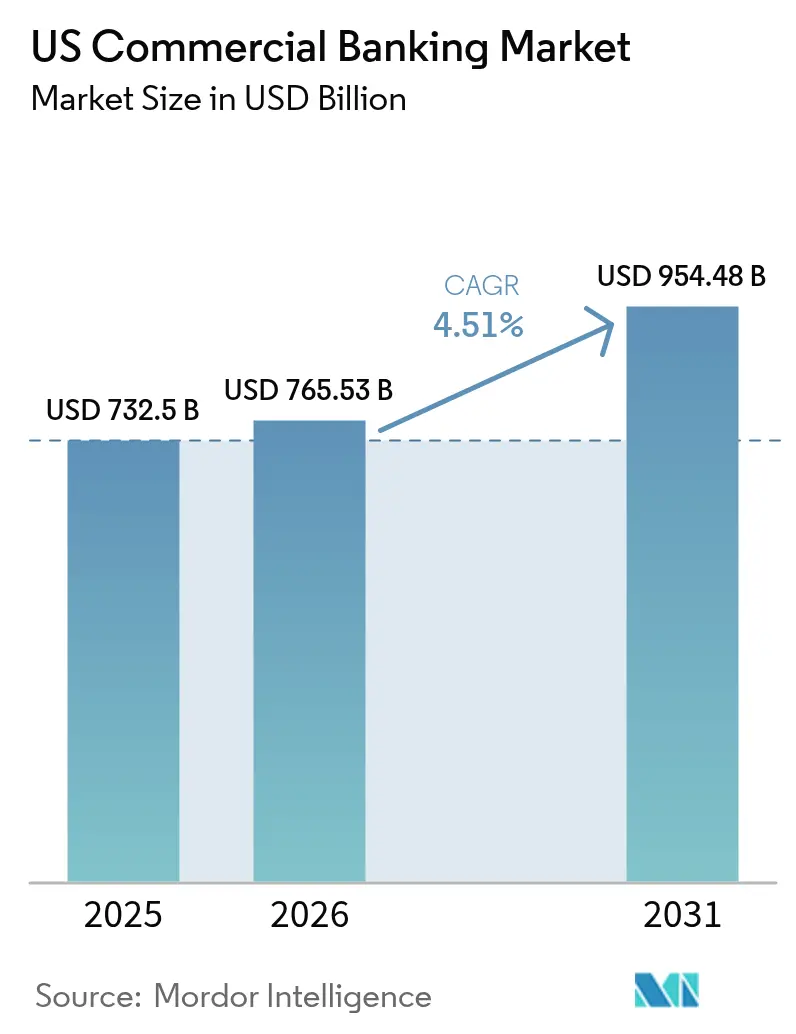
The US commercial banking market size in 2026 is estimated at USD 765.53 billion, growing from 2025 value of USD 732.5 billion with 2031 projections showing USD 954.48 billion, growing at 4.51% CAGR over 2026-2031. Resilient GDP growth, expanding real-time payments infrastructure, and steady capital ratios under Federal Reserve stress-test assumptions collectively reinforce confidence in the sector’s expansion. Banks are capturing structured-finance demand arising from on-shoring and federal infrastructure outlays, while fee-based products such as corporate treasury services are gaining momentum as net-interest margins stabilize near mid-cycle levels. Basel III “endgame” rules are nudging large institutions toward higher capital buffers, but disciplined cost management and broadening digital capabilities are preserving profitability. At the same time, embedded-finance platforms embedded in enterprise-resource-planning (ERP) systems pose disintermediation risks that require banks to accelerate open-API strategies and deepen advisory services.
Key Report Takeaways
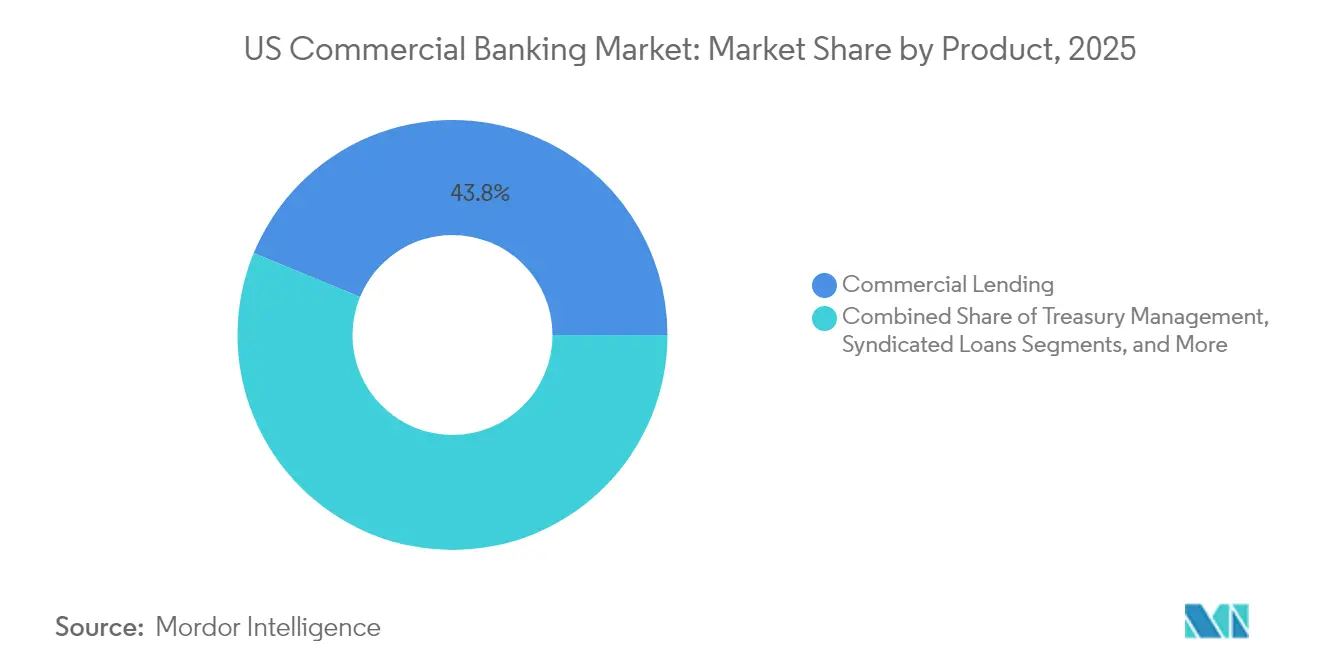
- By product, commercial lending led with 43.78% of US commercial banking market share in 2025, whereas treasury management is projected to expand at a 6.58% CAGR through 2031.
- By client size, large enterprises accounted for 61.88% share of the US commercial banking market size in 2025, while Small and Medium Enterprises are forecasted to grow at 7.02% CAGR over 2026-2031.
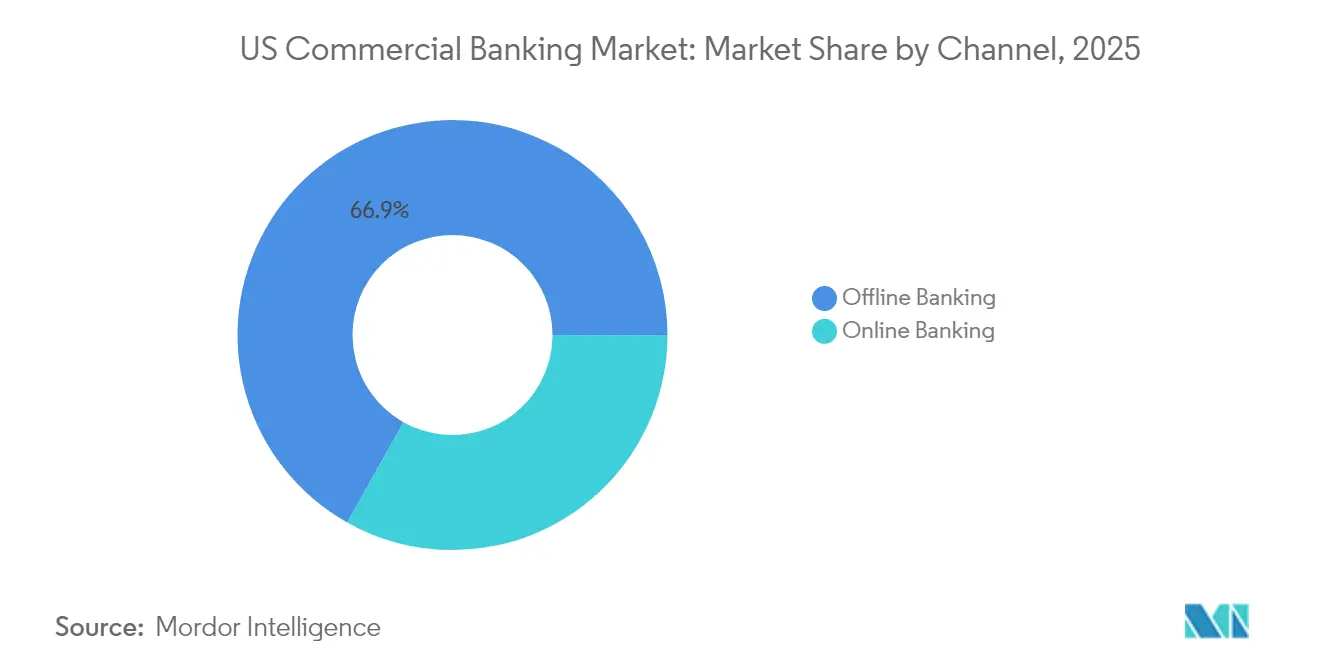
- By channel, offline banking held 66.85% of the US commercial banking market in 2025; online banking is projected to be the fastest-growing channel at a 8.96% CAGR to 2031.
- By end-user industry, other industry verticals held 22.64% of the US commercial banking market in 2025, while healthcare and pharmaceuticals captured 6.37% CAGR to 2031.
Note: Market size and forecast figures in this report are generated using Mordor Intelligence’s proprietary estimation framework, updated with the latest available data and insights as of 2026.
Market Trends and Insights
Drivers Impact Analysis of US Commercial Banking Market*
| Driver | (~) % Impact on CAGR Forecast | Geographic Relevance | Impact Timeline |
|---|---|---|---|
| Robust US GDP and labor-market momentum | +1.2% | National; major metropolitan areas | Medium term (2–4 years) |
| Accelerating adoption of real-time payments & APIs | +0.8% | National; tech-forward regions | Short term (≤2 years) |
| Federal infrastructure-spending-led loan demand | +0.9% | National; Midwest and South | Long term (≥4 years) |
| Federal cannabis-banking reform unlocking new fee pools | +0.3% | State-level; legalized markets | Medium term (2–4 years) |
| On-shoring-driven middle-market capex financing | +0.7% | Manufacturing belt; Southwest | Long term (≥4 years) |
| Tax-credit monetization under the IRA | +0.4% | Renewable-energy corridors | Long term (≥4 years) |
| Source: Mordor Intelligence | |||
Robust US GDP and Labor-Market Momentum
US GDP is set to grow 2.7% in 2025, buoyed by productivity gains and sturdy consumer spending that lift business revenues and, in turn, credit demand[1]. Banks benefit as tighter labor markets elevate household earnings and enhance corporate cash flows, enabling stronger debt-service coverage ratios. A policy stance that holds the federal-funds rate near 4% sustains net-interest margins without compromising lending appetite. Portfolio credit costs remain in check, as unemployment hovers around multidecade lows. Productivity improvements registered since 2023 position corporate borrowers to fund expansion out of cash flow, lowering balance-sheet risk for lenders. Together, these elements create a favorable backdrop for the US commercial banking market through mid-decade.
Accelerating Adoption of Real-Time Payments & APIs
FedNow participation vaulted from 400 to more than 1,000 institutions between early 2024 and 2025. ISO 20022 messaging now underpins instant settlement, automated reconciliation, and rich data transfer that corporate treasurers demand. Banks embedding APIs into corporate ERP suites see rising fee income per account from programmable treasury services such as automated sweeps and dynamic cash forecasting. Community banks leverage third-party API partners to match the capabilities of larger rivals, extending the US commercial banking market relevance into rural economies. As real-time payments become table stakes, institutions that master interoperability and data analytics gain a durable share of operating deposits. The shift also yields operating-expense savings via straight-through processing, enhancing cost-income ratios.
Federal Infrastructure-Spending-Led Loan Demand
The USD 1.2 trillion Bipartisan Infrastructure Law is channeling the largest wave of state and local capital investment since 1979[2]. Regional banks with entrenched local relationships are arranging construction lines, equipment leases, and working-capital facilities to contractors executing federally backed projects. Lower-income states in the South and Midwest receive outsized per-capita allocations, translating into predictable, multiyear lending pipelines. Ancillary service revenue emerges from payment guarantees, escrow management, and supply-chain financing tied to public-private partnerships. Because project timelines often exceed five years, bankers are locking in long-dated fee streams that cushion cyclical swings in traditional lending. The dispersed nature of projects also strengthens deposit franchises in communities previously underbanked by large nationals, broadening the footprint of the US commercial banking market.
Federal Cannabis-Banking Reform Unlocking New Fee Pools
Rescheduling cannabis to Schedule III will remove Section 280E tax penalties and lift margins for state-licensed operators, improving creditworthiness and attracting bank participation. Only 11% of community banks currently serve the sector, so first movers can secure sticky deposits and premium transaction fees once legislative clarity arrives. Compliance programs tailored to diverse state rules become competitive differentiators, allowing institutions to price higher account-analysis fees. Banks also foresee demand for armored-cash logistics, payroll services, and equipment loans geared toward cultivation facilities. Although initial volumes are modest relative to total assets, the incremental growth strengthens non-interest income, expanding the US commercial banking market in niche communities.
Restraints Impact Analysis of US Commercial Banking Market*
| Restraint | (~) % Impact on CAGR Forecast | Geographic Relevance | Impact Timeline |
|---|---|---|---|
| Escalating cybersecurity & fraud costs | −0.6% | National; major financial centers | Short term (≤2 years) |
| Basel III “end-game” capital tightening | −0.8% | National; $100 billion+ banks | Medium term (2–4 years) |
| Fed climate-stress-test capital limits | −0.3% | Regions exposed to climate risk | Long term (≥4 years) |
| Embedded-finance disintermediation via ERP ecosystems | −0.4% | Tech-forward markets | Medium term (2–4 years) |
| Source: Mordor Intelligence | |||
Escalating Cybersecurity & Fraud Costs
Bank IT budgets hit USD 107.8 billion in 2024, with a rising share directed at threat detection, zero-trust architectures, and real-time fraud interdiction. Treasury analysis warns that generative-AI tools empower fraudsters to craft adaptive malware, forcing banks to adopt similarly advanced analytics. Smaller institutions lack the scale to amortize escalating security spend, increasing merger pressure, or pushing them into managed-service arrangements. Elevated costs squeeze efficiency ratios, particularly when combined with declining overdraft and interchange income. Customer experience also suffers if multifactor authentication adds friction, giving fintechs an opening to capture transactional relationships. The drag on earnings, though moderate, subtracts from the US commercial banking market growth trajectory.
Basel III “End-game” Capital Tightening
The Federal Reserve’s July 2025 rules compel global systemically important banks to lift risk-weighted capital by 9%[3]. Regional banks over USD 100 billion face standardized-model overlays that inflate credit-risk weights versus internal calculations, curbing balance-sheet capacity. Institutions respond by repricing term loans and revolving commitments higher to cover capital costs, which tempers credit demand. Some portfolios, such as leveraged loans or project finance, become uneconomical relative to return-on-equity thresholds. Capital planning dominates board agendas, nudging banks to divest non-core assets and accelerate wealth-management cross-selling that carries lower risk weights. While the sector remains well capitalized, the incremental headwind trims the upper bound of the US commercial banking market compared with a neutral-regulation scenario.
*Our forecasts treat driver/restraint impacts as directional, not additive. The impact forecasts reflect baseline growth, mix effects, and variable interactions.
US Commercial Banking Market Segment Analysis
By Product:
Treasury Management Accelerates Fee DiversificationCommercial lending retained the largest 43.78% slice of the US commercial banking market activity in 2025, yet it provides slower growth as capital rules tighten. Nevertheless, robust capex tied to on-shoring and infrastructure projects sustains baseline volumes. Syndicated credits and capital-markets distribution diversify risk and free capital for incremental growth. Trade-finance, supply-chain, and foreign-exchange products, grouped under Other Products, draw strength from complex cross-border commerce. The combined product mosaic underscores banks’ strategy to balance capital-intensive lending with scalable fee services, ensuring the US commercial banking market remains profitable across rate environments.
The treasury management segment is projected to rise 6.58% CAGR to 2031, outpacing every other line as corporates migrate from paper-based processes to real-time liquidity tools. The segment’s share of the US commercial banking market size is projected to climb considerably by 2031, reflecting a decisive pivot toward non-interest income. Middle-market firms deploy API-enabled dashboards that consolidate multi-bank positions, prompting banks to add predictive cash-flow models, automated investment sweeps, and foreign-exchange hedging within single portals. Treasury fees thus become stickier than spread-dependent loan revenue, reducing earnings volatility. Community banks with assets above USD 3 billion are entering the field using white-label fintech platforms that collapse implementation costs, enlarging the addressable client base for the US commercial banking market.

By Client Size:
SME Digital Momentum BuildsLarge enterprises commanded 61.88% of the US commercial banking market share in 2025, leveraging wide credit facilities, multicurrency treasury centers, and global cash pooling. Their sheer volume stabilizes the US commercial banking market during economic shifts and supplies predictable cross-sell revenue across custody, FX, and derivatives. Yet these clients increasingly self-fund routine working capital and tap capital markets directly, pressuring banks to focus on bespoke advisory and structured solutions that embed added value.
Small and medium enterprises are set to expand at a 7.02% CAGR through 2031, rapidly adopting digital onboarding, AI-driven underwriting, and low-touch working-capital lines. Cost-efficient technology allows banks to adjudicate credit in minutes, winning share from alternative lenders that once served the segment. Improved digital satisfaction has 95% of interactions occurring through mobile or web, although complex matters still trigger in-person consultations, reinforcing the hybrid ethos of the US commercial banking market. Banks that master scalable SME underwriting not only unlock growth but also diversify loan books traditionally concentrated in large corporate exposures.
By Channel:
Hybrid Model Redefines Service DeliveryOffline Banking held 66.85% of the US commercial banking market share in 2025, demonstrating that face-to-face engagement remains essential for sophisticated credit, cash-management, and wealth-advisory mandates. Major banks such as Bank of America plan to open more than 150 branches by 2027, validating the physical-presence thesis. These outlets increasingly function as advisory lounges rather than teller windows, aligning cost-to-serve with relationship value.
Online Banking is expected to grow at a 8.96% CAGR over the forecast period, propelled by real-time payments and workflow integration that appeals to time-constrained treasurers. Omnichannel platforms route clients seamlessly between chat, video, and branch appointments while persisting data to avoid rekeying. As the US commercial banking market size for online channels expands, institutions integrate analytics to nudge clients toward revenue-generating products at contextual moments. A growing number of banks now route 62% of all real-time payment transactions through online or mobile applications, illustrating digital uptake even among legacy depositors. The emerging equilibrium is not channel substitution but synchronized delivery, curating convenience without sacrificing high-touch counsel.
By End-User Industry Vertical:
Healthcare Spurs Specialized FinanceThe Other Industry Verticals segment held 22.64% of the US commercial banking market share in 2025. Healthcare and pharmaceuticals records the fastest 6.37% CAGR, thanks to demographic aging, electronic-health-record mandates, and capital-intensive equipment upgrades. Banks cultivate sectoral expertise in revenue-cycle lending, practice-acquisition finance, and supply-chain management, capturing premium yields. The vertical’s compliance burden raises switching costs, locking in long-term relationships that bolster the US commercial banking market.
Manufacturing is resurgent amid on-shoring subsidies, demanding machinery leases, and factory retrofits aligned to automation. Retail and E-commerce show mixed fortunes: big-box footprints shrink even as online merchants require fulfillment-center loans and inventory lines. Information Technology and Telecommunications borrowers seek venture debt tied to artificial-intelligence rollouts, while the Public Sector preserves a stable but slower-growing base centered on municipal-bond underwriting. Each vertical adds diversification, letting banks hedge sector shocks while reinforcing consultative credibility.
Geography Analysis
The Northeast and West Coast collectively account for nearly half of outstanding commercial loans, reflecting dense corporate clusters, advanced technology ecosystems, and higher average ticket sizes. New York, Massachusetts, and California anchor complex treasury-management and capital-markets engagements that drive fee income. Yet the South and Southwest are the fastest-growing regions, with combined loan balances expanding at more than 5.85% annually as population inflows fuel small-business formation and residential construction. The US commercial banking market in Texas has experienced significant growth in 2025 and is expected to surpass national growth rates through 2031.
Infrastructure spending reshapes the Midwest, where federally backed road and bridge upgrades catalyze equipment financing for contractors and materials suppliers. Lower-income Mississippi and Alabama receive high per-capita allocations, enabling regional banks to underwrite multiyear projects with limited credit loss expectations. Cannabis legalization creates first-mover fee opportunities for banks in Illinois, Michigan, and Ohio, while institutions in prohibition states monitor regulatory signals before investing in compliance systems.
Climate-related physical risks vary across geographies. Southeastern institutions confront hurricane exposure that influences credit modeling and capital allocations under the Federal Reserve’s climate stress scenarios. Pacific Coast banks manage wildfire risk and water-scarcity covenants in real-estate loans. Geographic diversification thus becomes a strategic imperative, prompting nationwide lenders to hedge exposures and regional banks to deploy sectoral expertise within their home markets. Collectively, these dynamics sustain a balanced, regionally nuanced US commercial banking market.
Regulatory Landscape
US commercial banking remains governed by a multi-regulator framework led by the Federal Reserve, OCC, and FDIC, with capital, liquidity, and governance requirements calibrated by institution size and activity. In March 2026, the Federal Reserve, FDIC, and OCC issued joint proposals to modernize the regulatory capital framework, including revisions to risk-based capital and the market risk framework. The public comment window runs through June 18, 2026, and the proposals continue to shape balance-sheet capacity and product pricing at larger banks.
Supervisory expectations have also tightened around operational controls. On April 17, 2026 (FDIC FIL-15-2026), the agencies issued revised interagency Model Risk Management guidance, replacing earlier guidance and emphasizing lifecycle controls aligned to model materiality, particularly for banking organizations above USD 30 billion in assets. Separately, the OCC and FDIC finalized a 2026 rule to codify the elimination of “reputation risk” from their supervisory programs, narrowing supervisory criticism to safety-and-soundness and compliance factors.
Value Chain Analysis
The US commercial banking value chain starts with funding and balance-sheet capacity (operating deposits, wholesale funding, and capital), then moves into credit origination and underwriting through relationship managers, credit committees, and risk models. It extends into distribution and risk transfer via syndication, participations, and capital-markets facilitation. Delivery and servicing are supported by branch-based relationship coverage and digital channels (online portals and APIs) that underpin treasury management, payments, and liquidity tools, with enabling layers such as core processing, cloud and cybersecurity infrastructure, and third-party fintech providers supporting onboarding, KYC/AML workflows, fraud monitoring, and real-time payments integration.
Oversight and control functions shape economics across the chain, including Federal Reserve supervision for bank holding companies and systemic institutions, OCC supervision for national banks, and FDIC supervision for state non-member banks, alongside state regulators. The Federal Reserve’s risk-focused supervision tiers (community, regional, large/foreign, and G-SIB programs) influence compliance intensity, data requirements, and model governance. Together with the joint capital rulemaking activity in March 2026, this regulatory recalibration affects the cost of holding certain loan and trading exposures and reinforces the shift toward fee-led products such as treasury and cash-management services.
Competitive Landscape
The US commercial banking market is moderately concentrated and rapidly reshaping. Competitive intensity is escalating as traditional institutions confront technology, regulation, and consolidation all at once. Capital One’s USD 35.3 billion purchase of Discover, finalized in May 2025, created the eighth-largest US bank and positioned the merged entity as the top credit-card issuer. This transaction signals a renewed M&A cycle, enabled by regulators that now weigh systemic stability against the need for competition. Banks with sub-USD 100 billion assets are evaluating strategic alternatives to meet rising compliance costs, spurring a pipeline of transactions across the Midwest and Southeast.
Technology adoption has become the decisive battleground. Large banks deploy generative-AI models to automate software coding, detect fraud in real time, and generate client insights that augment advisory services. Productivity gains reach 20% in certain operations, freeing capacity for revenue-generating tasks. Meanwhile, ERP-embedded finance providers siphon routine payment flows, compelling banks to open APIs and reposition products as invisible services within corporate workflows. Early movers secure proprietary data insights that reinforce pricing power, illustrating the virtuous cycle now reshaping the US commercial banking market.
Capital regulation tilts advantages toward scale players that can diversify risk across product silos and geographies. Nevertheless, niche specialists thrive by focusing on healthcare banking, renewable-energy project finance, or community-centric relationship models. Regional banks exploit local intelligence to compete on service responsiveness, even as they outsource core processing to cloud vendors to achieve cost parity. Taken together, the competitive mosaic underscores a moderately concentrated yet dynamically shifting US commercial banking market.
US Commercial Banking Industry Leaders
-
JPMorgan Chase & Co.
-
Bank of America Corp.
-
Wells Fargo & Co.
-
Citigroup Inc.
-
U.S. Bancorp
- *Disclaimer: Major Players sorted in no particular order
US Commercial Banking Market Companies Covered in this Report
- JPMorgan Chase & Co.
- Bank of America Corp.
- Wells Fargo & Co.
- Citigroup Inc.
- U.S. Bancorp
- PNC Financial Services Group
- Truist Financial Corp.
- Goldman Sachs Group Inc.
- Morgan Stanley
- Capital One Financial Corp.
- Regions Financial Corp.
- M&T Bank Corp.
- Huntington Bancshares Inc.
- Fifth Third Bancorp
- KeyCorp
- Citizens Financial Group Inc.
- Comerica Inc.
- First Citizens BancShares Inc.
- BNY Mellon Corp.
- State Street Corp.
Market Opportunities and Future Outlook
Commercial banks are expanding addressable fee pools as payments and cash management become more data-rich and workflow-embedded. FedNow participation rose from about 400 to more than 1,000 institutions between early 2024 and 2025, supporting instant settlement and ISO 20022 data. That creates room to monetize programmable treasury services such as automated reconciliation, sweeps, and forecasting within corporate ERP environments. A cross-border real-time payments whitespace remains visible, supported by Bank of America’s June 2026 announcement of a cross-border real-time payments solution for commercial and financial institution clients through CashPro.
Technology modernization is another opportunity area, but commercial impact depends on governance clarity and implementation capacity. Revised interagency Model Risk Management guidance issued in April 2026 sets a more current baseline for model lifecycle controls as banks deploy AI in fraud detection, underwriting, and servicing, and as third-party partnerships take on a larger delivery role. Banks also continue to allocate balance-sheet capacity to adjacent segments involving non-depository financial institutions and private-credit ecosystems, while deepening vertical specialization, such as healthcare revenue-cycle and equipment finance, where compliance and operational complexity increase switching costs and support higher-value relationship bundles.
Recent Industry Developments in US Commercial Banking Market
- June 2026: Bank of America announced the forthcoming launch of a cross-border real-time payments capability for commercial and financial institution clients through its CashPro platform. The move targets corporate treasury workflows that require faster settlement and richer payment data across corridors, strengthening CashPro stickiness and fee capture versus nonbank payment rails.
- May 2026: A collaboration between U.S. Bancorp and Amazon Web Services expanded to advance cloud modernization and implement generative AI capabilities. The effort aims to accelerate product iteration and strengthen resilience across digital banking and operations, supporting cost-to-serve improvements and enhanced service uptime for business customers.
- May 2025: Capital One closed its USD 35.3 billion acquisition of Discover Financial Services after receiving regulatory approvals. The deal reshapes competitive dynamics across cards and payments and creates a larger platform for deposit gathering and treasury-adjacent services that can be cross-sold into business banking relationships.
US Commercial Banking Market Report Scope and Research Methodology
Market Definition and Coverage
This market is measured as the fee and interest income earned when licensed US chartered commercial banks provide banking services to business customers, across relationship teams, branches, and online portals. The value is captured in nominal USD and reflects onshore activity that is booked on a consolidated basis.
Scope exclusions: Retail only deposit activity, proprietary trading desks, and pure investment banking advisory work are kept out of this market boundary.
Segments Covered in This Report
- By Product
- Commercial Lending
- Treasury Management
- Syndicated Loans
- Capital Markets
- Other Products
- By Client Size
- Large Enterprises
- Small & Medium Enterprises (SME)
- By Channel
- Online Banking
- Offline Banking
- By End-User Industry Vertical
- IT & Telecommunication
- Manufacturing
- Retail And E-Commerce
- Public Sector
- Healthcare And Pharmaceuticals
- Other Industry Verticals
Data Sources, Market Sizing, and Validation
Desk Research
Desk research set the market perimeter and provided stable reference series that can be checked year over year. We relied on public, non paywalled sources such as the FDIC Quarterly Banking Profile, Federal Reserve statistical releases and rate data, the US Bureau of Economic Analysis industry accounts, US Census Bureau NAICS definitions and economic series, and SEC filings and 10-Ks for listed banks. These sources helped us map how interest income, fee income, and credit costs typically move when rates change and when business activity slows or recovers.
To make the revenue mapping more realistic, we also reviewed bank investor presentations, earnings call transcripts, association publications, and reputable financial press for signals on loan demand and treasury fee momentum. A paid company financials and intelligence subscription was used selectively to normalize income line items across institutions and time periods, and a paid news and financials source was used to track policy and regulatory events that can shift guidance quickly. The examples above are not exhaustive, and many other sources were also referred to for data collection, validation, and research clarification.
Primary Interviews and Surveys
Primary work was used to confirm how banks classify commercial banking revenue in practice, and to clarify which income lines are treated as core commercial banking versus adjacent activity. We spoke with respondents across credit, treasury, cash management, and finance functions, and we also checked regional patterns because business banking activity can vary by corridor and industry mix. Feedback was used to pressure test assumptions around margin pass through, loan mix shifts, and fee attach rates before totals were finalized.
Distribution of primary research fieldwork respondents
| Company type | Respondent position |
|---|---|
| Top tier: 37% | CXOs: 12% |
| Mid tier: 49% | Functional/Unit leaders: 43% |
| Smaller Players: 14% | Managers: 45% |
Market-Sizing & Forecasting
The sizing starts with a top-down build where income pools are reconstructed from public banking system statements and then filtered to business customer activity that fits the defined coverage. Once that total is obtained, it is corroborated with selective bottom up checks, such as sampled bank income statements, yield and fee rate checks applied to loan and deposit volumes, and channel level sanity checks for transaction banking.
Key inputs used in the model included the policy rate path and implied net interest margin direction, commercial and industrial loan growth, syndicated loan activity signals, treasury and cash management fee trends, credit loss expectations, and business investment indicators that affect borrowing appetite. For forecasting, scenario analysis was used so the base case reflects the most likely path of rate normalization, credit quality, and fee recovery, with alternative cases reflecting slower demand or faster re acceleration. Where a bottom up check could not cover smaller institutions evenly, gaps were handled through peer group ratios calibrated to FDIC aggregates and then re tested through interview feedback.
Data Validation & Update Cycle
Outputs were compared against independent signals such as system level banking income totals, loan and deposit growth patterns, and fee line behavior during similar macro phases, and then variances were investigated before sign off. If a result looked inconsistent with credit conditions or rate transmission, assumptions were revisited and experts were re contacted to confirm whether a temporary factor was present.
A multi step review was followed, including internal checks on definitions, unit consistency, and time series continuity, followed by a final analyst pass to confirm the narrative aligns with the model. The report is refreshed annually, and interim updates are made when material events occur, such as sharp rate moves, major regulatory changes, or sudden shifts in credit losses. Before delivery, the latest public releases are rechecked so clients receive an updated view.
Mordor Intelligence's US Commercial Banking Market Estimate Compared With Other Published Estimates
Published market values for US commercial banking can look far apart because the market is not always defined the same way, and the starting year chosen can also differ. Some sources treat the topic like a NAICS style industry revenue roll up, and others focus on a narrower business banking income pool, which can create large gaps before any forecasting method is applied.
FDIC income line totals and Federal Reserve rate cycle signals are the checks that keep Mordor Intelligence's estimate tied to business customer driven fee and interest income, instead of counting retail only deposit activity or proprietary trading income. Differences also come from whether net interest margins are assumed to normalize quickly, how treasury management fee growth is modeled, and how annual refresh cutoffs are timed in a fast moving rate environment.
Benchmark comparison
| Source | Market Size | Gaps in Research Methodology |
|---|---|---|
| Mordor Intelligence | USD 765.53 B (2026) | |
| Industry Data Provider A | USD 1300.00 B (2025) | The figure is presented as industry revenue aligned to NAICS coverage, which can include consumer banking revenue lines and other banking services beyond business customer activity, and it also uses a different base year than 2026. |
| Market Publisher B | USD 950.00 B (2024) | The estimate uses a valuation style base year with broad service groupings that can fold retail banking into the total, and the longer forecast window can amplify differences in rate and margin assumptions. |
Across the table, most of the spread can be traced to definition and year choices, and then to rate and margin assumptions that compound over time. When the revenue pool is linked back to observable banking system aggregates and then stress tested with interview feedback, the final number stays easier to replicate and update.
Key Questions Answered in the Report
What is the current size of the US commercial banking market?
The US commercial banking market size is USD 765.53 billion in 2026 and is on track to hit USD 954.48 billion by 2031.
Which product area is growing fastest?
Treasury Management services lead growth at a 6.58% CAGR through 2031 as businesses adopt real-time liquidity and API-driven cash-management tools.
How will Basel III endgame rules affect commercial lending?
Required capital increases of 9% for large banks will raise pricing on risk-weighted assets and may constrain aggregate loan growth by roughly 0.8 percentage points across the forecast horizon.
Why is the healthcare sector attractive to banks?
Healthcare clients need specialized revenue-cycle financing, equipment loans, and regulatory-compliant treasury solutions, driving a 6.37% CAGR and higher fee yields compared with many other verticals.
Are physical branches still relevant in commercial banking?
Yes. Although online transactions are expanding at 8.96% CAGR, 66.85% of 2025 activity still flowed through branches, which remain vital for complex advisory and relationship management.
What opportunities could cannabis banking reform create?
Rescheduling cannabis at the federal level could unlock new deposit pools, transaction fees, and loan demand in states where the industry is legalized, adding roughly 0.3 percentage point to market CAGR once enacted.