
Market Overview
| Study Period | 2020 - 2031 |
|---|---|
| Forecast Data Period | 2026 - 2031 |
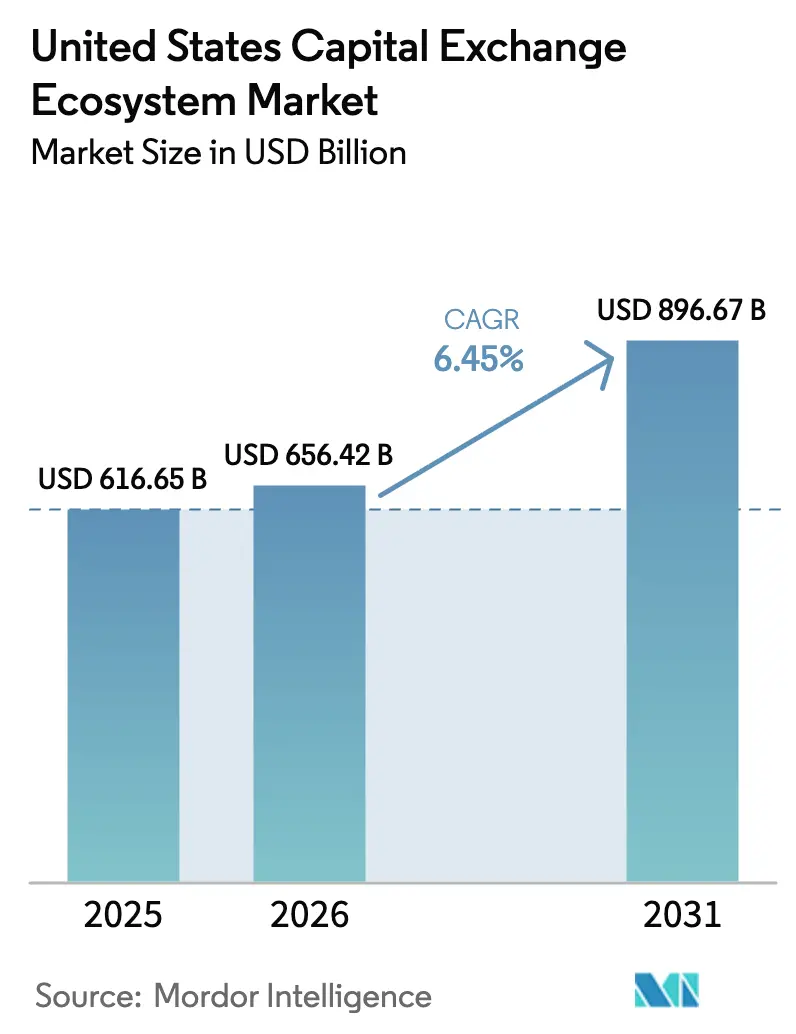
| Base Year Market Size (2025) | USD 616.65 Billion |
| Market Size (2026) | USD 656.42 Billion |
| Market Size (2031) | USD 896.67 Billion |
| Growth Rate (2026 - 2031) | 6.45 % |
| Market Concentration | Medium |
Major Players *Disclaimer: Major Players sorted in no particular order Image © Mordor Intelligence. Reuse requires attribution under CC BY 4.0. | |
United States Capital Exchange Ecosystem Market Analysis by Mordor Intelligence
United States Capital Exchange Ecosystem market size in 2026 is estimated at USD 656.42 billion, growing from 2025 value of USD 616.65 billion with 2031 projections showing USD 896.67 billion, growing at 6.45% CAGR over 2026-2031. Solid growth reflects sustained algorithmic‐trading adoption, deeper institutional demand for sophisticated execution services, and a revitalized IPO pipeline that is lifting fee pools across asset classes. The Federal Reserve’s policy-normalization cycle first curtailed margin-driven volumes, yet subsequent rate volatility propelled derivative hedging and bond trading, adding fresh revenue streams for venue operators. Exchanges are upgrading core systems to enable 24/7 order matching, consolidated data feeds, and tokenized security workflows, thereby improving transparency and reinforcing platform stickiness. Zero-commission brokerage models are swelling retail participation, which is prompting exchanges to launch fractional shares, tailored analytics, and extended trading windows that preserve engagement while smoothing intraday liquidity patterns. Regionally, leadership remains anchored in the Northeast, but the West’s fast-growing technology ecosystem is recasting the competitive landscape and catalyzing national innovation cycles.
Key Report Takeaways
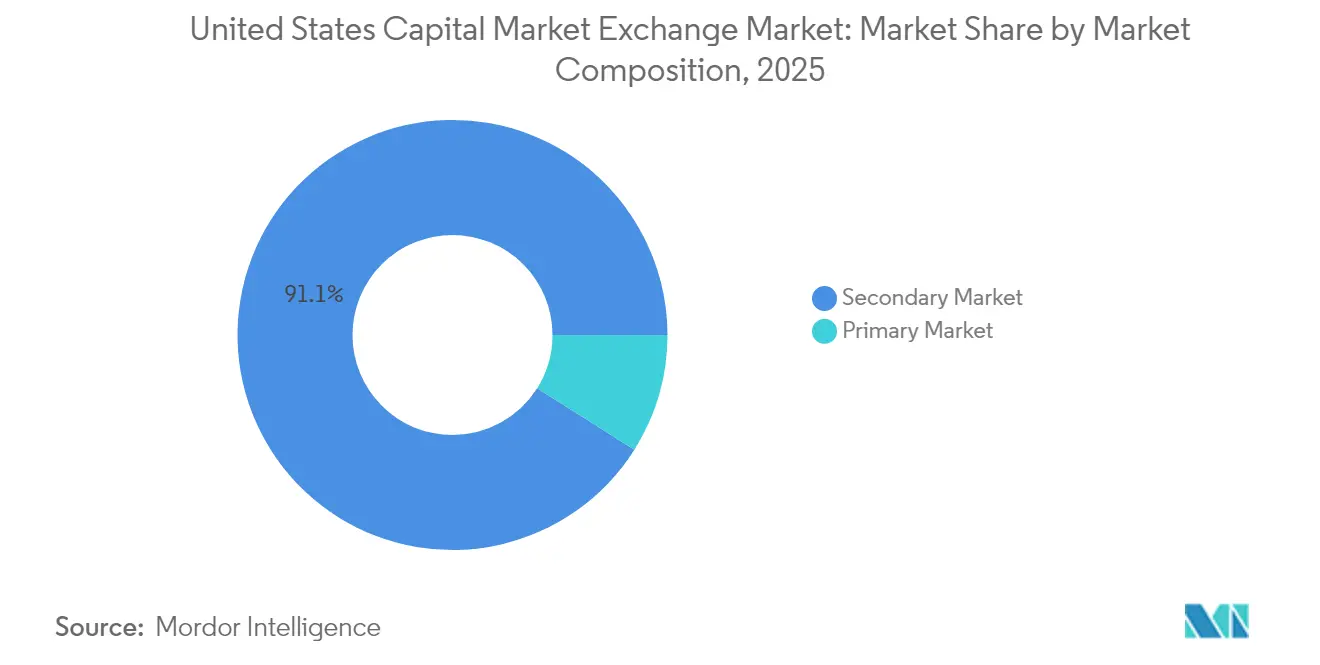
- By market composition, the secondary segment held 91.05% of the United States capital market exchange market share in 2025, while the primary segment is forecast to rise at a 6.11% CAGR through 2031.
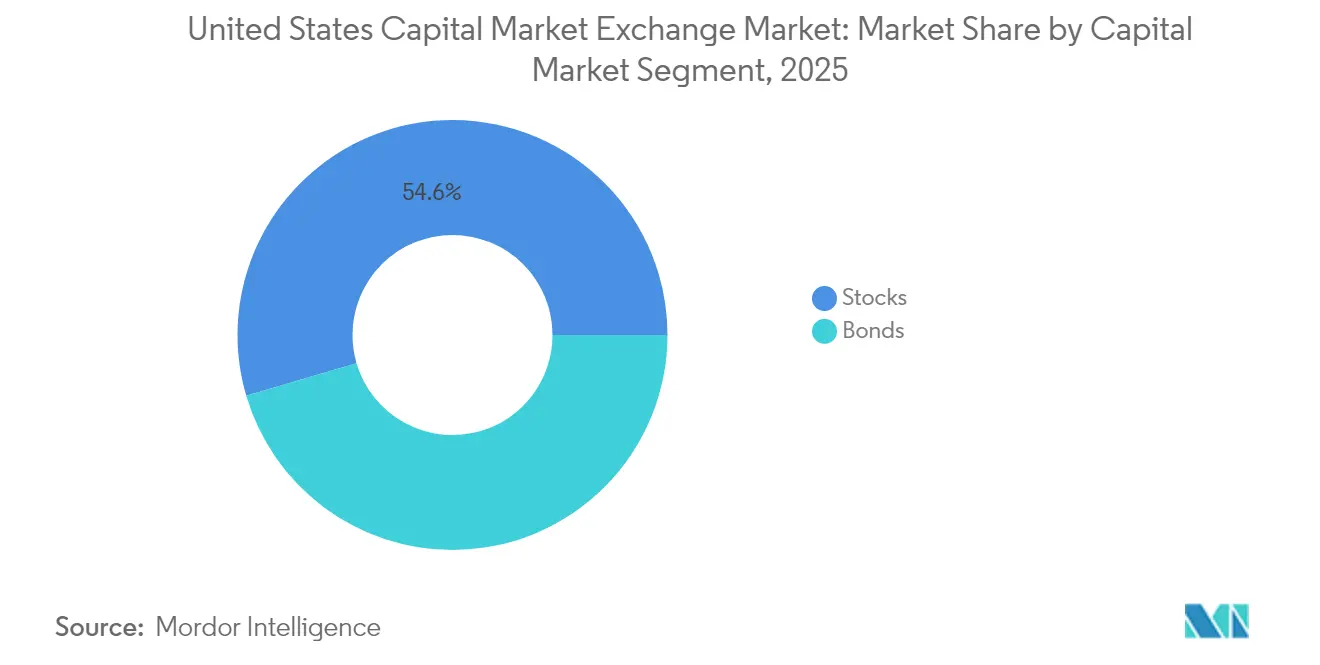
- By capital-market segment, stocks captured 54.55% of the United States capital market exchange market size in 2025, whereas bonds are positioned to expand at a 4.12% CAGR to 2031.
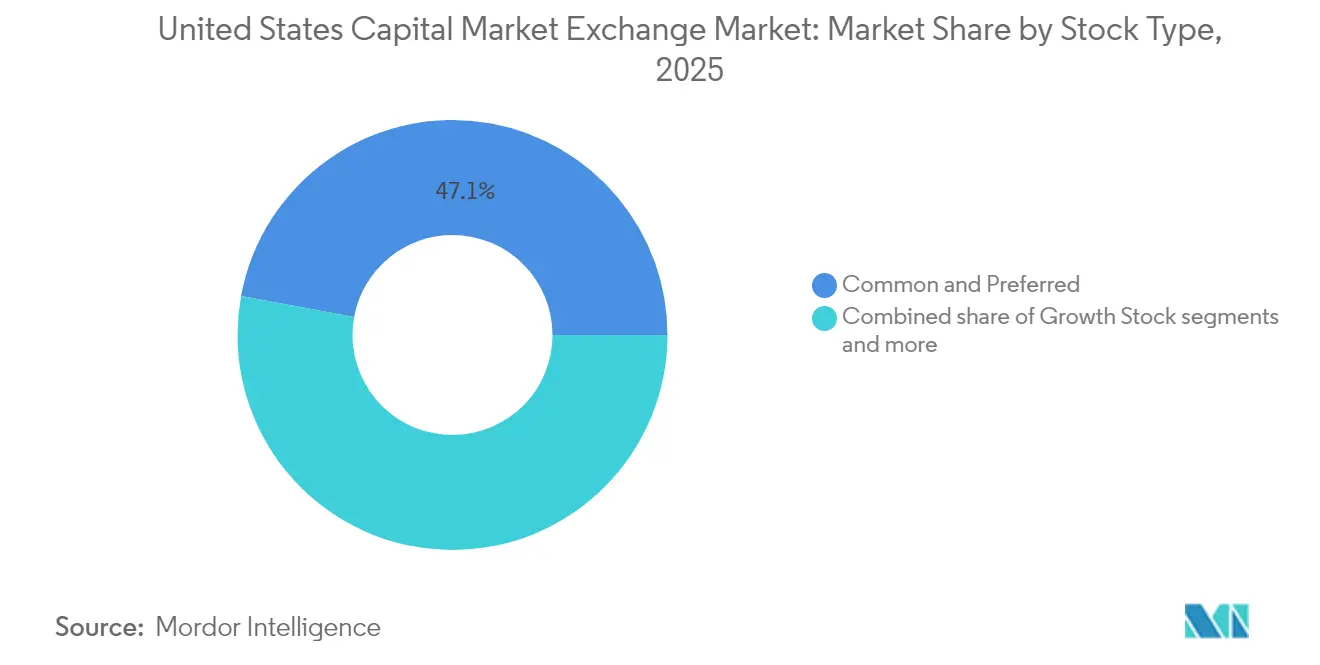
- By stock type, common and preferred shares represented 47.10% of the United States capital market exchange market size in 2025; growth stocks are projected to climb at an 8.75% CAGR through 2031.
- By bond type, government securities commanded a 36.55% share of the United States capital market exchange market in 2025, while corporate bonds are advancing at a 5.79% CAGR between 2026 and 2031.
- By geography, the Northeast commanded a 31.20% share of the United States capital market exchange market in 2025, while the West is advancing at a 5.11% CAGR between 2026 and 2031.
Note: Market size and forecast figures in this report are generated using Mordor Intelligence’s proprietary estimation framework, updated with the latest available data and insights as of 2026.
United States Capital Exchange Ecosystem Market Trends and Insights
Drivers Impact Analysis*
| Driver | (~) % Impact on CAGR Forecast | Geographic Relevance | Impact Timeline |
|---|---|---|---|
| Mainstream shift to algorithmic trading | +2.1% | National, with concentration in the Northeast and the West | Medium term (2-4 years) |
| Fed monetary policy normalization | +1.8% | National, with varying regional impacts | Short term (≤ 2 years) |
| Rising ESG-linked issuance | +1.4% | National, led by the West and the Northeast | Long term (≥ 4 years) |
| Surge in retail participation via zero-commission trading | +1.7% | National, with higher adoption in the South and West | Medium term (2-4 years) |
| Tokenization of securities enabling 24/7 trading | +0.9% | National, early adoption in the West | Long term (≥ 4 years) |
| Consolidated Tape implementation boosting transparency | +0.6% | National | Short term (≤ 2 years) |
| Source: Mordor Intelligence | |||
Mainstream shift to algorithmic trading
Algorithmic strategies now govern a majority of the United States equity executions, compelling exchanges to refine microsecond-level latency and scale messaging capacity to accommodate surging quote traffic. Sub-dollar shares doubled to 24% of total equity volume in May 2025, signalling that machine-learning models are harvesting liquidity pockets once overlooked by traditional desks[1]. Market makers are investing heavily in artificial-intelligence decision engines and quantum-inspired analytics to preserve edge as spreads compress. Cloud-hosted algo toolkits are democratizing access, allowing small firms to compete head-on with bulge-bracket players, which intensifies price competition and tightens retail execution quality. Exchanges are answering with richer depth-of-book feeds, flexible order types, and co-location expansions that attract latency-sensitive participants.
Fed monetary policy normalization
Rate increases initially reduced speculative leverage but soon stoked demand for risk-management instruments and electronic bond venues, with Treasury and SOFR futures gaining open interest as duration hedges. The Northeast posted faster GDP growth in 2024 than the national average despite tighter policy, highlighting regional resilience. Exchanges expanded fixed-income matching and broadened derivative listings to capture volatility-driven turnover. Higher yields sparked corporate refinancings that invigorated primary-debt issuance and diversified fee flows beyond equities. Venue operators are also layering inflation-protection tools to meet asset-owner hedging mandates in the new rate environment.
Rising ESG-linked issuance
ESG criteria have migrated from niche to mainstream, boosting green-bond supply across technology, healthcare, and industrial borrowers. Venues now stream tagged sustainability metrics in real time by partnering with ratings providers, enabling algorithm screens aligned to specific governance thresholds. SEC climate-disclosure proposals accelerate institutional mandates, pushing exchanges to create dedicated ESG trading segments and carbon-intensity indices[2]. Product innovation spans sustainability-linked bond futures and option overlays that let investors express thematic convictions with capital efficiency.
Surge in retail participation via zero-commission trading
The adoption of commission-free trading models has significantly accelerated the growth of new accounts, resulting in a notable increase in message traffic and a shift in trade sizes toward smaller transactions executed during extended trading hours. Brokerage firms are utilizing advanced machine-learning algorithms to optimize payment-for-order-flow mechanisms, focusing on achieving price improvements while maintaining a zero-fee structure. Retail-heavy securities are exhibiting heightened intraday volatility, prompting exchanges to implement enhanced limit-up/limit-down mechanisms and introduce fractional-share trading programs to ensure market stability and orderly operations. On a regional level, the South and West regions demonstrate the highest levels of retail trading activity, driven by factors such as population growth and increased adoption of technological advancements.
Restraints Impact Analysis*
| Restraint | (~) % Impact on CAGR Forecast | Geographic Relevance | Impact Timeline |
|---|---|---|---|
| Regulatory uncertainty for digital-asset securities | -1.2% | National, with varying state-level approaches | Medium term (2-4 years) |
| Cybersecurity threats to exchange operations | -0.8% | National, with a higher risk in major financial centres | Short term (≤ 2 years) |
| Escalating market-data fee disputes | -0.6% | National, with concentration in the Northeast and the West | Medium term (2-4 years) |
| Liquidity fragmentation across ATS venues | -0.5% | National, with primary impact on equity markets | Long term (≥ 4 years) |
| Source: Mordor Intelligence | |||
Regulatory uncertainty for digital-asset securities
The United States exchanges are navigating a complex and evolving regulatory framework established by the SEC, which categorizes digital assets into utility tokens, security tokens, and stablecoins. This segmentation requires the implementation of multiple compliance frameworks and the establishment of legal risk mitigation strategies, increasing operational complexity. Although the approval of Bitcoin ETFs has provided limited regulatory clarity, the absence of definitive registration pathways for tokenized-equity models continues to impede their broader adoption and integration into the financial ecosystem. This regulatory uncertainty places domestic exchanges at a competitive disadvantage, as offshore competitors operating under more stable regulatory environments are better positioned to capture market growth, potentially constraining revenue diversification opportunities for the US-based platforms. Additionally, prolonged delays in the SEC’s comment periods are extending capital expenditure cycles for digital-wallet custody infrastructure, further inflating operational cost structures and impacting profitability.
Cybersecurity threats to exchange operations
Malicious actors are increasingly employing distributed denial-of-service (DDoS) attacks, ransomware payloads, and supply-chain vulnerabilities to target critical components such as matching engines and data fabric within financial systems. In high-frequency trading environments, even brief outages measured in microseconds can result in substantial financial losses due to slippage, thereby elevating systemic risk thresholds. Regulatory requirements from the SEC mandate detailed incident reporting within four business days, which intensifies reputational risks and drives up insurance premiums for affected entities. To mitigate these challenges, exchanges are prioritizing investments in advanced security measures, including zero-trust perimeter frameworks, AI-powered anomaly detection systems, and geographically distributed hot-standby data centres to ensure operational continuity. Despite these efforts, residual risks persist, representing a significant operational constraint that requires ongoing strategic management and resource allocation.
*Our forecasts treat driver/restraint impacts as directional, not additive. The impact forecasts reflect baseline growth, mix effects, and variable interactions.
Segment Analysis
By Market Composition: Secondary Market Dominance Drives Innovation
The secondary arena held 91.05% of the United States capital market exchange market share in 2025, underscoring mature liquidity and robust electronic infrastructure. Venues continuously migrate core systems to cloud-native architectures that scale elastically during peak quote bursts, ensuring consistent latency for algorithmic participants. Alternative trading systems siphon block flow by offering anonymity and midpoint price improvement, yet public exchanges defend franchise positions through innovative order types such as auction-only crosses and retail liquidity programs. The primary segment is projected to post a 6.11% CAGR through 2031 as direct listings, SPAC conversions, and venture-stage IPOs proliferate, reflecting corporate enthusiasm for equity-based financing amid technology disruption.
Technology roadmaps reveal a shift toward continuous trading that will blur the boundary between issuance and secondary turnover. Nasdaq’s 24-hour framework hinges on synchronized clearing, surveillance, and corporate-action workflows targeting full rollout by late 2026 . Primary issuers could adopt multiple pricing windows within a day, enhancing capital-raising speed and global investor access. The United States capital market exchange market benefits as data-feed subscriptions and order-handling fees scale with time-zone expansion, bolstering top-line resilience.

By Capital Market Segment: Equity Leadership Amid Fixed-Income Renaissance
Stocks contributed 54.55% of overall activity in 2025, buoyed by ETF arbitrage, retail day-trading, and index-rebalancing flows that sustain deep two-sided markets. Derivative overlays such as options, gamma hedging, and delta-one swaps magnify equity volumes, providing venues with stable transaction-fee annuities. Bonds are projected to grow 4.12% annually through 2031 as rate volatility invites tactical allocation shifts and electronification dismantles historic voice-broker dominance. Institutional desks leverage auto-RFQ protocols to source all-to-all liquidity, compressing corporate-bond bid-ask spreads and lifting executed ticket counts.
Regionally disparate inflation trends influence asset-mix decisions: shelter-driven Northeast CPI elevates demand for Treasury hedges, while booming Southern employment lifts equity risk appetite. ESG overlays broaden both segments, with exchanges listing green-bond ETFs and low-carbon equity baskets to satisfy sustainability mandates. As multiproduct venues integrate matching for cash, derivatives, and financing, cross-margin efficiency attracts larger portfolios, helping cement the United States capital market exchange market as the global liquidity benchmark.
By Stock Type: Growth Stocks Lead Innovation-Driven Rally
Growth stocks are expected to climb at an 8.75% CAGR to 2031, outpacing defensive cohorts as investors concentrate on artificial intelligence, cloud, and cybersecurity themes. The top-ten constituents now represent over 30% of S&P 500 capitalization, reviving debates about systemic concentration and index methodology. Common and preferred securities, holding 47.10% share, retain foundational status for dividend stability and governance rights that underpin liability-matching institution strategies.
Quantitative investment approaches exploit factor volatility to toggle exposures between value, quality, and momentum baskets, driving turnover and providing liquidity across capitalization tiers. Exchanges support thematic segmentation by launching sector-specific listing categories and tailored data files, further reinforcing their role as innovation hubs. Active-share ETPs and option-enhanced wrappers diversify revenue streams while deepening tradeable instruments for growth exposures.
By Bond Type: Corporate Bonds Gain Momentum Amid Diversification
Government securities maintained a 36.55% share of fixed-income value in 2025, anchoring the yield curve and serving as macro hedge vehicles during volatility spikes. Corporate issuance, however, is poised for a 5.79% CAGR, fuelled by refinancing needs and investors’ search for incremental spread pickup. ESG-linked corporate structures, including step-up coupons tied to emissions targets, proliferate across investment-grade and high-yield tiers, attracting dedicated sustainability funds.
Electronification of dealer workflows supports auto-executable odd-lot corporates, broadening access for smaller asset managers and wealth platforms. The Consolidated Audit Trail’s extension into bonds bolsters surveillance and investor confidence, which in turn lifts liquidity. Municipal borrowing benefits from infrastructure-bill disbursements, while mortgage-backed activity benefits from algorithmically optimized duration hedging as prepayment speeds fluctuate. Together, these trends reinforce diversified fee inflows for the United States capital market exchange.
Geography Analysis
The Northeast retained a 31.20% share in 2025 due to its dense concentration of broker-dealers, asset managers, and regulatory talent pools. April 2025 unemployment reached 4.2%, converging on national levels, while core inflation hovered near 3%, driven by high shelter costs that pressured real wages . Office market vacancies in Boston and New York climbed, spawning distressed-debt trading opportunities and heightening REIT turnover that secures fee revenue for exchanges. Fintech sandboxes in Massachusetts and New York accelerate regulatory-compliant pilots for tokenized securities and T+0 settlement, reinforcing regional leadership in market-structure innovation.
The West is forecast to expand at a 5.11% CAGR through 2031, propelled by Silicon Valley venture activity, abundant engineering talent, and a pipeline of growth-stage IPOs. Regional venues pioneer crypto-equity hybrids, continuous matching, and high-bandwidth cloud gateways that handle the large message footprints typical of algorithmic quoting. Demographic inflows to California, Washington, and Utah sustain entrepreneurial ecosystems that demand capital-formation services, while tech employee liquidity programs feed secondary-market trading volumes.
Southern and Midwestern hubs offer diversification and cost advantages that underpin national stability. Population migration to Texas and Florida is driving SME listings, municipal-bond issuance, and increased derivative hedging related to energy markets. Midwest exchanges leverage agricultural futures heritage to expand cross-asset clearing, attracting corporate treasury desks that hedge raw-material exposures alongside FX and interest-rate risk. Distributed dual-site data centers located across these regions reinforce overall United States capital market exchange market resilience and demonstrably reduce single-point-of-failure risk.
Regulatory Landscape
The United States capital exchange ecosystem operates under SEC oversight for national securities exchanges, broker-dealers, and market structure, with rulemaking and implementation timelines shaping technology and compliance spend. In July 2026, the SEC published its 2026 regulatory agenda covering roughly 38 action items, while elevating deregulatory priorities under Executive Order 14192. The agenda also includes initiatives tied to modernizing proxy rules, broker-dealer books-and-records requirements, and clarifying crypto-asset regulation.
Market participants are also working through staggered compliance deadlines and consultation cycles that affect trading transparency and post-trade readiness. The SEC extended compliance dates for its Short Sale Rule and Securities Lending Rule to January 2, 2028 and September 28, 2028, respectively. The Registered Offering Reform proposal was published in the Federal Register on May 26, 2026, with a 60-day comment period ending July 27, 2026, keeping issuer-access and offering-process modernization on the 2026 planning agenda.
Value Chain Analysis
The value chain runs from issuer onboarding and listing (primary markets) to trading and liquidity provision (secondary markets), market data and indices, and then post-trade clearing and settlement. Exchange groups such as Nasdaq and Cboe bundle listings, matching engines across multiple asset classes, proprietary connectivity, and recurring data and analytics products, and Nasdaq’s scale of issuer relationships supports downstream trading and data consumption. As of March 31, 2026, Nasdaq supported 5,677 listed companies.
Post-trade infrastructure and alternative venues influence how order flow translates into executed volume and monetizable data. DTCC anchors settlement for US securities and is advancing DTC-registered digital wallet and blockchain-linked capabilities for tokenized asset settlement, while OTC Markets Group provides tiered markets (OTCQX, OTCQB) and the OTC Link ECN for issuers and liquidity outside national exchange listings. In derivatives and options, Cboe emphasizes a vertically integrated stack that combines products, market data, indices, analytics, and connectivity, supporting fast-growing ultra-short-dated option workflows and the associated data demand.
Competitive Landscape
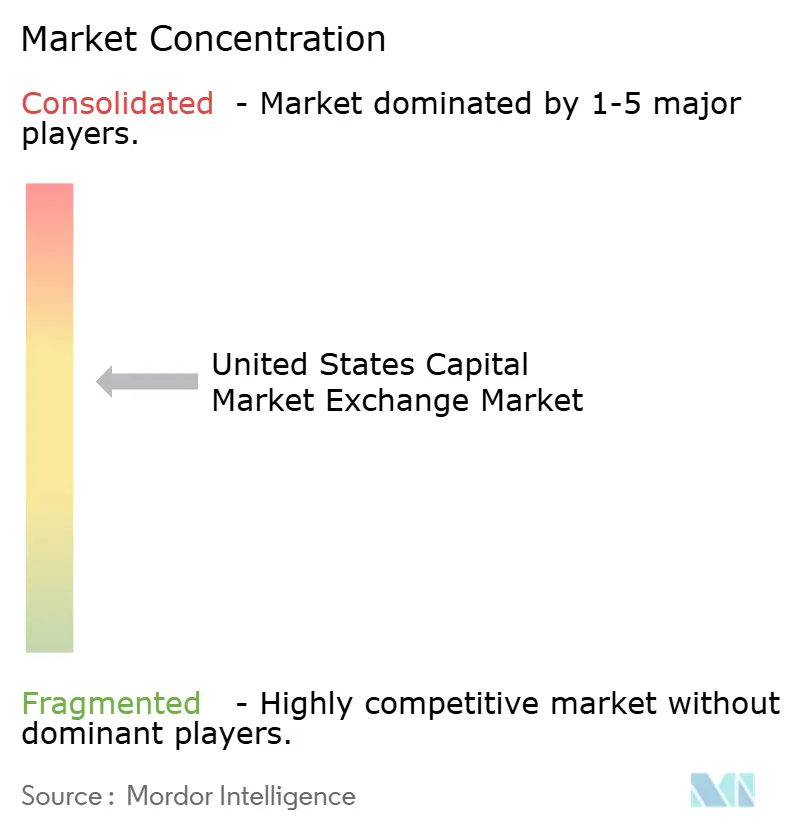
The United States capital market exchange market exhibits moderate concentration, with five primary venues controlling a significant share of 2024 turnover. NYSE, Nasdaq, and Cboe compete through latency-optimized infrastructures, diverse listing packages, and strategic acquisitions that expand service coverage in derivatives and digital assets. Challenger platforms such as MEMX, IEX, and the Long-Term Stock Exchange target fee compression and transparency gaps, capturing incremental share as buy-side routing logic prioritizes cost-effective (“maker-taker neutral”) venues.
Technology differentiation remains the chief battleground. Nasdaq’s AWS partnership accelerates data analytics and reduces time-to-market for product launches, while NYSE leverages ICE’s global commodity reach to cross-sell futures connectivity. Consolidated Audit Trail compliance and T+1 settlement cycles elevate fixed-cost baselines, potentially triggering niche-venue consolidation or cooperative resource sharing. Exchanges also vie for sustainability leadership by offering ESG-badge visibility, discounted listing fees for verified green issuers, and climate-risk analytics that embed directly into order-routing dashboards.
White-space expansion focuses on 24/7 trading and tokenization. NYSE Texas launched as an ETP listing venue in May 2025, signaling geographic expansion as legacy brands localize services to capture regional sponsorship. Over the forecast window, leadership will rest with operators that bundle issuance, trading, data, and post-trade utilities in unified SaaS frameworks, ultimately raising switching costs and deepening customer engagement.
United States Capital Exchange Ecosystem Industry Leaders
-
New York Stock Exchange (NYSE)
-
Nasdaq, Inc.
-
Cboe Global Markets
-
OTC Markets Group
-
Investors Exchange (IEX)
- *Disclaimer: Major Players sorted in no particular order
Market Opportunities and Future Outlook
Regulatory modernization around capital formation and issuer access creates a specific opportunity for exchanges and service providers that monetize listings, issuer services, and related market data. The SECs Registered Offering Reform proposal (Release No. 33-11418, File No. S7-2026-17), published in the Federal Register on May 26, 2026 with comments due July 27, 2026, targets a more efficient registered offering framework. The proposal includes changes such as removing certain Form S-3 eligibility constraints, which supports product and workflow investments across listing, disclosure tooling, and distribution.
Tokenized securities and extended trading windows are also becoming tangible platform build-outs rather than only experimentation, creating scope for new data products, surveillance tooling, and post-trade interoperability. DTCC and Nasdaq completed a tokenized-format processing test run on July 15, 2026 and positioned a Tokenization Service launch for October 2026, while Cboe has pursued regulatory approvals tied to extended trading hours in options. This alignment of exchange roadmaps with more continuous market access is also pulling through supporting market-data and risk-management infrastructure.
Recent Industry Developments
- July 2026: Cboe Global Markets has scheduled launch of pre- and post-market trading sessions for select multi-listed equity options. The move expands trading hours for options products, potentially increasing intraday liquidity and investor engagement. The extended window strengthens venue differentiation and liquidity support.
- June 2026: Nasdaq, Inc. selected Pyth Network to distribute Nasdaq TotalView market data on-chain for blockchain-based applications. The initiative introduces on-chain market data distribution to the ecosystem. It accelerates blockchain-native data accessibility and supports crypto-asset workflows within the US capital markets ecosystem.
- March 2026: Nasdaq, Inc. partnered with Payward to develop an xStocks-powered gateway connecting tokenized equities with decentralized networks. The collaboration creates a tokenized equities gateway. It bridges traditional and tokenized markets, advancing tokenized securities infrastructure.
Research Methodology Framework and Report Scope
Market Definition and Coverage
For this study, the US capital market exchange ecosystem is sized as the revenues generated from services that enable issuance, trading, clearing, settlement, and related market infrastructure for stocks and bonds within the United States.
Scope exclusions: This sizing excludes the market value of securities themselves and investor portfolio returns, and it also excludes purely off-exchange bilateral activity where exchange and clearing infrastructure is not used.
Segmentation Overview
- By Market Composition
- Primary Market
- Secondary Market
- By Capital Market Segment
- Stocks
- Bonds
- By Stock Type
- Common & Preferred Stock
- Growth Stock
- Value Stock
- Defensive Stock
- By Bond Type
- Government Bonds
- Corporate Bonds
- Municipal Bonds
- Mortgage Bonds
- Other Bond Types
- By Geography
- Northeast
- Midwest
- South
- West
Data Sources, Market Sizing, and Validation
Desk Research
Desk work starts with mapping where measurable revenue is created in the exchange ecosystem, then aligning that revenue logic to public activity indicators. We typically use sources such as SEC market-structure publications, FINRA statistics, Federal Reserve releases on debt and credit markets, and US Census and BEA macro series to keep the demand environment realistic.
To connect activity to dollars, we review exchange and infrastructure operator filings, investor presentations, and audited annual reports, then supplement with reputable press coverage on fee changes, rule updates, and new products. Where gaps remain, paid subscriptions are used for company financials and intelligence, news and financials screening, and patent database checks to sanity-check technology-driven shifts. These desk research sources are illustrative only, and many other public and paid references were used to collect, verify, and clarify data points.
Primary Interviews and Surveys
Primary validation is done through expert interviews and structured surveys with exchange ecosystem participants, including infrastructure providers, market intermediaries, and buy-side and sell-side users who can explain fee drivers and volume patterns. Coverage is built across major US trading hubs and end-user groups so assumptions on pricing, mix, and adoption are checked, then refined before finalizing the model.
Distribution of primary research fieldwork respondents
| Company type | Respondent position |
|---|---|
| Top tier: 29% | CXOs: 12% |
| Mid tier: 53% | Functional/Unit leaders: 35% |
| Smaller Players: 18% | Managers: 53% |
Market-Sizing & Forecasting
Sizing is first reconstructed using a top-down approach where US equities and bonds issuance plus secondary trading activity are translated into an addressable revenue pool for exchange and post-trade services. Once that structure is in place, totals are corroborated using selective bottom-up approximations, such as sampled price schedules applied to observed volumes, plus supplier revenue cross-checks, which are then used to adjust outliers.
Key inputs in the model include cash equity trading volumes, listed derivatives participation where it affects related infrastructure spend, the number of new listings and follow-on issuance, bond issuance and outstanding trends, clearing and settlement fee trends, and the ongoing effects of settlement cycle changes such as T+1. Forecasts rely mainly on scenario analysis, where macro indicators and capital raising cycles are translated into volume and pricing paths, then refined using expert expectations on mix shifts between primary and secondary activity.
When revenue disclosures do not match the required scope, gaps are handled by using conservative ranges tied to the disclosed business mix, then validated against multiple external signals before the final number is locked.
Data Validation & Update Cycle
Outputs are checked through several layers, starting with internal consistency tests, then comparisons against independent market signals such as issuance cycles, trading activity, and reported fee schedule changes. If a variance appears large, the underlying assumptions are reviewed again, and follow-up calls are triggered to confirm whether the driver is scope, timing, or a structural market change.
Before sign-off, assumptions and calculations are reviewed by another analyst to reduce avoidable errors, and the final tables are rechecked for year-over-year logic. Reports are refreshed annually, and material events can trigger interim updates, followed by a last pre-delivery review so clients receive the most current view.
Mordor Intelligence's US Capital Market Exchange Ecosystem Market Size Measured Against Other Published Estimates
Published market values for this topic often do not align because the underlying definition of what counts as the exchange ecosystem is not consistent, and because some estimates mix activity metrics with revenue metrics. Differences also come from how pricing is modeled over time and whether the numbers are kept current with recent market-structure changes.
The biggest gaps usually appear when a source adds adjacent areas like custody, tokenized asset infrastructure, or broad capital markets spending, instead of keeping the scope tied to exchange and post-trade services for stocks and bonds. Timing choices matter as well, since using different base years, average FX assumptions, or untested fee progression can change the value, and the table spread is most visible where the included product set and settlement-related assumptions are treated differently by Mordor Intelligence.
Benchmark comparison
| Source | Market Size | Gaps in Research Methodology |
|---|---|---|
| Mordor Intelligence | USD 656.42 B (2026) | |
| Industry Publisher A | USD 223.40 B (2026) | Uses a narrower interpretation that appears closer to exchange only revenues, and it likely leaves out a wider set of post-trade and supporting infrastructure revenues that are included when sizing the full ecosystem. |
| Industry Publisher B | USD 473.31 B (2035) | Uses a longer forecast window and a higher growth path, and the scope language indicates inclusion of tokenized assets and broader infrastructure categories, which shifts the size and makes year matching difficult. |
The comparison shows that the spread is mainly explained by scope boundaries and how activity is translated into monetized revenue streams, followed by base year alignment and pricing progression choices. By tying the model to observable issuance and trading indicators and then cross-checking against disclosed revenue pools, the sizing stays traceable to repeatable steps even when public reporting granularity is uneven.
Key Questions Answered in the Report
What is the projected value of the United States capital market by 2031?
Forecasts place the United States capital market exchange market size at USD 896.67 billion by 2031, reflecting a 6.45% CAGR from 2026 levels.
Which trading venue segment currently dominates transaction activity?
The secondary segment leads with 91.05% market share, underlining its deep liquidity and mature electronic infrastructure.
Which U.S. region is experiencing the fastest expansion in exchange activity?
The West is projected to grow at a 5.11% CAGR through 2031, supported by Silicon Valley’s technology ecosystem and venture-driven IPO pipelines.
Why are corporate bonds gaining traction with investors?
Rising corporate issuance, ESG-linked financing structures, and the shift to electronic dealer workflows are driving a 5.79% CAGR in corporate-bond turnover.
How are exchanges adapting to rapid growth in retail trading?
Platforms are adding fractional-share functionality, extended hours, richer educational analytics, and refined order types to accommodate smaller lots and maintain execution quality
What technology initiative could most transform U.S. exchange competition?
Broad adoption of 24/7 trading infrastructure and tokenized security settlement is poised to reshape market access and settlement cycles over the next five years.