
United States Camping And Caravanning Market Size and Share
Market Overview
| Study Period | 2020 - 2031 |
|---|---|
| Forecast Data Period | 2026 - 2031 |
| Base Year Market Size (2025) | USD 27.87 Billion |
| Market Size (2026) | USD 29.89 Billion |
| Market Size (2031) | USD 42.35 Billion |
| Growth Rate (2026 - 2031) | 7.23 % |
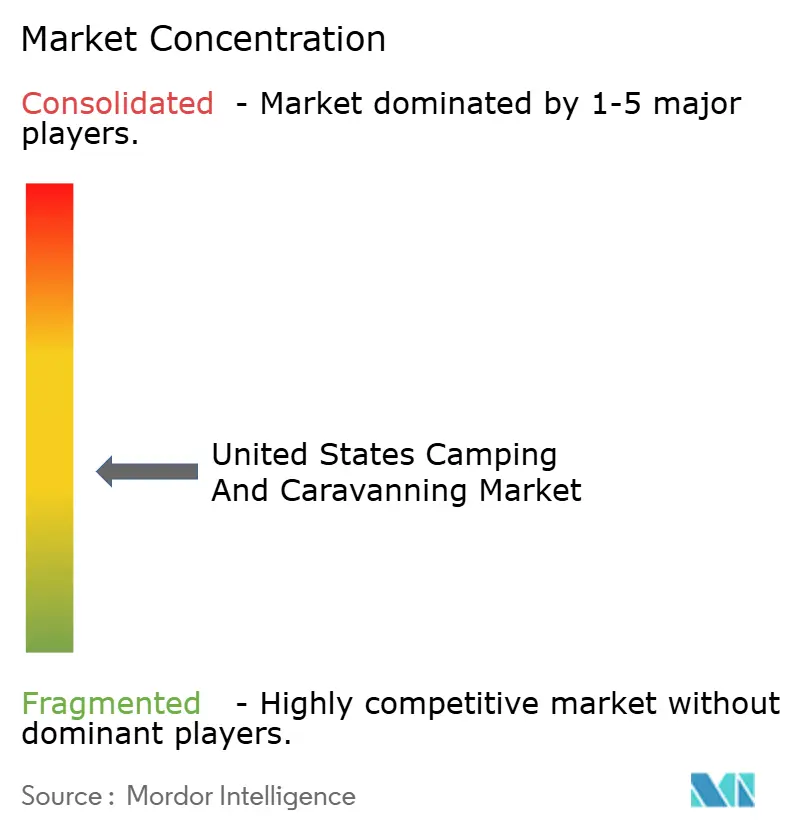
| Market Concentration | Medium |
Major Players *Disclaimer: Major Players sorted in no particular order Image © Mordor Intelligence. Reuse requires attribution under CC BY 4.0. | |
United States Camping And Caravanning Market Analysis by Mordor Intelligence
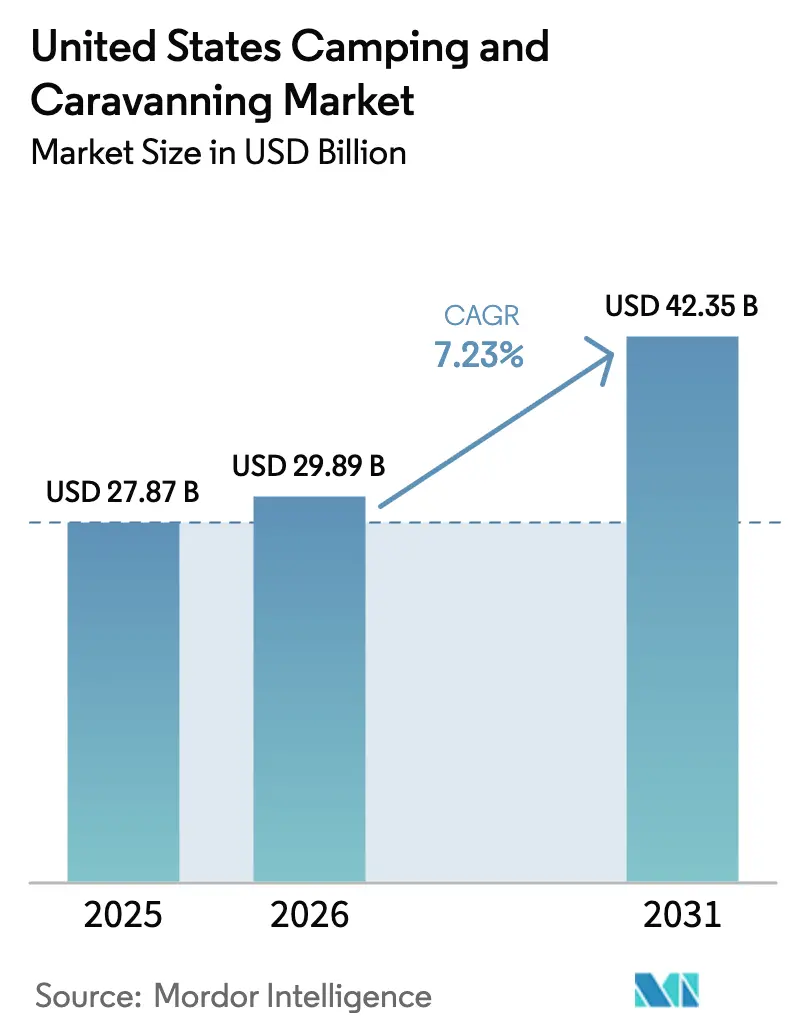
The United States camping and caravanning market size is expected to grow from USD 27.87 billion in 2025 to USD 29.89 billion in 2026 and is forecast to reach USD 42.35 billion by 2031 at 7.23% CAGR over 2026-2031. The United States camping and caravanning market continues to benefit from a structural upturn in outdoor‐recreation demand, as 11 million additional households have adopted camping lifestyles compared with 2019 baselines [1]. Public and private investments, such as Alabama's initiative to revamp state parks and KOA's deployment of EV-charging infrastructure across 28 properties, underscore a long-term strategic commitment to the U.S. camping and caravanning market. These investments highlight efforts to enhance infrastructure, expand capacity, and improve customer experiences, reflecting a positive growth outlook for the market. Furthermore, the integration of advanced technologies, including AI-powered revenue management systems and mobile self-check-in kiosks, is enabling businesses to optimize operational efficiency, reduce costs, and strengthen customer retention. These technological advancements are playing a critical role in driving profitability and fostering loyalty across the industry ecosystem.
Key Report Takeaways
- By destination type, privately owned campgrounds held 36.71% of the United States camping and caravanning market share in 2025, whereas backcountry and wilderness areas are forecast to achieve a 9.21% CAGR to 2031.
- By type of camper, RV camping contributed 42.74% of the United States camping and caravanning market in 2025 revenue, while backpacking is positioned for an 8.62% CAGR through 2031.
- By distribution channel, direct sales captured 55.62% of the United States camping and caravanning market in 2025 bookings, yet online travel agencies are projected to deliver a 11.58% CAGR during the forecast horizon.
- The South generated 33.84% of the United States camping and caravanning market of the 2025 revenue, but the West is slated for the fastest 7.84% CAGR owing to national park proximity and adventure tourism depth.
Note: Market size and forecast figures in this report are generated using Mordor Intelligence’s proprietary estimation framework, updated with the latest available data and insights as of 2026.
Worldwide, activity is shaped by contributions from multiple regions, with Americas representing one of the more structurally developed among them. The global report on camping and caravanning market by Mordor Intelligence reflects how these regional layers combine into a single system.
Market Trends and Insights
Drivers Impact Analysis of United States Camping And Caravanning Market*
| Driver | (~) % Impact on CAGR Forecast | Geographic Relevance | Impact Timeline |
|---|---|---|---|
| Post-pandemic outdoor recreation boom | +1.2% | National; gains largest in South and West | Medium term (2-4 years) |
| Surging RV ownership among millennials & Gen Z | +1.8% | Nationwide, concentrated in suburban metros | Long term (≥ 4 years) |
| Infrastructure upgrades in state-park campgrounds | +1.5% | Kentucky, Alabama, Oregon, Texas | Medium term (2-4 years) |
| Work-from-anywhere lifestyle fuelling van-life stays | +0.9% | National; early adoption across Western corridors | Short term (≤ 2 years) |
| Private-equity roll-ups are professionalizing campground chains | +1.1% | Destination hot spots, including coastal Florida and mountain Utah | Long term (≥ 4 years) |
| AI-powered dynamic pricing tools are boosting site utilization | +0.8% | Large multistate operators and franchise systems | Short term (≤ 2 years) |
| Source: Mordor Intelligence | |||
Post-Pandemic Outdoor Recreation Boom Drives Mainstream Adoption
Outdoor recreation added USD 639.5 billion to the U.S. gross domestic product in 2024, with RV-related activities alone delivering USD 26.3 billion in direct value [3]. The United States reported 175.8 million participants in camping and caravanning activities, underscoring the market's role as a vital and growing segment within the nation's leisure spending landscape. This participation level reflects the increasing consumer preference for outdoor recreational activities, driven by factors such as rising disposable incomes, a growing emphasis on wellness, and the appeal of nature-based experiences. This surge transcends income brackets because state parks, gear-rental programs, and discounted public-land passes have lowered access barriers. Annual direct spending tied to camping now totals USD 61 billion and cycles through fuel stations, convenience stores, outfitting shops, and guide services, reinforcing community economic resilience.
Millennial and Generation Z RV Ownership Transforms Market Demographics
First-time RV buyers represent 36% of sales as rental trials via peer-to-peer platforms convert renters into owners [2]. Younger buyers prefer nimble campervans, hybrid pop-ups, and Class B rigs that fit into urban parking dimensions and plug into standard household outlets, redefining product portfolios among leading manufacturers. Social-connectivity requirements push campground operators to upgrade to fibre internet, individual Wi-Fi mesh nodes, and smart-lock shower facilities that guests can reserve in-app. Visual storytelling on Instagram and TikTok elevates the demand for photogenic communal spaces, mural walls, and star-gazing decks, an evolution that keeps the United States camping and caravanning market aligned with broader experience-economy trends. Additionally, the incorporation of remote-work amenities, covered cowork patios, ergonomic seating, and multi-device charging stations converts transient stays into week-long residencies that smooth mid-week demand volatility.
State-Park Infrastructure Modernization Catalyzes Capacity Expansion
The state of Alabama allocated USD 150 million through a bond issuance to enhance infrastructure within its parks. This funding was directed toward upgrading electrical systems to 50-amp capacity, modernizing bathhouse facilities, and constructing ADA-compliant ramps. These improvements have significantly increased the availability of reservable pads, thereby enhancing accessibility and user experience across the park system. Kentucky has allocated USD 40 million to expand sites designed to accommodate fifth wheels, reflecting a strategic investment in outdoor tourism. This decision highlights a bipartisan understanding of the sector's economic impact, particularly its ability to drive growth in local retail and dining industries through increased visitor spending and related activities. Such investments shrink peak-season waitlists, raise visitor satisfaction, and elevate occupancy ceilings. These capital flows hardwire scalability into the United States camping and caravanning market.
Work-From-Anywhere Culture Enables Extended-Stay Demand
The digital-nomad population swelled to 17 million in 2024, a 131% gain since 2019, driving month-long stay requests that conventional hotels rarely satisfy. Operators that integrated advanced features such as gigabit-speed internet, shaded desk pods, and privacy-screen-equipped meeting rooms demonstrated a notable increase in shoulder-season occupancy rates. This performance highlights the competitive advantage provided by enhanced amenities in attracting and retaining clients during off-peak periods, compared to operators that do not offer similar facilities. Longer stays translate into recurring ancillary purchases, propane refills, kayak rentals, pet daycare, and reduce guest acquisition cost because fewer check-ins are required to fill calendars. Rigs outfitted with solar arrays and lithium batteries dovetail with campground microgrids, slicing generator noise pollution and aligning with Leave-No-Trace ethics that younger travellers champion. Municipalities recognizing this economic upside are carving out extended-stay zoning overlays, thereby directly shaping the growth arcs inside the United States camping and caravanning market.
Restraints Impact Analysis of United States Camping And Caravanning Market*
| Restraint | (~) % Impact on CAGR Forecast | Geographic Relevance | Impact Timeline |
|---|---|---|---|
| Rising land and insurance costs | -1.4% | Coastal Carolinas, Sierra Nevada, Rockies | Long term (≥ 4 years) |
| Stringent zoning regulations | -0.7% | Suburban fringes of Atlanta, Denver, and Austin | Long term (≥ 4 years) |
| Growing wildfire frequency | -0.5% | California, Oregon, Washington | Medium term (2-4 years) |
| Short-term rental legislation spills over to RV sites | -0.3% | Resort towns such as Sedona and Asheville | Short term (≤ 2 years) |
| Source: Mordor Intelligence | |||
Rising Operational Costs Pressure Campground Margins
Property-insurance premiums rose at double-digit clips through 2024 as carriers recalibrated actuarial models to inflation, supply-chain volatility, and weather extremes. Premium escalation squeezes small-park operators lacking multi-property risk pools, driving some to divest at valuations favourable to larger chains. Land values in coastal and mountain corridors have climbed faster than national farmland averages, lifting carrying costs and lengthening payback periods. Tight labour markets compel operators to offer on-site staff housing, tuition subsidies, or retention bonuses, inflating payroll expense structures. These cost vectors collectively erode margins, tempering the expansion pace within the United States camping and caravanning market.
Wildfire Frequency Restricts Access to Premium Destinations
The 2024 fire season forced full or partial shutdowns at Mount Rainier, Death Valley, and Sequoia & Kings Canyon national parks. Even unaffected private parks experienced cancellations due to poor air quality or travel advisories. State-mandated defensible-space clearances require costly tree thinning and brush removal, straining capital budgets. Rising deductibles and exclusions for fire peril drive insurance underwriters to demand higher premium deposits or impose acreage caps, pushing some operators to self-insure portions of risk. The geographic concentration of wildfires in high-value scenic corridors amplifies revenue volatility across the United States camping and caravanning market.
*Our forecasts treat driver/restraint impacts as directional, not additive. The impact forecasts reflect baseline growth, mix effects, and variable interactions.
United States Camping And Caravanning Market Segment Analysis
By Destination Type:
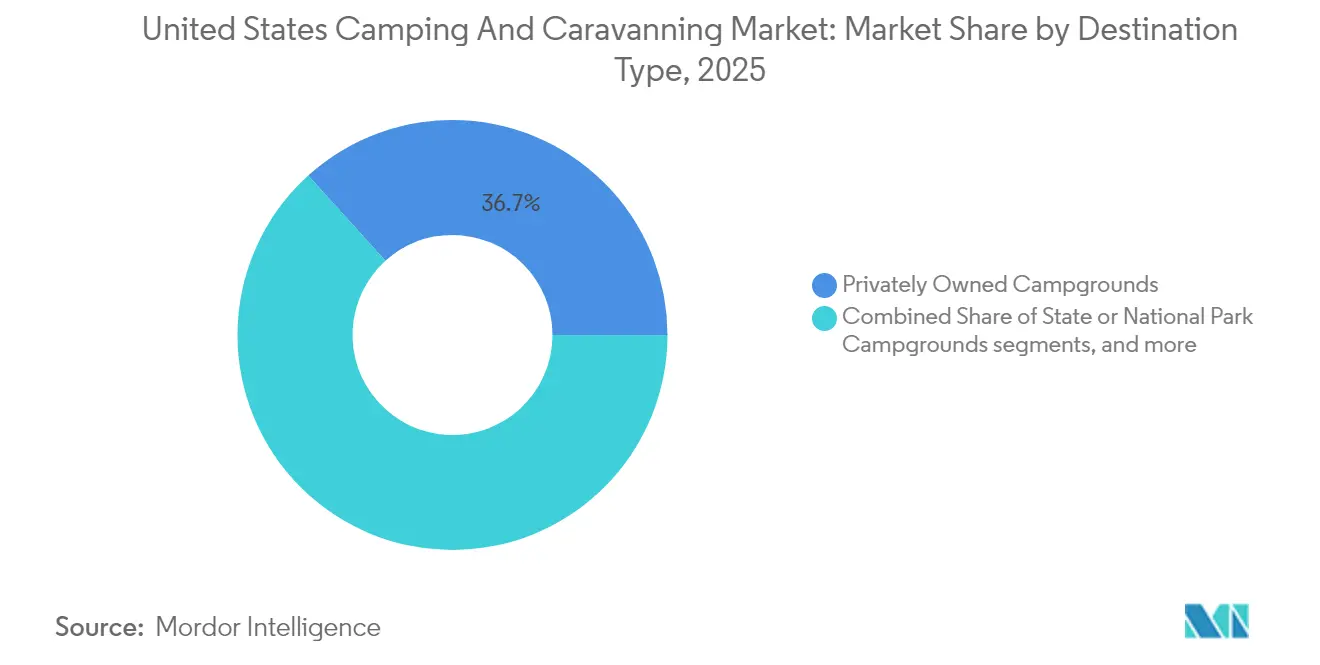
Private Operators Dominate While Wilderness Segments AcceleratePrivately owned campgrounds generated 36.71% of 2025 revenue, underscoring the United States camping and caravanning market size advantage enjoyed by agile operators capable of rapid amenity refreshes and dynamic pricing pivots. Their independence from legislative budget cycles enables quicker adoption of resort-style upgrades such as lazy-river pools, dog parks, and rentable Airstreams. Data-driven membership programs nurture loyalty and fill mid-week gaps, supporting year-round labour retention.
Backcountry and wilderness areas are slated for a 9.21% CAGR through 2031, propelled by experiential travel motivations and widespread social-media amplification. Public-land agencies monetize demand via campsite fees funnelled into trail maintenance, while outfitters provide gear rentals and guided treks to newcomers seeking safety in remote terrains. Limited overnight capacity safeguards ecological integrity, unintentionally preserving premium pricing leverage within this niche of the United States camping and caravanning market. Other destination categories, parking-lot boondocking, private-land marketplaces like Hipcamp, and harvest-host farm stays, fit overflow demand scenarios and specialized tastes. Their permissive cost structures foster entrepreneurial experimentation, from pop-up movie nights to gourmet-food-truck rallies, adding cultural diversity to supply options.

By Type of Camper:
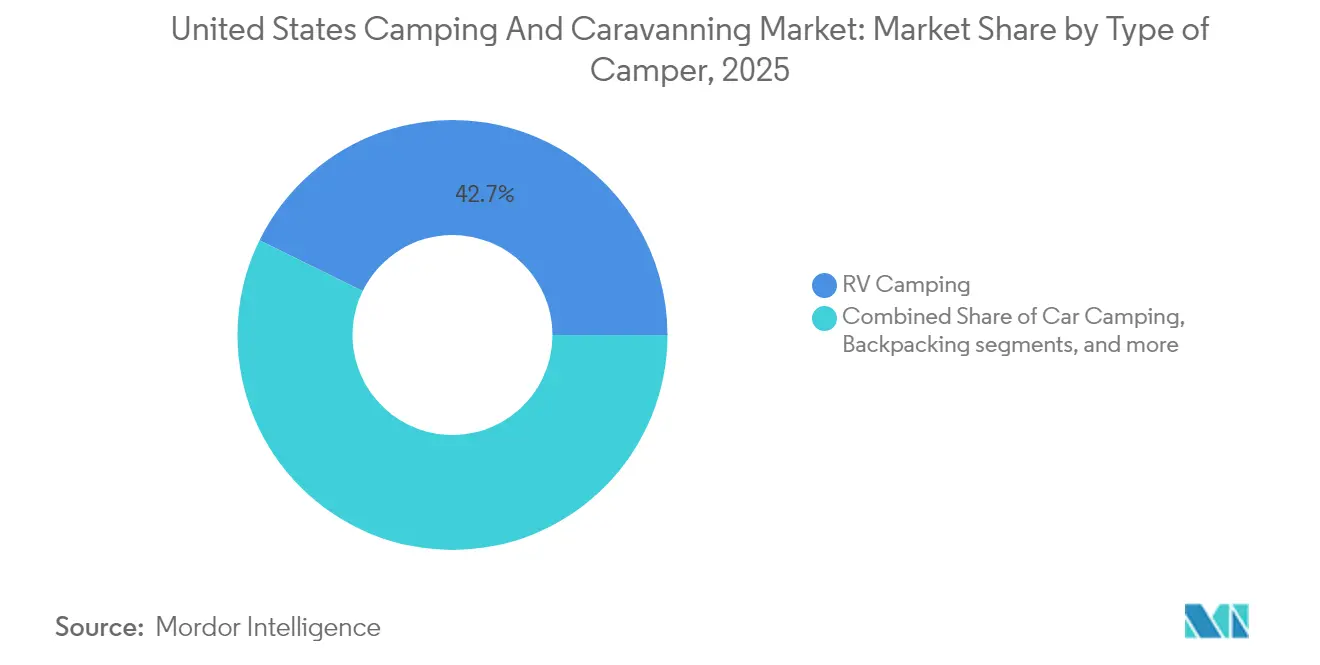
RV Dominance Persists Despite Backpacking AccelerationRV camping captured 42.74% of 2025 spend, a testament to mature service infrastructure that includes 24/7 roadside assistance, abundant waste-dump stations, and parts inventories. Electrified models such as Winnebago’s eRV2 prototype promise near-silent campsite operation and reduced carbon footprints, satisfying eco-conscious families eager for comfort and sustainability parity. High residual values reinforce buyer confidence and bolster financing availability, further entrenching RV leadership inside the United States camping and caravanning market.
Backpacking’s projected 8.62% CAGR aligns with younger consumers’ minimalism and quest for authenticity. Ultralight tents, subscription gear boxes, and GPS-enabled safety beacons lower entry barriers, while digital route-planning tools demystify multi-day itineraries. Retailers organize intro workshops that channel new participants into guided tours, cultivating a pipeline of repeat customers. Car camping and glamping formats occupy the middle ground; they lure style-seeking travellers who want real mattresses and climate control but eschew towing responsibilities. Marriott’s 2024 acquisition of Postcard Cabins validates mainstream appetite for hybrid outdoor accommodations.
By Distribution Channel:
Digital Transformation Accelerates Despite Direct Sales DominanceDirect reservations retained 55.62% of 2025 bookings, highlighting the enduring magnetism of brand websites that cater to loyalists through tiered reward points and site-preference memory. Operators exploit owned channels to bundle firewood delivery, linen rental, and late checkout, raising per-booking revenue. APIs integrate real-time availability with corporate travel systems, enabling companies to stage off-site retreats in nature yet preserve compliance audit trails.
Online travel agencies are forecast to post a 11.58% CAGR as generation-native app users prize frictionless booking. Aggregators rank sites by verified guest reviews, photo quality, and amenity filters, speeding decision cycles for novice campers uncomfortable navigating disparate owner websites. Some campgrounds deploy differential pricing, advertised rate parity during low seasons, and premium markup during holidays, to balance OTA visibility and commission costs. By 2030, predictive meta-search engines could auto-assemble full itineraries combining RV rentals, campground stays, and activity tickets, expanding transactional scope across the United States camping and caravanning market.
Geography Analysis
Southern United States Camping and Caravanning Market
The South contributed 33.84% of 2025 revenue on the back of mild winters, extensive interstate networks, and a tradition of snowbird migration. States like Florida and Texas layer campground amenities onto broader tourism draws, encouraging dual-purpose trips that mix beach leisure with inland nature stays. Competitive dynamics revolve around upselling boat slips, fishing charters, and coastal ecotour packages, weaving multi-day itineraries that prolong visitor spend.
Western, Northeastern and Midwestern United States Camping and Caravanning Market
The West is set for an 7.84% CAGR through 2031, leveraging unparalleled national-park clusters and a deep-rooted adventure ethos. Yet volatility is baked in: wildfire smoke, mudslide-triggered road closures, and drought-driven water restrictions all loom as operational contingencies. Infrastructure projects like Love’s Travel Stops’ NEVI-funded charging corridors are mitigating range anxiety for electric RV travelers, broadening demand channels. The Northeast and Midwest wield dense resident populations within a day’s drive, enabling weekend getaways that fill Friday-to-Sunday septets. Fall foliage, maple-syrup festivals, and lake-focused recreation anchor seasonal peaks. Operators test insulated safari tents and geothermal bathhouses to lengthen usage windows into late November. While capital intensity is higher due to heating and snow-load engineering, revenue diversification through winterized cabins buffers off-season drop-offs.
Mordor Intelligence provides coverage of the camping and caravanning market across other key regional markets, including Europe, each with their regulatory frameworks and demand patterns.
Regulatory Landscape
The United States camping and caravanning market operates under a multi-layer regulatory stack spanning public-land access, vehicle safety, and local land-use controls. RV product safety, defect reporting, and recall execution are overseen by the National Highway Traffic Safety Administration (NHTSA), which affects OEM engineering and aftermarket service practices that, in turn, shape campground maintenance and guest-safety expectations. On the demand side, federal public-land inventory is operationalized through the National Park Service and other agencies via Recreation.gov. Reservation rules and capacity management on these platforms influence peak-season availability and can redirect some overflow toward private parks and alternative land-stay platforms.
Permitting and day-to-day operations are also shaped by local zoning, health and environmental compliance for water and wastewater systems, and accessibility requirements. In many suburban and resort corridors, community opposition and entitlement timelines constrain greenfield development. California Air Resources Board (CARB) standards intersect with emissions-related requirements for generators and powertrain-related engineering choices, reinforcing operator interest in higher-amperage electrical upgrades and, in some states, EV-charging-ready sites as a compliance-aligned amenity.
Value Chain Analysis
The value chain starts with RV and camping-equipment manufacturers and dealers, then extends to campground real estate owners (public agencies, private independents, and chains), reservation and property-management technology providers, and on-site service partners. Midstream, chain and franchise systems such as Kampgrounds of America (KOA) standardize operating playbooks, amenity baselines, and marketing to aggregate demand, while operators monitor performance with hospitality-style KPIs such as occupancy, ADR, and revenue per available site. Distribution is split across direct brand websites and call centers, plus third-party channels such as online travel agencies and marketplace platforms.
Operational inputs include utility contractors (electrical upgrades to 50-amp service, water and wastewater infrastructure), connectivity providers (fiber backhaul, Wi-Fi mesh), and add-on experience suppliers such as rentals, guided activities, and retail and F&B. Technology has become a core enabler throughout the chain, with PMS and revenue-management tools supporting dynamic pricing and site utilization. Investments in EV charging and digital guest workflows (check-in, access control, service requests) can increase throughput and raise attachment rates for ancillary spend. Industry norms for responsible use are reinforced through partnerships and programs aligned with organizations such as Leave No Trace, which support land stewardship practices that protect destination capacity over time.
Competitive Landscape
The camping and caravanning market in the United States is characterized by moderate fragmentation, with the top five operators collectively contributing one-fourth of the total revenue. Kampgrounds of America (KOA) operates a portfolio comprising 432 franchise parks and 51 corporate-owned parks. The corporate-owned parks generate an average revenue of USD 14,200 per pad, significantly outperforming the franchise units, which average USD 6,600 per pad. This disparity underscores the financial advantages and growth potential associated with direct ownership within the market. Sun Outdoors leverages multi-season resorts featuring water parks and pickleball stadiums, while Thousand Trails employs an annual pass model granting access to more than 80 resorts, securing recurring cash flow.
Private-equity firms, such as DLP Capital, are strategically consolidating parks into geographically diversified portfolios to achieve operational efficiencies. By streamlining procurement processes and deploying centralized reservation systems, these firms are leveraging economies of scale to enhance profitability. Concurrently, technology vendors are introducing turnkey solutions that integrate advanced features, including dynamic pricing mechanisms, gate security systems, and guest-experience applications, to modernize operations and improve customer satisfaction. Operators lacking the resources to adopt such modernization strategies face the risk of being relegated to lower-tier market segments, which could result in compressed pricing power and diminished occupancy rates.
Hipcamp, recognized for its platform that consolidates private-land campsites, and Outdoorsy, which has significantly enhanced its lifetime transaction value by integrating offerings such as insurance, trip-planning content, and campground booking widgets, are emerging as prominent disruptors in the market. These companies are strategically leveraging digital platforms to engage with tech-savvy consumers while fostering the development of untapped demand segments. Additionally, substantial growth opportunities exist in underexplored areas, including EV-charging services, premium glamping accommodations featuring en-suite bathrooms, and extended-stay coworking villages. These niches provide viable entry points for new players, even as established competitors continue to expand their market presence.
United States Camping And Caravanning Industry Leaders
-
Kampgrounds of America (KOA)
-
Thousand Trails (Equity LifeStyle Properties)
-
Sun Outdoors (Sun Communities)
-
Hipcamp
-
Jellystone Park
- *Disclaimer: Major Players sorted in no particular order
United States Camping And Caravanning Market Companies Covered in this Report
- Kampgrounds of America (KOA)
- Thousand Trails (Equity LifeStyle Properties)
- Sun Outdoors (Sun Communities)
- Jellystone Park
- Good Sam (Camping World Holdings)
- Harvest Hosts
- Hipcamp
- ReserveAmerica
- Outdoorsy
- Escapees RV Club
- ARVC (National Assn. of RV Parks & Campgrounds)
- Blackstone-backed Blue Water Development
- Getaway
- Tentrr
- Boondockers Welcome
- Boating & RV Insurance (Progressive)
- Winnebago Industries
- Thor Industries
- Forest River
- Airstream
Read Analysis of United States Camping And Caravanning Companies
Market Opportunities and Future Outlook
Operators have identifiable opportunities to monetize higher trip frequency and higher on-site spend as the camping household base expands. KOA reported over 52 million North American households camping in 2025, so the opportunity set centers on converting single-trip households into multi-trip customers through loyalty mechanics, curated itineraries, and shoulder-season programming. Major national travel moments also create routing and packaging levers, including the Route 66 Centennial and America 250-related travel activity in 2026, which fits road-trip camping, RV touring, and multi-stop itineraries.
The most actionable product and asset opportunities cluster around premiumization and electrification. Upscale outdoor hospitality formats, including KOA’s Terramor Outdoor Resorts concept, illustrate how glamping and cabin-forward supply can broaden addressable demand beyond traditional RV users, supporting higher ADR through private bathrooms, design-led communal spaces, and bundled experiences. EV-charging-ready RV pads and power upgrades remain investable infrastructure gaps, intersecting with broader charging-corridor buildouts referenced by operators and travel-stop networks. With higher power needs among arriving guests, parks that combine robust electrical service with AI-enabled revenue management and updated PMS workflows can improve utilization while managing commission costs and labor intensity.
Recent Industry Developments in United States Camping And Caravanning Market
- July 2026: Kampgrounds of America (KOA) partners with Beef Loving Texans for the Savor the Texas Outdoors campaign, featuring events at KOA locations through August 2026. The campaign expands KOA brand engagement and invites campers to experience KOA properties, boosting near-term occupancy and spend. The initiative strengthens brand loyalty and drives utilization across key Texas properties.
- June 2026: Kampgrounds of America (KOA) Santa Cruz glamping market commentary highlighting accessibility of glamping experiences. The commentary shapes consumer perception of glamping as accessible luxury in a strategic market. The update supports premium pricing and occupancy growth in coastal California markets.
- May 2026: Sun Communities announces agreement to sell UK assets, including Park Holidays business, for approximately $1.03 billion. The divestiture affects global footprint and capital deployment. It reallocates capital to the core US portfolio and potential reinvestment in domestic camping and caravanning growth initiatives.
United States Camping And Caravanning Market Report Scope and Research Methodology
Market Definition and Coverage
For this report, the market is defined as the revenue generated in the United States from paid camping and caravanning stays and bookings, across public and private campgrounds and related stay formats that are directly tied to overnight outdoor lodging.
Scope exclusions: We exclude one-time equipment purchases (such as tents, RVs, and accessories), fuel, and broader trip spend that is not paid to the camping or caravanning stay provider.
Segments Covered in This Report
- By Destination Type
- State or National Park Campgrounds
- Privately Owned Campgrounds
- Public or Privately Owned Land Other Than a Campground
- Backcountry, National Forest or Wilderness Areas
- Parking Lots
- Others
- By Type of Camper
- Car Camping
- RV Camping
- Backpacking
- Others
- By Distribution Channel
- Direct Sales
- Online Travel Agencies
- Traditional Travel Agencies
- By Geography
- Northeast
- Midwest
- South
- West
Data Sources, Market Sizing, and Validation
Desk Research
We first map where camping happens in the United States, how many people participate, and how public and private sites are managed, then we align those facts with how revenue is recorded in the sector. Public and official sources are used to anchor definitions, understand travel patterns, and cross-check whether the demand assumptions in the model look reasonable.
Common desk references include federal recreation and visitation statistics (such as National Park Service and US Forest Service data), national travel metrics (such as Bureau of Transportation Statistics), economic series that affect discretionary travel (such as Bureau of Economic Analysis and Bureau of Labor Statistics), and industry participation and spend tracking from associations (such as the Outdoor Industry Association). We also review state park system publications, company filings and investor presentations, and trusted press coverage to understand pricing, capacity expansions, and operating trends. For hard-to-find company financial splits and transaction monitoring, we use paid subscriptions for company financials and news intelligence, and when needed a patent database is checked for product and amenity innovation signals. The sources listed here are illustrative only, and additional sources are reviewed for data collection, validation, and clarification.
Primary Interviews and Surveys
Primary inputs are collected to validate how nightly rates move by season, what occupancy looks like across peak and shoulder months, and how booking shares split between direct and intermediated channels. We speak with campground operators and destination and park-side stakeholders, then we confirm utilization patterns and rate behavior with managers who handle day-to-day operations across the United States.
Distribution of primary research fieldwork respondents
| Company type | Respondent position |
|---|---|
| Top tier: 26% | CXOs: 15% |
| Mid tier: 59% | Functional/Unit leaders: 34% |
| Smaller Players: 15% | Managers: 51% |
Market-Sizing & Forecasting
Sizing starts with a top-down build where participation, trip incidence, and the share of trips that translate into paid camping stays are used to reconstruct the demand pool, which is then converted into revenue using observed stay patterns and price behavior. Results are then corroborated with selective bottom-up approximations, such as sampled campground capacity and occupancy multiplied by typical nightly rates, followed by channel checks on booking shares to adjust totals when gaps appear.
A few inputs that matter in this market include paid campsite and RV site nightly rates, seasonal occupancy and length of stay, campground capacity additions, mix shifts between public and private sites, and booking channel mix for paid stays. When a variable is not available consistently at a national level, we apply region-appropriate ranges sourced from interviews, and then confirm that the implied utilization and rate progression remain realistic.
For forecasting, scenario analysis is used because travel budgets and fuel sensitivity can shift road-trip behavior, and weather variability can change peak-season outcomes. Assumptions on rate growth, utilization, and new capacity are refreshed with expert feedback so the forecast remains practical and repeatable.
Data Validation & Update Cycle
Triangulation is completed by comparing modeled revenue against independent signals, such as public land visitation series, travel volume indicators, and outdoor participation trends, before totals are finalized. Where large variances show up, the drivers are revisited so that the implied occupancy, length of stay, and pricing do not drift away from what is seen on the ground.
Before sign-off, the model and its main inputs go through multi-step analyst reviews, and follow-up outreach is triggered when new disclosures or operator feedback conflict with earlier assumptions. Reports are refreshed annually, with interim updates for material events, and a final pre-delivery pass is completed so clients receive the latest updated view.
Mordor Intelligence's US Camping and Caravanning Market Sizing Compared With Other Published Estimates
Published market sizes can vary because studies do not always measure the same revenue pool, and the conversion from trips to dollars depends heavily on occupancy, length of stay, and nightly rate assumptions. Timing differences also matter since peak-season price changes can shift a single-year outcome even when participation looks stable.
By tracking occupancy seasonality and refreshing nightly rate benchmarks, Mordor Intelligence keeps the estimate focused on paid camping and caravanning stay and booking revenue, rather than total camping-related expenditures that include items like transport, food, and gear.
Benchmark comparison
| Source | Market Size | Gaps in Research Methodology |
|---|---|---|
| Mordor Intelligence | USD 27.87 B (2025) | |
| Industry Database A | USD 10.6 B (2024) | This number aligns more closely with campground and RV park operator revenue under a narrow industry definition, which generally excludes broader paid trip booking value and several camping stay formats outside that reporting set. |
| Outdoor Hospitality Report B | USD 61.00 B (2024) | This estimate reflects total camping expenditures across a trip, which can include equipment, groceries, transport, and off-site activities, so it is materially wider than a paid stay and booking revenue definition. |
Across the table, the low end is driven by narrower operator-reported revenue, and the high end is driven by total spending that extends beyond the campground transaction. Keeping the definition tied to paid stays and repeatable checks on occupancy and rates helps the final total stay consistent year to year and easier to reconcile.
Key Questions Answered in the Report
How big is the United States camping and caravanning market in 2026?
The United States camping and caravanning market size stands at USD 29.89 billion in 2026.
What growth rate is forecast through 2031?
The market is set to post a 7.23% CAGR from 2026 to 2031.
Which destination type commands the largest share?
Privately owned campgrounds led with 36.71% of 2025 revenue.
Which camper segment will expand fastest?
Backpacking is projected for an 8.62% CAGR to 2031.
Which U.S. region will grow quickest?
The Western region is projected to experience the highest compound annual growth rate (CAGR) through 2031.
How concentrated is competition among campground operators?
The top five players hold about one-fourth of revenue, reflecting moderate fragmentation.