
Market Overview
| Study Period | 2020 - 2031 |
|---|---|
| Forecast Data Period | 2026 - 2031 |
| Base Year Market Size (2025) | USD 170.32 Billion |
| Market Size (2026) | USD 198.21 Billion |
| Market Size (2031) | USD 423.08 Billion |
| Growth Rate (2026 - 2031) | 16.39 % |
| Market Concentration | High |
Major Players *Disclaimer: Major Players sorted in no particular order Image © Mordor Intelligence. Reuse requires attribution under CC BY 4.0. | |
US Buy Now Pay Later Services Market Analysis by Mordor Intelligence
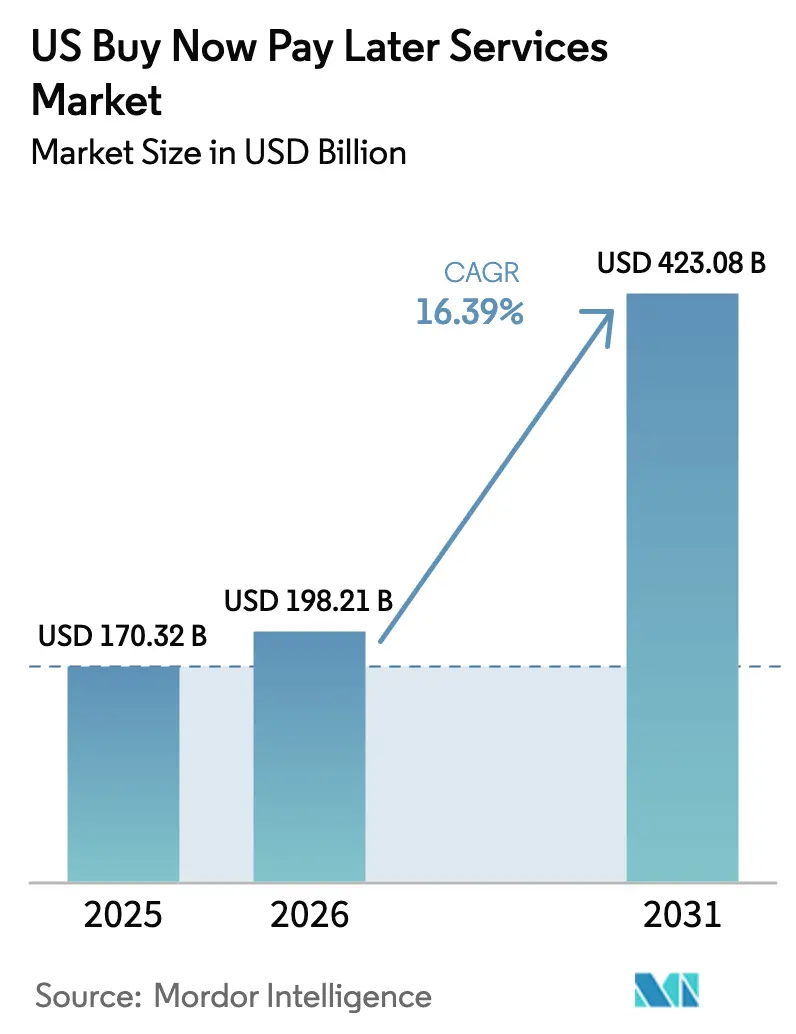
The buy now, pay later (BNPL) services market size in the United States was valued at USD 170.32 billion in 2025 and estimated to grow from USD 198.21 billion in 2026 to reach USD 423.08 billion by 2031, at a CAGR of 16.39% during the forecast period (2026-2031). Expansion is being fueled by younger shoppers gravitating toward short-term, interest-free installments, merchant demand for higher conversion at checkout, and the steady migration of embedded finance tools into sectors such as healthcare, travel, and home improvement. Fintech incumbents continue to lead on user experience, yet banks are quickly matching their reach by embedding installment functionality into existing card portfolios. Heightened competition is spurring investment in advanced underwriting models, data-driven loyalty programs, and omnichannel acceptance that ties together e-commerce sites, mobile wallets, and physical terminals.
Key Report Takeaways
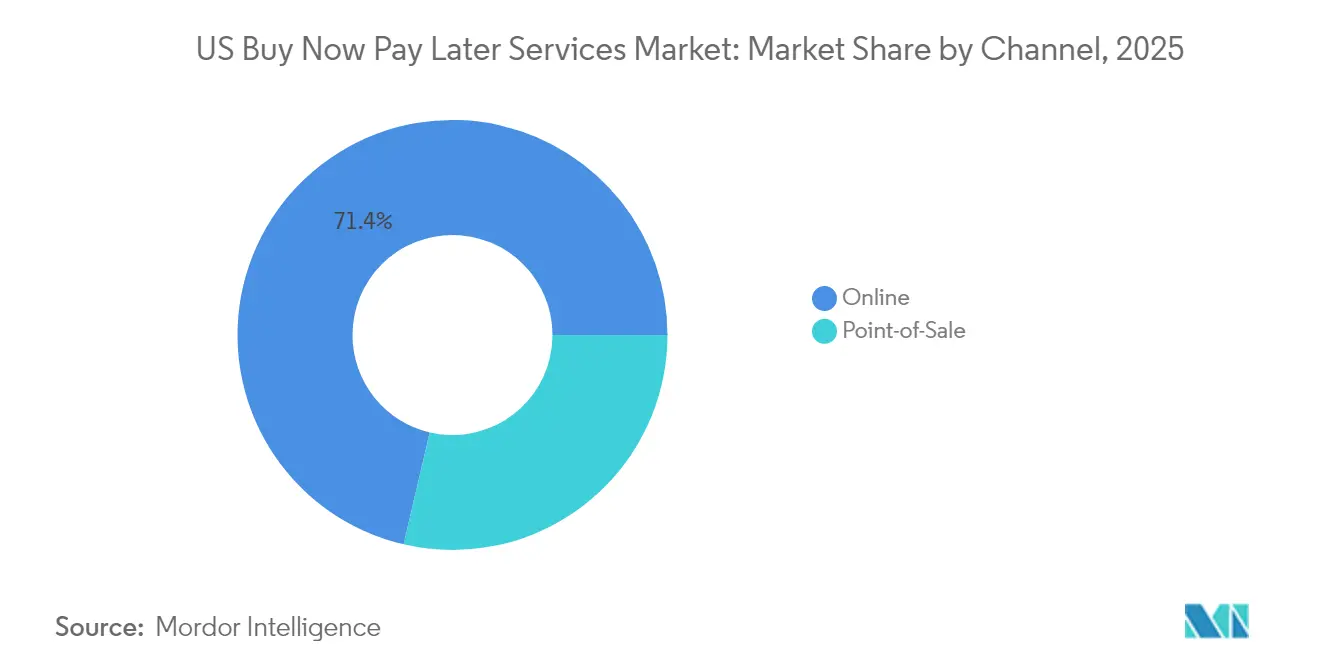
- By channel, online commerce commanded 71.35% of the United States BNPL market share in 2025, while in-store transactions are expected to post the fastest growth at 19.15% CAGR through 2031.
- By end-use industry, fashion and apparel led with 27.85% share of the United States BNPL market in 2025; healthcare and wellness is projected to expand at a 19.88% CAGR through 2031.
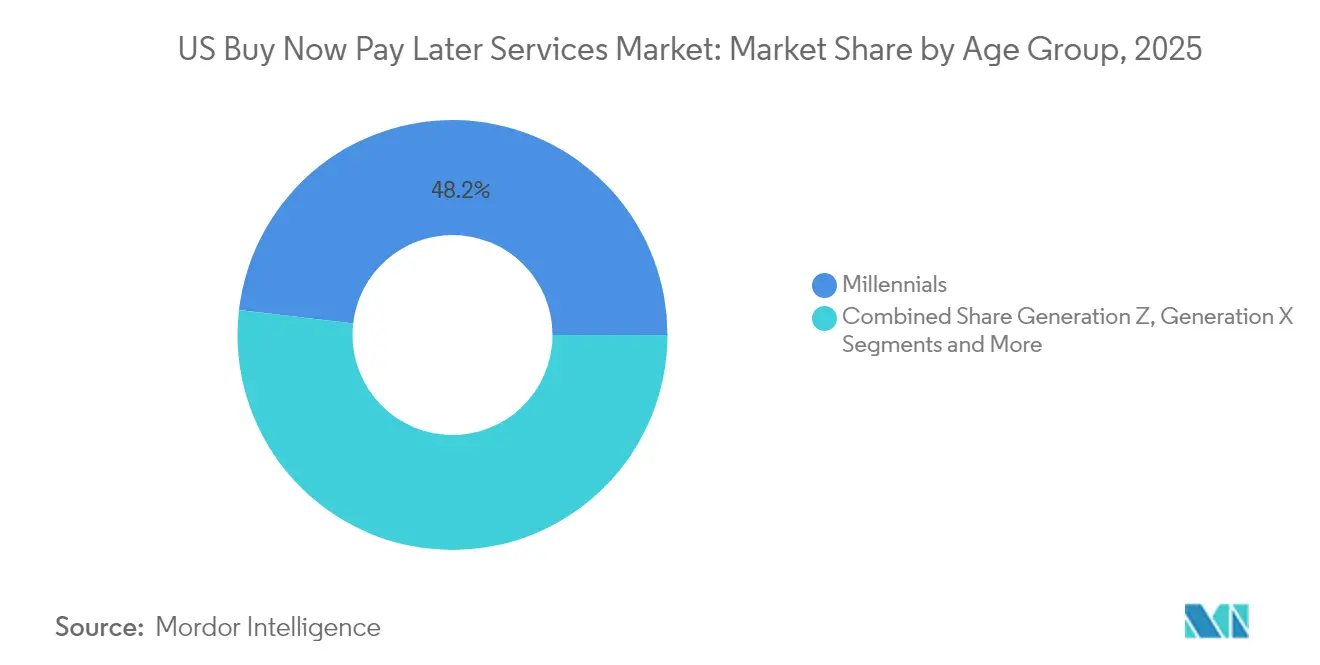
- By age group, millennials accounted for 48.15% share of the United States BNPL market in 2025, whereas Generation Z adoption is forecasted to climb at a 21.52% CAGR through 2031.
- By provider type, fintech companies held 56.95% of the BNPL market size in 2025; banks are the fastest-growing cohort with a 21.19% CAGR outlook.
Note: Market size and forecast figures in this report are generated using Mordor Intelligence’s proprietary estimation framework, updated with the latest available data and insights as of 2026.
US Buy Now Pay Later Services Market Trends and Insights
Drivers Impact Analysis*
| Driver | (~) % Impact on CAGR Forecast | Geographic Relevance | Impact Timeline |
|---|---|---|---|
| Increasing Millennial & Gen Z Preference for Interest-Free Short-Term Credit | +4.2% | National, higher in urban centers | Medium term (2-4 years) |
| Expansion into Non-Retail Verticals such as Healthcare & Travel | +3.8% | National, early adoption in metropolitan areas | Long term (≥ 4 years) |
| Deep Integration with Digital Wallets and POS Systems Boosting Merchant Adoption | +3.1% | National, concentration in tech-forward regions | Medium term (2-4 years) |
| Strategic Partnerships with Major Card Networks Enhancing Distribution Reach | +2.5% | National | Short term (≤ 2 years) |
| Rising Demand from Sub-prime and Near-prime Consumers Excluded from Traditional Credit Cards Accelerating BNPL Penetration | +2.1% | Medium term (2-4 years) | Medium term (2-4 years) |
| Source: Mordor Intelligence | |||
Increasing Millennial & Gen Z Preference for Interest-Free Short-Term Credit
Close to 46% of Gen Z consumers used a BNPL option in 2025, nearly doubling their 2023 participation. Short-term installment plans align with young adults’ budgeting style, which values predictable repayment schedules and zero-interest costs over revolving balances. Eighty-one percent of Gen Z customers state they will abandon brands that provide poor payment experiences, underscoring the competitive stakes for merchants. The same cohort also ranks payment flexibility as critical in business relationships, signaling spill-over effects into B2B commerce. As Gen Z’s earnings rise, their entrenched preference for BNPL is likely to steer broader payment behavior for decades.
Expansion into Non-Retail Verticals such as Healthcare & Travel
Rising out-of-pocket medical expenses have turned healthcare into the fastest-growing vertical for BNPL. Sunbit, for example, partners with roughly 7,300 healthcare providers to fund treatments valued between USD 60 and USD 10,000. Travel has mirrored this momentum, registering a 289% jump in BNPL booking volume in 2024[1]AFM, “Installment Payments in Travel Bookings 2024,” afm.nl. Consumers using installments spend 70% more per trip, lifting airline, hotel, and OTA revenues. By catering to essential and high-ticket purchases, BNPL platforms diversify revenue beyond discretionary retail and mitigate cyclicality.
Deep Integration with Digital Wallets and POS Systems Boosting Merchant Adoption
Digital wallets captured a 50% share of US transactions by 2025, up from 36% in 2023. Embedding BNPL choices inside wallets lowers technical barriers for merchants and lets shoppers tap a single interface across online and in-store checkouts. Retailers report conversion lifts of 20-30% and average-order-value gains of 30-50% once installments are enabled. Payment processors are extending this reach by integrating BNPL rails directly into existing terminals, accelerating omnichannel uptake.
Strategic Partnerships with Major Card Networks Enhancing Distribution Reach
Card-network programs such as Mastercard Installments and Visa Installments insert BNPL functionality into cards already carried by millions of Americans. The share of issuers offering such plans rose to 36% in 2024. These alliances give fintech brands exposure to entrenched merchant networks while helping networks boost transaction volume. Klarna’s collaboration with JPMorgan ahead of its US IPO illustrates the credibility lift and distribution leverage that card-network ties confer.
Restraints Impact Analysis*
| Restraint | (~) % Impact on CAGR Forecast | Geographic Relevance | Impact Timeline |
|---|---|---|---|
| CFPB and State-Level Regulatory Scrutiny of BNPL Fee Structures is Escalating | -2.30% | National, varying by state | Medium term (2-4 years) |
| Rising Delinquency Rates Impacting Provider Profitability | -1.80% | National, higher in lower-income regions | Short term (≤ 2 years) |
| Intensifying Competition from Traditional Card Issuers’ Installment Products | -1.50% | National, concentrated in urban markets | Medium term (2-4 years) |
| Shrinking Merchant Service Fees Squeezing BNPL Profit Margins | -1.20% | National | Medium term (2-4 years) |
| Source: Mordor Intelligence | |||
Escalating CFPB & State-Level Regulatory Scrutiny on Fee Structures
In May 2024, the Consumer Financial Protection Bureau (CFPB) classified certain digital BNPL loans as “credit cards” under Regulation Z[2]Consumer Financial Protection Bureau, “Buy Now, Pay Later: Market Trends and Consumer Impacts,” consumerfinance.gov, compelling providers to handle disputes, refunds, and billing statements similarly to card issuers. Although the CFPB announced in April 2025 that it would not prioritize enforcement while reviewing the rule, providers still face compliance investments and potential state-level measures such as New York’s proposed Buy Now Pay Later Act. Smaller firms may struggle with added costs, quickening consolidation.
Rising Delinquency Rates Impacting Provider Profitability
Roughly 30% of BNPL installments were past due in January 2025. Economic stress is pushing borrowers toward late payments, especially on zero-interest plans that lack price buffers. Klarna has refined its underwriting to stem credit losses in the United States. Providers are pivoting to hybrid models that mix short, no-interest terms with longer, interest-bearing options, enabling risk-based pricing and diversified income.
*Our forecasts treat driver/restraint impacts as directional, not additive. The impact forecasts reflect baseline growth, mix effects, and variable interactions.
Segment Analysis
By Channel: Omnichannel Acceptance Lifts In-Store Momentum
The BNPL market size for online commerce totaled 71.35% revenue share in 2025. In-store usage, however, is growing faster at a 19.15% CAGR through 2031, signaling merchants’ push to mirror digital flexibility on the sales floor. Retailers deploying unified checkout flows report double-digit conversion gains as shoppers opt for installments on high-ticket items. Hardware integrations with major payment processors simplify rollouts, yet continued user education is required to lift in-aisle visibility.
Omnichannel solutions allow customers to pre-qualify via mobile apps and complete transactions at staffed lanes or self-checkout. The practice is particularly popular in consumer electronics and furniture showrooms where financing decisions occur near physical inventory. The BNPL market stands to capitalize on blended journeys as shoppers browse online, reserve products, and conclude purchases in store. Bridging channels also serves older demographics that prefer brick-and-mortar environments but welcome flexible pay options.


By End-Use Industry: Healthcare Surges Ahead of Fashion Leader
Fashion and apparel retained a 27.85% share of the BNPL market size in 2025. Healthcare is expected to surpass other verticals with a 19.88% CAGR to 2031 on the back of rising medical deductibles and elective-care demand. Sunbit’s network of 7,300 dental and medical offices showcases early traction. High-value travel bookings follow closely, benefiting airlines and OTAs that see ticket sizes jump once installments appear at checkout.
Broadening into non-retail arenas stabilizes volume during retail cycles. Home improvement chains are integrating BNPL for appliance replacements and renovation projects, while streaming and gaming brands use installments to lower subscription churn. Such diversification reduces reliance on discretionary apparel spend and positions providers in sectors with structural financing needs.
By Age Group: Generation Z Sets the Growth Pace
Millennials accounted for 48.15% of US BNPL users in 2025. Generation Z is forecast to compound at 21.52% annually through 2031 as new workforce entrants favor budgeted, interest-free schedules over revolving credit. Nearly 42% of Gen Y and Gen Z consumers used installments in 2025 compared with 21% of older cohorts.
Generation X typically leverages BNPL for larger purchases such as home upgrades, while baby boomers participate less frequently but register higher average values when they do. Peer influence and social-shopping features embedded in BNPL apps continue to expose older customers to installment culture, underlining long-term demographic upside for the BNPL market.
By Provider: Banks Narrow the Gap with Fintech Leaders
Fintechs secured 56.95% of transaction volume in 2025, reflecting early entry and digital design. Banks, however, are expanding at a 21.19% CAGR as they fold installments into mainstream cards and mobile apps. Issuers benefit from low funding costs and decades of underwriting data, allowing competitive pricing and instant approval within existing customer portals.
Card networks amplify this trend by offering issuer-agnostic BNPL rails. Retailers are also testing proprietary frameworks that tie financing to loyalty rewards, creating a multilayer ecosystem. Intense rivalry is prompting M&A as scale advantages grow more important for funding, compliance, and data analytics.
Geography Analysis
Metropolitan areas such as San Francisco, Seattle, and Austin show the highest penetration, driven by large cohorts of tech-savvy millennials and Gen Z consumers. Yet the regional gap is shrinking as nationwide retailers roll out omnichannel BNPL and smaller towns adopt digital wallets. States with larger underbanked populations exhibit above-average usage, reflecting the product’s appeal to credit-invisible borrowers.
Regulatory patchwork remains a top geographic variable. California, New York, and Massachusetts are evaluating bespoke disclosure and licensing rules, adding complexity for nationwide operators. Providers must calibrate compliance workflows while ensuring uniform customer experiences. Economic conditions also matter: regions with volatile employment records rely more on flexible installments to manage cash flow, a trend most evident in parts of the Southeast and Midwest.
Tourism-heavy states such as Florida and Nevada are benefiting from BNPL’s surge in travel spending. Healthcare-driven adoption is prominent in the Sun Belt, where population growth and out-of-pocket costs intersect. As providers partner with regional hospitals and clinics, penetration is expected to deepen in suburban and rural communities, broadening the BNPL market’s geographic footprint.
Regulatory Landscape
The United States BNPL regulatory environment is anchored by federal consumer-credit rules and the Consumer Financial Protection Bureau (CFPB)'s changing supervisory stance. In May 2024, the CFPB issued an interpretive rule treating certain digital-account BNPL products as credit cards under Truth in Lending Act (TILA) Regulation Z, which raised expectations around billing statements and dispute resolution. In May 2025, the CFPB withdrew this interpretive rule, after previously signaling in 2025 that it would de-prioritize enforcement tied to the rule while reviewing its approach.
Alongside federal actions, legislative activity continues to shape compliance direction for Pay-in-4 products. The Congressional Research Service has highlighted proposals in the 119th Congress (including H.R. 6891 and S. 3561) focused on applying specific TILA provisions to BNPL, reinforcing that disclosure, servicing, and consumer-protection obligations remain a policy focus even as the CFPB's interpretive posture shifts.
Value Chain Analysis
The US BNPL value chain begins with customer acquisition and pre-qualification within digital user accounts (apps, wallets, and embedded checkout modules), followed by underwriting, credit extension, and merchant acceptance at online and point-of-sale checkouts. Providers typically monetize through merchant discount and fees, consumer charges in longer-tenor APR-bearing products, and ancillary revenues such as advertising or platform services, while relying on payment processing rails and integrations with gateways, wallets, and POS providers to support omnichannel acceptance. Settlement flows involve the BNPL provider paying the merchant (often net of fees) and collecting installments from the consumer over the repayment schedule.
Risk management and data infrastructure are central nodes in the chain, covering fraud screening, identity verification, servicing, and collections, with performance feeding back into underwriting models. Regulators have also pointed to historic under-reporting of BNPL obligations to the three national credit reporting agencies, which can create information gaps for other creditors and complicate how consumers build or reflect repayment history. Public-company BNPL operators such as Affirm, Block (Afterpay), and PayPal shape ecosystem practices through scale, funding strategy, and platform integrations described in periodic regulatory filings.
Competitive Landscape
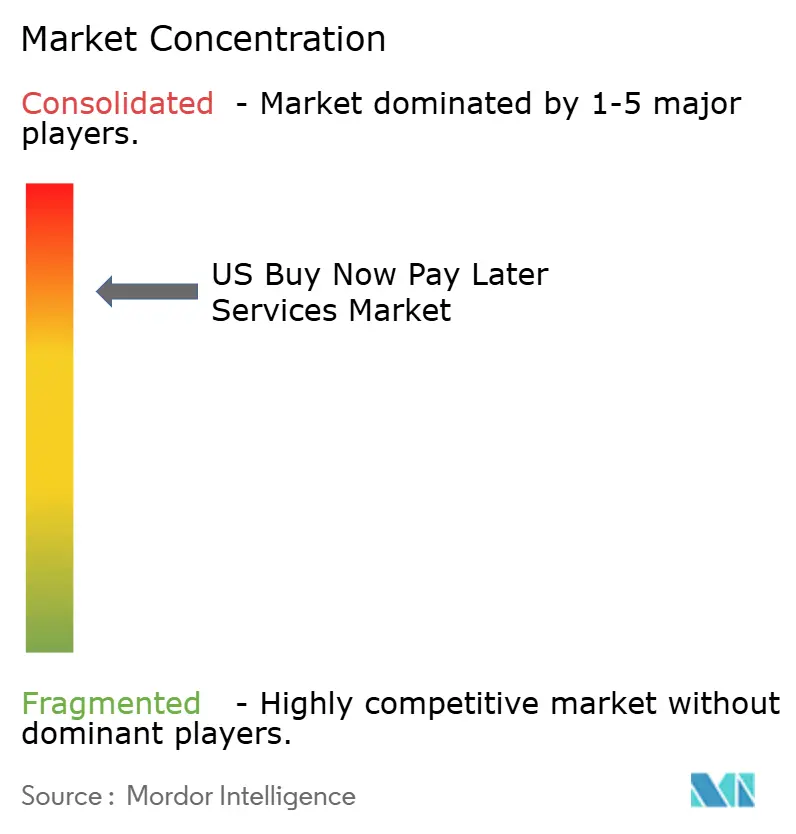
The US BNPL market exhibits moderate concentration, leaving opportunities for niche disruptors to emerge. Leading fintechs are evolving into multi-service platforms that combine shopping feeds, debit cards, and budgeting tools. Klarna’s advertising revenue jumped from USD 13 million in 2020 to USD 180 million in 2024, exemplifying how monetizing data can offset fee compression.
Banks counter with balance-sheet strength and trusted brands, while card networks play ecosystem orchestrator. Strategic alliances—such as Klarna’s collaboration with JPMorgan—underscore the shift toward hybrid models that blend fintech agility with incumbent scale. White-space opportunities persist in healthcare, education, and B2B invoice financing, where specialized risk engines can command premium spreads.
Technology is the decisive differentiator: providers invest heavily in AI-driven credit scoring, real-time fraud detection, and personalized offers. Blockchain-based smart-contract platforms are emerging, promising lower operating costs and transparent repayment tracking, though mainstream adoption remains early. Competitive intensity is expected to spur consolidation as smaller firms struggle to absorb compliance overheads and shrinking merchant fees.
US Buy Now Pay Later Services Industry Leaders
Affirm Holdings Inc.
Klarna Bank AB
Afterpay Ltd (Block Inc.)
PayPal Holdings Inc.
Zip Co Ltd (Quadpay)
- *Disclaimer: Major Players sorted in no particular order

Market Opportunities and Future Outlook
Product-mix expansion beyond Pay-in-4 is a clear whitespace area, supported by the shift toward APR-bearing BNPL loans. Regulatory summaries show APR-bearing originations reaching USD 58 billion in 2025 versus USD 2.9 billion in 2019, indicating growing consumer and merchant acceptance for longer-tenor, risk-priced installment credit that can support higher-ticket categories such as travel, home improvement, and healthcare. This evolution also creates differentiation pathways for providers through underwriting, repayment flexibility, and servicing experiences aligned with Regulation Z style expectations where applicable.
Distribution-led opportunities are increasingly tied to deeper embedding into major commerce and payments infrastructure, where BNPL becomes a default option inside checkout, wallet, and processor workflows rather than a standalone button. In 2026, company actions including integrations spanning QuickBooks Payments (Intuit), Google Pay surfaces, and processor platforms such as Worldline and Fiserv indicate that placement at the moment of intent and acceptance expansion across online and in-store channels are active levers. Credit-performance management and compliance readiness remain practical constraints, especially as federal and congressional attention continues to keep disclosure and consumer-protection requirements in scope.
Recent Industry Developments
- July 2026: Klarna partnered with Southwest Airlines to provide flexible payment options for travelers. The launch expands BNPL presence in travel payments and strengthens Klarna's reach at the point of sale for airline bookings. The collaboration broadens Klarna's travel and consumer checkout moments.
- July 2026: Klarna expanded its partnership with Flix to include Klarna payment options in 21 markets, including the U.S. The expansion broadens BNPL acceptance across travel and entertainment platforms, increasing cross-market merchant coverage and international scale for Klarna. The partnership supports Klarna's global merchant network.
- June 2026: Klarna launched FDIC-insured savings accounts in the U.S. in partnership with WebBank. The move into savings products deepens Klarna's financial offering for U.S. customers. It broadens user engagement and retention by expanding financial services within the Klarna platform.


Research Methodology Framework and Report Scope
Market Definition and Coverage
This market is measured as the total value of consumer purchases in the United States that are completed using buy now pay later plans at checkout, across online and in-store acceptance, for short-term installment or pay-in-30 style offers.
Scope exclusions: We do not count post-purchase card balance conversion plans, and we also exclude installment loans with repayment terms longer than 12 months.
Segmentation Overview
- By Channel
- Online
- Point-of-Sale (In-store)
- By End-Use Industry
- Consumer Electronics
- Fashion & Apparel
- Healthcare & Wellness
- Home Improvement
- Travel & Leisure
- Media & Entertainment
- Other End-Use Industries
- By Age Group
- Generation Z (18-28 Years)
- Millennials (29-44 Years)
- Generation X (45-60 Years)
- Baby Boomers (61-79 Years)
- Silent Generation (80 Years and Above)
- By Provider
- Fintechs
- Banks
- Others
Data Sources, Market Sizing, and Validation
Desk Research
We start by mapping the BNPL value chain and the demand pool, then we anchor the model using public payment and credit indicators that move with installment usage. Non-paywalled sources like Federal Reserve consumer credit releases, CFPB BNPL publications, U.S. Census retail sales data, and SEC filings are used to set guardrails around adoption and transaction intensity.
After that, the desk work is used to sanity check seasonality and category mix (for example, retail peaks and shifts in online share) before any assumptions are taken into primary calls. We also use secondary sources such as provider investor presentations, reputable press, and trade association websites. We selectively use paid database subscriptions for provider financials and intelligence, news and financials, patent databases, and shipment-level import/export data when it helps validate supporting signals. The list of desk research sources mentioned here is illustrative, and additional references were used for collection, validation, and clarification.
Primary Interviews and Surveys
Our primary work focuses on confirming what is actually counted as BNPL at checkout, how plan terms are structured, and how merchant fees and approval behavior shift by category and channel. We speak with payment and lending stakeholders across the United States, including providers, merchants, platforms, and risk or compliance specialists, to close gaps left by public data and recheck key assumptions before finalizing totals.
Distribution of primary research fieldwork respondents
| Company type | Respondent position |
|---|---|
| Top tier: 35% | CXOs: 13% |
| Mid tier: 51% | Functional/Unit leaders: 37% |
| Smaller Players: 14% | Managers: 50% |
Market-Sizing & Forecasting
The core sizing starts from a top-down demand pool rebuild where U.S. consumer purchase activity is converted into BNPL-enabled checkout value using adoption, transaction frequency, and average ticket size assumptions refined through interviews. Once the macro build is stable, we use selective bottom-up approximations, including sampled merchant fee ranges applied to category volumes, channel checks on online versus in-store mix, and provider roll-ups to see whether totals need adjustment.
The inputs that most often move the model include online retail penetration, share of checkout financed through installments, approval rates and decline behavior, typical plan tenure (pay-in-4 versus monthly), and the shift in average order values by category. Forecasting is done using scenario analysis supported by a simple multivariate regression on drivers such as retail sales growth, interest rate sensitivity for longer plans, and user growth expectations that primary respondents flagged as realistic. When provider disclosures are incomplete, gaps are handled through conservative proxying using peer ranges, then revalidated through follow-up calls.
Data Validation & Update Cycle
Estimates are triangulated across independent signals, including public retail spend series, consumer credit indicators, and directional disclosures on BNPL activity, then checked for year-to-year jumps that do not align with real-world adoption patterns. If a variance looks too large, the assumptions are revisited, and respondents are re-contacted to confirm whether the change is structural or just reporting noise.
Before sign-off, the model goes through multi-step analyst reviews with logic checks on units, currency timing, and internal consistency across categories and channels. Reports are refreshed annually, and interim updates are made when material events affect plan terms, regulation, or acceptance coverage. Right before delivery, a fresh pass is completed so clients receive the latest updated view.
Mordor Intelligence's US Buy Now Pay Later Services Market Size Versus Other Published Estimates
Published BNPL market values in the United States can look far apart because the term is used for different things, and not everyone measures the same metric. Some sources track consumer payment value, some track originations, and others capture a narrower product set, so the year labels may match even when the underlying definition does not.
A common gap driver is scope, since some estimates focus only on pay-in-4 programs or only on digital checkout, and they may also report in real dollars or exclude longer installment plans. Some external numbers lean on a limited set of provider data without a consistent adjustment for channel expansion and changing plan tenure, and the refresh cycle can lag when retail seasonality or credit tightening shifts behavior. In contrast, some estimates fold BNPL into pay-in-4 only, and Mordor Intelligence counts U.S. checkout BNPL purchase value across online and in-store offers up to 12 months, then excludes post-purchase balance conversions and loans longer than 12 months.
Benchmark comparison
| Source | Market Size | Gaps in Research Methodology |
|---|---|---|
| Mordor Intelligence | USD 170.32 B (2025) | |
| Trade Publication A | USD 94.29 B (2024) | Tracks BNPL payment value with a tighter practical lens that typically emphasizes online checkout usage and may not fully scale in-store acceptance or longer monthly plans within a unified definition. |
| Policy Research Brief B | USD 70.00 B (2025) | Limits the metric to pay-in-4 BNPL purchase volume and excludes other installment point-of-sale loans that many users and merchants still label as BNPL, which lowers the reported total. |
The spread is largely explained by what gets counted and how the metric is framed, not just by forecasting optimism. By keeping the unit as purchase value and applying consistent filters on plan term and post-purchase conversions, the estimate stays traceable to clear inputs that can be rechecked each update cycle.


Key Questions Answered in the Report
What is the current size of the US buy now, pay later market?
The market was valued at USD 198.21 billion in 2026 and is projected to reach USD 423.08 billion by 2031.
Which channel is expanding fastest in BNPL?
In-store, point-of-sale BNPL is forecast to grow at 19.15% CAGR between 2026 and 2031, outpacing online growth.
Why is healthcare seen as a key growth vertical for BNPL?
Rising out-of-pocket medical costs and the need for immediate financing are driving a 19.88% CAGR in healthcare BNPL through 2031.
How are banks competing with fintechs in BNPL?
Banks embed installment plans into existing cards and mobile apps, leveraging low funding costs and trusted brands while growing at a 21.19% CAGR.
What regulatory risks face BNPL providers?
The CFPB’s evolving stance on applying credit-card rules to BNPL and diverse state proposals introduce compliance costs that could slow growth.
Are delinquencies a major concern for BNPL firms?
Yes. Around 30% of BNPL installments were past due in early 2025, prompting providers to tighten underwriting and diversify revenue sources.
Page last updated on:


 Your data is secure and never sold or shared.


