
Market Overview
| Study Period | 2020 - 2031 |
|---|---|
| Forecast Data Period | 2026 - 2031 |
| Base Year Market Size (2025) | USD 14.67 Billion |
| Market Size (2026) | USD 16.84 Billion |
| Market Size (2031) | USD 30.83 Billion |
| Growth Rate (2026 - 2031) | 12.86 % |
| Market Concentration | Medium |
Major Players *Disclaimer: Major Players sorted in no particular order Image © Mordor Intelligence. Reuse requires attribution under CC BY 4.0. | |
United States Blood Glucose Monitoring Market Analysis by Mordor Intelligence
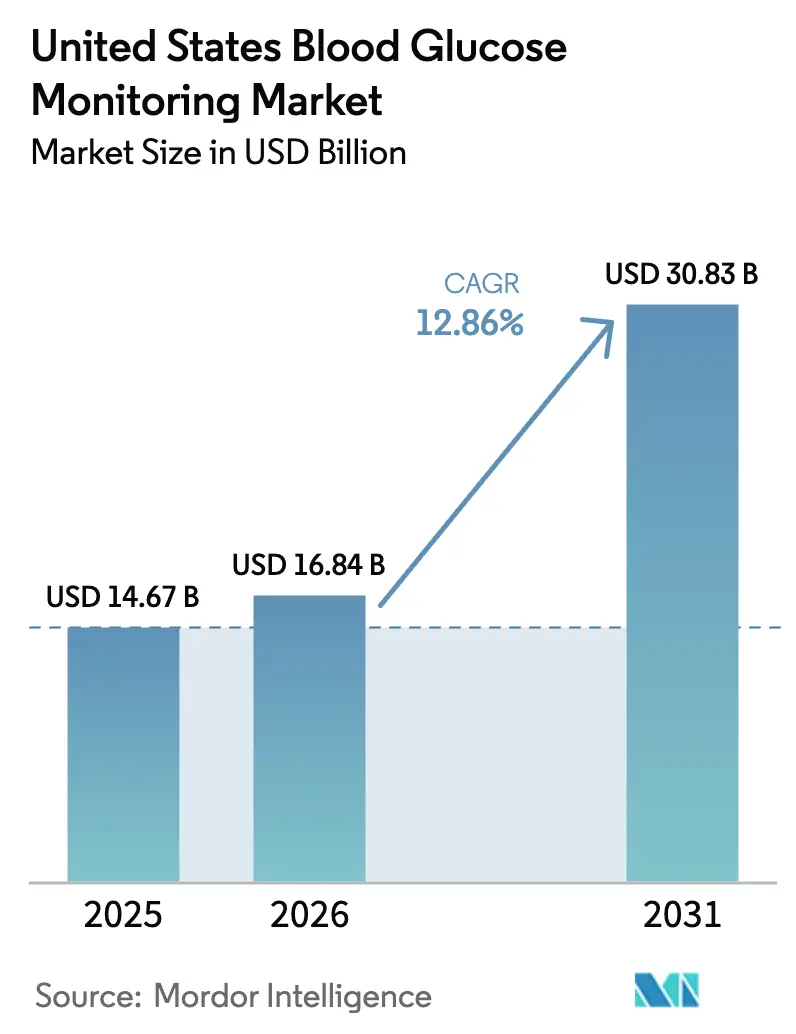
The United States Blood Glucose Monitoring Market size is expected to increase from USD 14.67 billion in 2025 to USD 16.84 billion in 2026 and reach USD 30.83 billion by 2031, growing at a CAGR of 12.86% over 2026-2031.
Robust Medicare reimbursement, over-the-counter continuous glucose monitor (CGM) approvals, and patient-assembled closed-loop ecosystems are accelerating adoption far beyond incremental sensor upgrades. Medicare’s April 2023 expansion alone unlocked coverage for an estimated 3.7 million insulin users and catalyzed a 340% surge in CGM claims within 12 months. Device innovators capitalized by extending sensor wear to 365 days, lowering the per-day cost to USD 1.10, and expanding access for Medicaid and self-pay customers. Semiconductor vertical integration, such as Abbott’s USD 465 million Kilkenny plant, is buffering supply-chain shocks, while interoperable frameworks are fragmenting vendor lock-in and promoting cross-platform pump-sensor pairings. Headwinds persist, including 26-week application-specific integrated circuit lead times and a 22% patient segment wary of cloud-based data sharing; however, tailwinds from employer wellness mandates and state Medicaid parity decisions continue to outweigh these headwinds.
Key Report Takeaways
- By device type, self-monitoring blood glucose systems led with 56.71% of United States blood glucose monitoring market share in 2025; CGM devices are forecast to compound at 13.69% through 2031.
- By patient type, Type 2 diabetes contributed 62.27% of the 2025 revenue, while Type 1 diabetes is projected to post the fastest growth, with a 14.46% CAGR, through 2031.
- By end-user, hospitals and clinics accounted for 52.63% of the United States blood glucose monitoring market size in 2025, and diagnostic centers are projected to advance at a 15.13% CAGR through 2031.
Note: Market size and forecast figures in this report are generated using Mordor Intelligence’s proprietary estimation framework, updated with the latest available data and insights as of January 2026.
United States Blood Glucose Monitoring Market Trends and Insights
Drivers Impact Analysis*
| Driver | (~) % Impact on CAGR Forecast | Geographic Relevance | Impact Timeline |
|---|---|---|---|
| Rising Diabetes Prevalence | +2.5% | Southern states with obesity rates above 35% | Long term (≥ 4 years) |
| Technological Advances in CGM | +3.1% | Urban academic centers and tech-literate Type 1 communities | Medium term (2-4 years) |
| Medicare Reimbursement Expansion | +2.3% | Florida, Arizona, Pennsylvania with Medicare enrollment exceeding 20% | Short term (≤ 2 years) |
| Employer-Sponsored Wellness Mandates | +1.2% | Fortune 500 self-insured programs focusing on prediabetic workforces | Medium term (2-4 years) |
| Interoperable “DIY Looping” Ecosystems | +1.7% | Type 1 clusters in urban hubs with active patient advocacy | Medium term (2-4 years) |
| Telehealth CPT Codes for Remote Monitoring | +1.4% | Rural counties with limited endocrinology access | Short term (≤ 2 years) |
| Source: Mordor Intelligence | |||
Rising Diabetes Prevalence
CDC reported that 38.4 million Americans, or 11.6% of the population, lived with diabetes in 2025, while prevalence among adults 65+ climbed to 29.2%.[1] The burden is disproportionately heavy in Alabama, Mississippi, and Louisiana, where obesity exceeds 35% and endocrinology resources are sparse, spurring telehealth-enabled CGM demand. Direct medical costs totaled USD 307 billion in 2024; however, CGM uptake among Type 2 basal insulin users remained below 8%, highlighting untapped expansion opportunities. Prediabetes affects 97.6 million adults and carries a 70% risk of progressing to Type 2 within a decade, feeding a pipeline that sustains device volumes. Employer plans now reimburse CGM for prediabetic staff to avert downstream expenses, broadening the user base. Consequently, continuous monitoring is shifting from episodic testing toward universal surveillance across risk cohorts.
Technological Advances in CGM
Four sensor platforms received FDA clearance between March and September 2024, including Dexcom’s OTC Stelo, Abbott’s Lingo, Medtronic’s Simplera, and Senseonics’ 365-day Eversense. One-year implantability reduces adhesive dermatitis, which previously caused 18% of discontinuations within six months. Abbott’s partnership with Medtronic to embed Libre sensors into MiniMed pumps underscores the strategic importance of interoperability, enabling patients to assemble personalized hybrid solutions. Dexcom priced Stelo at USD 99 for a two-sensor month, demonstrating that retail shelves can reach the 30 million prediabetic Americans lacking prescription coverage. As wear duration stretches from 14 days to 365 days, per-day costs decrease toward USD 1, unlocking Medicaid and cash-pay segments that have been long tethered to USD 0.15 test strips.
Medicare Reimbursement Expansion
CMS lifted the intensive-insulin restriction in April 2023, extending CGM reimbursement to basal-insulin users and severe hypoglycemia cases, instantly adding 3.7 million beneficiaries.[2] A Health Affairs review revealed that Florida, Arizona, and Pennsylvania accounted for 38% of incremental CGM claims, likely due to the presence of dense retiree populations. The standard USD 150 monthly payment created a USD 6.7 billion addressable pool, sparking vendor DTC campaigns. Fourteen Medicaid programs had mirrored the policy by 2025, although prior-authorization delays averaged 28 days. Hospital discharges now routinely include CGM prescriptions; a 2024 JAMA study linked this practice to a 41% drop in 30-day hypoglycemia ER visits. Early sales data suggest Medicare members represent the fastest-growing CGM cohort through 2026.
Interoperable “DIY Looping” Ecosystems
The FDA’s iCGM, ACE pump, and AID controller classes enable patients to pair devices from different brands, potentially leading to an estimated 15,000 U.S. DIY loopers by 2025. Tandem’s January 2024 cross-vendor integration of Abbott’s Libre 2 Plus with the t:slim X2 pump commercialized this modular vision. A Diabetes Care cohort study documented a jump in time-in-range from 68% to 76% and a 54% decrease in severe hypoglycemia among loopers, rivaling the annual savings of USD 10,000 compared to commercial systems.[3] Community developers iterate algorithms within weeks, forcing incumbents to accelerate product cycles or cede tech-savvy Type 1 users. The framework decouples sensor, pump, and algorithm approvals, unlocking innovation but intensifying competitive churn.
Restraints Impact Analysis*
| Restraint | (~) % Impact on CAGR Forecast | Geographic Relevance | Impact Timeline |
|---|---|---|---|
| High Cost of CGM Devices | -1.6% | Rural counties and 27 million uninsured or 44 million underinsured Americans | Short term (≤ 2 years) |
| Economic Reuse of Test Strips | -1.1% | Low-income households and Medicaid populations | Long term (≥ 4 years) |
| Data-Privacy Hesitancy with Cloud Platforms | -0.9% | Elderly Medicare cohorts and privacy-conscious users | Medium term (2-4 years) |
| Semiconductor Sensor Supply Risk | -1.0% | Supply chain concentrated in Taiwan, Malaysia and Ireland | Medium term (2-4 years) |
| Source: Mordor Intelligence | |||
High Cost of CGM Devices
Out-of-pocket CGM costs range from USD 1,200 to USD 2,400 annually, compared to USD 180 to USD 360 for SMBG, a six-fold premium that dissuades uninsured and high-deductible plan members. Survey work revealed that 34% of Type 2 users abandoned CGM within 90 days due to cost concerns, reverting to bulk-purchased strips at USD 0.15 each. Rebates negotiated by pharmacy benefit managers seldom reach the checkout counter, preserving the sticker shock of USD 300-400 per month. Dexcom’s USD 99 Stelo cuts the list price but shifts the full cost to consumers, limiting its reach. Rural counties with fewer than 50,000 residents post CGM adoption rates 62% below urban peers, magnifying health inequity.
Semiconductor Sensor Supply Risk
CGM ASICs are mostly fabricated in Taiwan, and 2024 lead times doubled to 26 weeks as foundries prioritized automotive chips. Medtronic’s Simplera clearance was delayed five months, missing the Medicare open-enrollment window. Deloitte modeled a four-week wafer outage translating into 18-22% sensor shortfalls, compelling rationing toward federally covered patients. Abbott’s Kilkenny facility mitigates risk yet will not operate at scale until late 2027. Roche's USD 550 million Indianapolis expansion follows the same onshoring logic.
*Our forecasts treat driver/restraint impacts as directional, not additive. The impact forecasts reflect baseline growth, mix effects, and variable interactions.
Segment Analysis
By Device Type: CGM Sensors Displace Legacy Glucometers
Self-monitoring systems captured 56.71% of the United States blood glucose monitoring market share in 2025, driven by three-year hospital contracts that bundled meters and strips at USD 0.80-1.20 per test. Test strips dominate revenue because basal insulin users typically burn through 730-1,095 strips annually, and proprietary chemistries help keep customers loyal. Lancets face commoditization, with generic units at USD 0.02 eroding branded margins. Conversely, CGM sensors are slated to post a 13.69% CAGR through 2031, fueled by 365-day implantables and OTC channels. Sensors account for about 72% of CGM revenue due to their steady replacement cadence, while transmitters are subsidized to secure subscription economics.
Glucometers persist in critical-care wards because the CGM mean absolute relative difference of 9-12% is outside the ±5% insulin-dosing tolerance FDA set in 2024. The reuse of strips and lancets still undercuts sensor economics in low-income homes, despite infection control warnings. The transition from 14-day to 365-day sensors reduces the daily cost and mitigates adhesive-related dropout, which is observed in 18% of patients within six months. Dexcom’s Stelo exploits prediabetes retail channels, while safety-engineered hospital lancets maintain a 40% premium due to OSHA mandates.


By Patient Type: Type 1 Momentum Outpaces Type 2 Volume
Type 2 diabetes generated 62.27% revenue in 2025, but adoption of CGM among basal-insulin users remained below 12% before Medicare’s rule change. The American Diabetes Association now recommends CGM for every insulin regimen, yet primary-care inertia and cost hurdles slow translation into prescriptions. Type 1 patients total only 1.9 million but are adopting closed-loop technology at a rapid clip, driving a 14.46% forecast CAGR. DIY looping boosted time-in-range to 76% and cut severe hypoglycemia 54%, prompting insurers to reclassify CGM as standard-of-care.
Gestational diabetes represents the smallest slice, yet ACOG’s 2024 guidelines encourage CGM for insulin-treated pregnancies to reduce macrosomia, opening a nascent niche. Type 1 adoption exceeds 60% in urban centers where patient advocacy networks are robust. Type 2 uptake will accelerate as cost declines converge with employer wellness incentives, but SMBG will remain entrenched in diet- or oral-drug-managed populations. Gestational monitoring remains episodic, but it could shift to continuous monitoring if longitudinal outcome trials demonstrate lower neonatal ICU stays.
By End User: Diagnostic Centers Accelerate in Outpatient Pathways
Hospitals and clinics held 52.63% of United States blood glucose monitoring market size in 2025, benefiting from Joint Commission mandates for point-of-care testing and capitated readmission avoidance. FDA guidance now allows CGM in non-ICU beds, enabling remote nurse monitoring and trimming labor by USD 18 per patient-day. Diagnostic centers are expected to record a 15.13% CAGR as A1C testing bundles with same-day CGM initiation are favored by Medicare Advantage plans. Home care is the second-largest channel, leveraging telehealth CPT codes that reimburse clinicians USD 150-250 monthly for remote data reviews.
Electronic-health-record integration is a bottleneck; only 40% of hospitals had seamless CGM feeds in 2025. Quest and LabCorp's “test-to-treat” pilots reduce therapy initiation to seven days, demonstrating diagnostic-center agility. Rural broadband gaps still hamper home-upload models for 15% of households. Hospitals are piloting CGM-driven hypoglycemia early-warning systems that reduced code-blue events by 31% at Johns Hopkins in 2024. Diagnostic centers are therefore poised to capture a growing slice of the United States blood glucose monitoring market share as payers steer volume to controlled outpatient environments.

Geography Analysis
Florida, Arizona, and Pennsylvania collectively significant share of incremental CGM claims in the first year following Medicare’s coverage expansion, reflecting Medicare enrollment ratios above 20%. Southern states have prevalence rates exceeding 14% but lag in adoption, as Alabama and Mississippi each have fewer than three endocrinologists per 100,000 residents, compared to eight in Massachusetts. Medicaid prior authorization in Texas, Georgia, and North Carolina extends CGM approval by an average of 28 days, constraining penetration despite a high disease burden.
California, New York, and Texas account for 32% of national diabetes cases; all expanded Medicaid CGM coverage in 2024-25, but denial rates remain elevated, at 41% for initial Texas submissions. Integrated Midwest health systems such as Kaiser Permanente harmonize protocols across inpatient and outpatient sites, balancing SMBG and CGM utilization. Rural counties with limited broadband access experience a 62% lower CGM uptake and rely heavily on Bluetooth-only sensors, which lack real-time cloud uploads but satisfy patient privacy concerns.
Urban academic centers in Boston, San Francisco, and New York boast a CGM use rate of over 70% among Type 1 patients, driven by an early-adopter culture and alignment with insurers. Abbott, Dexcom, and Medtronic focus DTC campaigns in these Medicare-dense metros, leaving Medicaid-heavy rural zones understimulated. Without targeted investments in broadband and physician education, geographic inequity in the United States' blood glucose monitoring market is expected to widen through 2031.
Regulatory Landscape
Blood glucose monitoring systems in the United States are primarily regulated by the US Food and Drug Administration (FDA) as Class II devices, with self-monitoring blood glucose systems and continuous glucose monitoring (CGM) products typically entering the market via the 510(k) pathway under applicable device classifications (for example, BGMS under 21 CFR 862.1345). The FDA has also established interoperability-oriented categories (such as iCGM) that use special controls to support cross-vendor pairing of sensors and automated insulin delivery components, which helps shift the market toward modular device combinations rather than single-vendor lock-in.
In parallel, the FDA CLIA waiver framework remains important for home-use glucose monitoring adoption and retail-channel expansion, since it supports simpler use settings for qualified systems. Recent FDA activity in 2026 highlights continued throughput in near-patient and home-use glucose testing, including the June 2026 clearance of the cobas pulse blood glucose monitoring system and CLIA-waived clearances for additional branded BGMS offerings (for example, McKesson in April 2026 and a CVS Health Embrace TALKING system in March 2026). Alongside prescription CGM oversight, the FDA has also created dedicated consumer product codes for over-the-counter CGMs (as of 2024), supporting broader availability for non-traditional users beyond intensively managed insulin populations.
Competitive Landscape
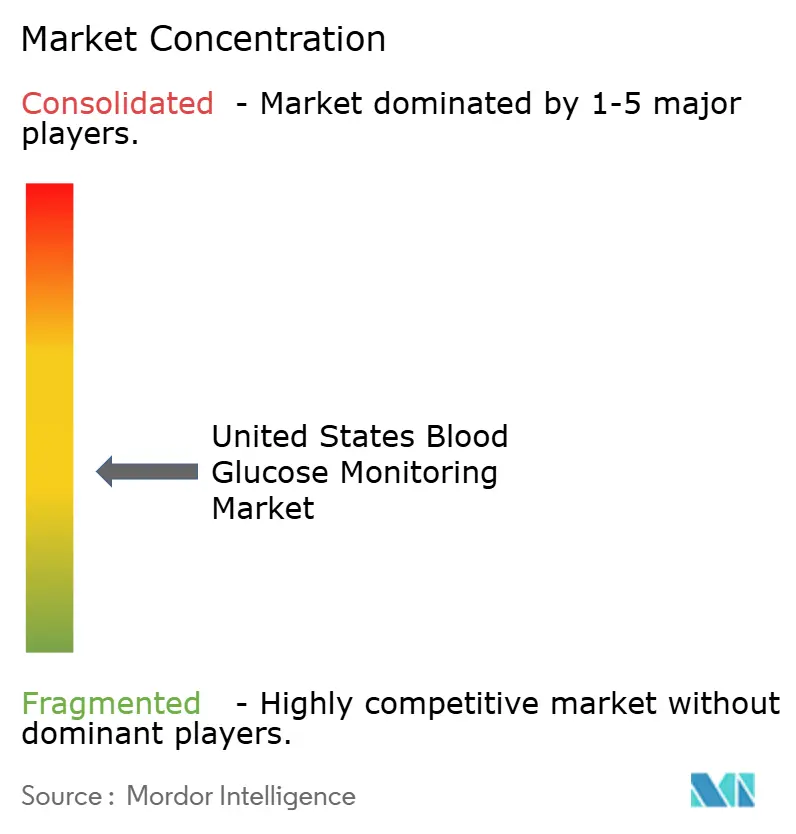
Abbott, Dexcom, and Roche collectively held a significant revenue share in 2025, positioning the United States blood glucose monitoring market as moderately concentrated. Abbott’s Kilkenny plant scales to 10 million Libre sensors annually, hedging ASIC dependence and supporting U.S. demand spikes. Dexcom’s G7 narrowed the mean absolute relative difference to 8.2%, enhancing competitive differentiation, while its OTC Stelo tapped a prediabetes audience that had been historically outside the reach of prescription products. Roche’s USD 550 million Indianapolis expansion underscores a capacity-first defense as Medicare’s flat USD 150 monthly reimbursement caps price competition.
Medtronic plans to spin off its USD 2.5 billion diabetes unit by April 2026, freeing capital for acquisitions and algorithm innovation. Senseonics’ Eversense 365 removes adhesive dermatitis pain points, and Ascensia is targeting elderly users with fragile skin. LifeScan’s October 2025 Chapter 11 restructuring wiped out 75% of its debt, yet it underscores the margin squeeze on strip-centric models. Patent filings reveal 127 active CGM sensor claims by Abbott, 94 by Dexcom, and 61 by Medtronic, with future differentiation likely shifting toward data analytics rather than hardware.
Litigation over electrochemical glucose-oxidase chemistry may intensify, but the FDA interoperability framework dilutes proprietary ecosystems, leveling the playing field toward algorithm-rich platforms. White-space persists in gestational diabetes and employer wellness, where adoption remains <12%. Vendors able to integrate sensor data into payer-approved chronic-care platforms stand to gain incremental United States blood glucose monitoring market share through 2031.
United States Blood Glucose Monitoring Industry Leaders
-
Abbott Diabetes Care
-
Dexcom Inc.
-
Lifescan
-
Roche Holding AG
-
Ascensia Diabetes Care
- *Disclaimer: Major Players sorted in no particular order
Market Opportunities and Future Outlook
A key whitespace in the United States blood glucose monitoring market is expanding monitoring beyond traditional insulin-intensive cohorts into earlier-risk and non-prescription pathways. OTC CGM approvals and consumer product codes created by the FDA (2024) reduce access friction, and the report context cites a large at-risk population (97.6 million adults with prediabetes). Market moves already underway reinforce this shift, including Dexcom's OTC Stelo pricing at USD 99 for a two-sensor month and Abbott securing US FDA clearance for OTC systems (Lingo and Libre Rio). Together, these create additional routes through pharmacies and direct-to-consumer models that are structurally different from durable medical equipment fulfillment, and can be paired with employer wellness and metabolic health programs.
Another opportunity centers on advancing interoperability and data-driven care workflows. FDA iCGM and related device classifications support cross-platform pump-sensor-controller combinations and align with patient-assembled closed-loop ecosystems. In clinical care, hospitals and outpatient pathways are increasing reliance on connected monitoring and remote review, supported by telehealth CPT codes for remote monitoring noted in the report context. At the same time, EHR integration remains a constraint, with only 40% of hospitals reporting seamless CGM feeds in 2025, leaving room for vendors that can simplify integration while addressing data-sharing preferences and privacy controls. On the product side, longer wear and next-generation sensing widen use-cases, including multi-analyte monitoring, as Abbott announced CE Mark progress for dual glucose-ketone sensing (Libre Duo) and an FDA submission, aligning with growing clinical attention to complications such as diabetic ketoacidosis.
Recent Industry Developments
- June 2026: Abbott released study data at the 86th Scientific Sessions of the American Diabetes Association showing increased DKA-related hospitalizations in the U.S., highlighting the need for ketone monitoring technology. The data supports a market opportunity for expanded ketone monitoring within CGM ecosystems and may accelerate adoption of integrated solutions.
- May 2026: Abbott received CE Mark for Libre Duo and Libre Duo 10 Day systems for glucose and ketone monitoring and filed a regulatory submission with FDA. The expansion of the CGM portfolio into dual-sensing and OTC space broadens the addressable patient base and adds to momentum for consumer-ready CGM adoption, which could reshape competition and pricing.
- February 2026: LifeScan announced a partnership with i-SENS to develop a CGM system under the OneTouch Vita brand. The strategic alliance co-develops next-gen CGM technology and strengthens LifeScan's pipeline and supply-channel capabilities, with potential implications for the timing of a US entry for OneTouch Vita.
Research Methodology Framework and Report Scope
Market Definition and Coverage
This market covers the value of products used to measure and track blood glucose in the United States, spanning self-monitoring tools and continuous glucose monitoring systems, with revenues captured at the device and consumables level.
Scope exclusions: We exclude diabetes drugs, general lab chemistry analyzers not used for glucose monitoring workflows, and non-medical wellness gadgets that do not measure glucose.
Segmentation Overview
- By Device Type
- SMBG Devices
- Glucometers
- Test Strips
- Lancets
- CGM Devices
- Sensors
- Durables
- SMBG Devices
- By Patient Type
- Type 1 Diabetes
- Type 2 Diabetes
- Gestational Diabetes
- By End-user
- Hospitals & Clinics
- Homecare Settings
- Diagnostic Centers
Data Sources, Market Sizing, and Validation
Desk Research
Desk research was used to anchor the model in measurable demand signals and policy realities in the United States. We relied on public health and utilization indicators such as diabetes prevalence and care patterns from sources such as CDC and NIH, and device safety and approval context from FDA.
To convert those signals into revenue logic, supporting references were pulled from sources such as CMS coverage and payment rules, USITC trade statistics where relevant for device flows, and peer-reviewed journals that discuss CGM and SMBG adoption and testing frequency. We also reviewed company filings, investor presentations, and reputable healthcare press to understand product mix shifts between sensors, meters, strips, and lancets, and then cross-checked key assumptions using paid subscriptions for company financials, news and financials, and patent databases. The sources listed are illustrative only, and we used many other public and paid references to collect, verify, and clarify data points.
Primary Interviews and Surveys
Primary work focused on testing the real-world split between CGM and SMBG, and validating how often consumables are used under different patient profiles and care settings. We spoke with a mix of manufacturers, channel participants, clinicians, and payor-side experts across the United States so that adoption drivers, reimbursement shifts, and ASP movement could be triangulated before finalizing the model.
Distribution of primary research fieldwork respondents
| Company type | Respondent position |
|---|---|
| Top tier: 25% | CXOs: 13% |
| Mid tier: 60% | Functional/Unit leaders: 27% |
| Smaller Players: 15% | Managers: 60% |
Market-Sizing & Forecasting
Sizing starts with a top-down demand pool build that links the diagnosed and treated diabetes population to monitoring intensity, and then converts that activity into units for CGM sensors and SMBG consumables in the United States. While the core model is top-down, selective bottom-up approximations were used as guardrails, such as supplier revenue roll-ups from public financials and channel checks on pricing and mix.
Inputs were chosen because they can be explained and refreshed without needing hard-to-access datasets. Typical variables include the share of diabetes patients on insulin therapy, CGM eligibility and coverage trends, refill behavior for test strips and lancets, sensor wear time and replacement cadence, and average selling price movement by product type as newer CGM formats scale. Where direct unit data was patchy, we handled gaps by using conservative ranges from primary interviews and then stress-testing the impact on total revenue.
Forecasts use scenario analysis, with a base case shaped by expert views on reimbursement expansion, care-at-home uptake, and the ongoing shift from strip-heavy SMBG to sensor-heavy CGM. Each scenario is checked against practical constraints such as patient onboarding capacity, clinician workflow acceptance, and the pace of price normalization in high-volume channels.
Data Validation & Update Cycle
Outputs were validated through triangulation across independent signals, and unusual movements were flagged for review before sign-off. We compared totals and growth rates against external indicators such as diabetes population trends, coverage changes, and observed shifts in product mix, and then re-contacted sources when assumptions created large variances.
Before release, the model goes through a multi-step analyst review where unit math, pricing logic, and year-to-year transitions are checked for consistency. Reports are refreshed annually, and interim updates are made when material changes affect pricing, access, or utilization patterns. Right before delivery, a fresh pass is completed so clients receive the latest updated view.
Mordor Intelligence's US Blood Glucose Monitoring Market Size Measured Against Other Published Estimates
Published market values for US blood glucose monitoring often do not line up because each estimate can be built on a different product boundary, time period, and view of how fast CGM replaces SMBG. In our checks, the spread is usually explained by what is counted as recurring revenue, how pricing is averaged across channels, and how frequently the underlying assumptions are refreshed.
The main gap comes from whether recurring CGM sensors and SMBG consumables are fully counted as ongoing usage-based revenue, where Mordor Intelligence treats sensor replacement cadence and strip and lancet consumption as the core drivers instead of relying on a narrower device-only snapshot.
Benchmark comparison
| Source | Market Size | Gaps in Research Methodology |
|---|---|---|
| Mordor Intelligence | USD 14.67 B (2025) | |
| Independent Research House A | USD 14.80 B (2026) | Uses a different base year and a longer horizon, and the revenue build appears to blend accessories with devices without clearly separating sensor replacement cadence and strip usage intensity. |
| Newswire Summary B | USD 4.69 B (2026) | Looks closer to a devices-focused view with an older base year, which can undercount recurring consumables and can lag recent CGM expansion when ASP and mix are not refreshed. |
The table shows that the largest differences come from scope (devices-only versus devices plus consumables) and from how recurring use is translated into annual units and revenue. By keeping the drivers tied to patient activity, replacement cadence, and realistic pricing by product type, the model stays traceable and easier to reproduce when assumptions need to be updated.
Key Questions Answered in the Report
What is the current value of the United States blood glucose monitoring market?
The market was valued at USD 16.84 billion in 2026 and is on track to reach USD 30.83 billion by 2031.
Which device segment is growing fastest?
Continuous glucose monitor devices are expected to post a 13.69% CAGR through 2031, outpacing legacy glucometers.
How does Medicare coverage affect CGM adoption?
Medicare’s 2023 expansion added 3.7 million eligible insulin users, driving a 340% jump in claims within a year.
Which patient group shows the highest CGM adoption rate?
Type 1 diabetes patients in urban academic centers have adoption levels exceeding 60% due to closed-loop therapy demand.
What supply-chain risk threatens sensor availability?
Extended 26-week lead times for semiconductor ASICs could trim sensor output by up to 22% during a four-week wafer interruption.