| Study Period | 2017 - 2030 |
| Base Year For Estimation | 2024 |
| Forecast Data Period | 2025 - 2030 |
| Market Size (2025) | USD 86.72 Billion |
| Market Size (2030) | USD 105 Billion |
| CAGR (2025 - 2030) | 3.90 % |
| Market Concentration | High |
Major Players*Disclaimer: Major Players sorted in no particular order |

US Aviation Market Analysis
The US Aviation Market size is estimated at 86.72 billion USD in 2025, and is expected to reach 105 billion USD by 2030, growing at a CAGR of 3.90% during the forecast period (2025-2030).
The US aviation industry demonstrates robust recovery and transformation, with airlines significantly expanding their operational capacity and modernizing their fleets. US airlines carried 853 million passengers in 2022, marking a substantial increase from 658 million in 2021, with carriers recovering 92% of their total traffic levels. Major carriers are actively pursuing fleet modernization initiatives, as evidenced by significant aircraft orders in 2023, including United Airlines' discussions for 100 Boeing 787 Dreamliners, Delta Airlines' order for 20 A330s, and American Airlines' commitment to 30 Boeing 787 aircraft. These strategic investments reflect the industry's focus on operational efficiency and technological advancement.
The integration of advanced aviation technology and sustainable practices is reshaping the aviation industry landscape, with manufacturers and operators increasingly emphasizing environmental consciousness and operational efficiency. Airlines are investing in next-generation aircraft featuring improved fuel efficiency, reduced emissions, and enhanced passenger comfort. The industry's commitment to sustainability is reflected in the development of sustainable aviation fuel (SAF) initiatives and the adoption of more fuel-efficient aircraft models, demonstrating a balanced approach to growth and environmental responsibility.
The cargo and e-commerce sectors continue to drive significant aviation market growth, with total US e-commerce sales reaching a record USD 1.04 trillion in 2022. This trend gained further momentum in Q1 2023, with e-commerce sales hitting USD 272.6 billion, the highest-ever sales recorded in a single quarter. The surge in online retail activity has catalyzed demand for air cargo services, prompting carriers to expand their freight capabilities and optimize their aviation services to meet evolving market demands.
The defense sector remains a crucial component of the US aviation market, with the country accounting for 39% of global defense spending in 2022. This commitment to military aviation capabilities is exemplified by significant developments in 2023, including Boeing's contract for new AH-64E Apache helicopters under a USD 1.95 billion four-year order. The continued investment in military aviation technologies, including advanced fighter aircraft, transport planes, and helicopters, underscores the strategic importance of maintaining technological superiority and operational readiness in the defense sector.
US Aviation Market Trends
Ease of restrictions and rising passenger travel are driving air passenger traffic
- US airlines carried 194 million more passengers in 2022 than in 2021, up by 30% Y-o-Y. For the full year 2022, January through December, US airlines carried 853 million passengers, up from 658 million in 2021 and 388 million in 2020. As a result, US carriers recovered 92% of their pre-pandemic levels in total, 88.9% of international traffic, and 92.45% of domestic traffic.
- In terms of the planned capacity levels for the summer 2023 season based on schedules, the number of seats US airlines planned to operate was about 6% higher than during the summer of 2019. About 715.6 million seats were scheduled to operate in the summer of 2023, compared with 673.9 million four years ago, before the pandemic. The big three network carriers saw changes as well, with American Airlines scheduling 1.2% more seats compared to 2019, while Delta Air Lines was down by 0.2%, and United Airlines was up by 3.3%. Southwest Airlines intended to operate 142.5 million seats, up by 16.4% in 2019, and the capacity offered by Spirit Airlines was to be some 42.8% higher with 35.4 million seats.
- The drop in travel demand and the associated losses faced by major airlines have resulted in airlines deferring their expected deliveries, mostly of widebody aircraft, and restructuring their existing fleet through the early retirement of a few aircraft models. For instance, in 2020, Delta Air Lines retired 227 aircraft to reduce the impact of the COVID-19 pandemic on revenue. Such deferrals impacted the delivery schedules of aircraft OEMs and compelled them to reduce their production rates in 2020 and 2021.

Understand The Key Trends Shaping This Market
Download PDF
The increase in defense spending can be attributed to the various geopolitical threats faced by the US
- In 2022, the US accounted for 39% of global defense spending military spending, which increased by USD 877 billion in 2022, or 0.7%. In 2022, the US released the Department of the Air Force budget, which outlined that for FY 2023, the budget request was approximately USD 194.0 billion, a USD 20.2 billion or 11.7% increase from the FY 2022 request. The US DoD proposed USD 276.0 billion in acquisition funds for FY2023 (Procurement and Research, Development, Test, and Evaluation (RDT&E)), which comprised USD 145.9 billion for Procurement and USD 130.1 billion for RDT&E. The financing requested in the budget is a balanced portfolio approach to implementing the National Defense Strategy recommendations.
- Of the USD 276 billion in the request, USD 56.5 billion (USD 16.8 billion for RDT&E and USD 39.6 billion for Procurement) will finance aircraft and related systems, including money for aircraft R&D, aircraft acquisition, initial spares, and aircraft support equipment. The single most expensive defense program, the fifth generation F-35 Joint Strike Fighter (JSF), has USD 11.0 billion in requests for 61 aircraft for the Navy (F-35C), Marine Corps (F-35B & C), and Air Force (F-35A). Funding for FY 2023 also included the purchase of 24 F-15EX, 79 logistics and support aircraft, 119 rotary wing aircraft, and 12 UAV/UAS.
- The US Army's budget request for FY 2022 was USD 173 billion, the Navy's was USD 212 billion, and the Air Force's request was USD 213 billion. The aircraft and related systems category includes the following subgroups: Combat Aircraft (USD 23.0 billion), Cargo Aircraft (USD 5.0 billion), Support Aircraft (USD 1.6 billion), with the remaining budget for UAS, aircraft support, technology development, and aircraft modifications.

OTHER KEY INDUSTRY TRENDS COVERED IN THE REPORT
- The growing e-commerce industry is driving the growth of air freight transportation
- Rising air travel is driving the growth of RPKs in the US
- Fleet modernization and growing modern warfare are the driving factors for the country's active fleet enhancement
- The country's GDP growth is anticipated to be supported by the increasing economic stability
- The increase in inflation may hinder air travelers, but economic growth is expected to have a positive effect on the market
- The rise in the US HNWI population acting as the major growth driver for the market
Segment Analysis: Aircraft Type
Commercial Aviation Segment in US Aviation Market
Commercial aviation dominates the US aviation market, commanding approximately 53% aviation market share in 2024. This segment's strong position is primarily driven by the robust recovery in air passenger traffic and the increasing demand for new aircraft deliveries from major US carriers. The segment benefits from airlines' fleet modernization initiatives and the growing emphasis on fuel-efficient aircraft. Major US carriers, including American Airlines, United Airlines, and Delta Air Lines, are actively expanding their fleets with next-generation narrowbody and widebody aircraft to meet the rising travel demand and replace aging aircraft. The commercial aviation segment also encompasses freighter aircraft, which have seen increased demand due to the growth in e-commerce and air cargo operations.
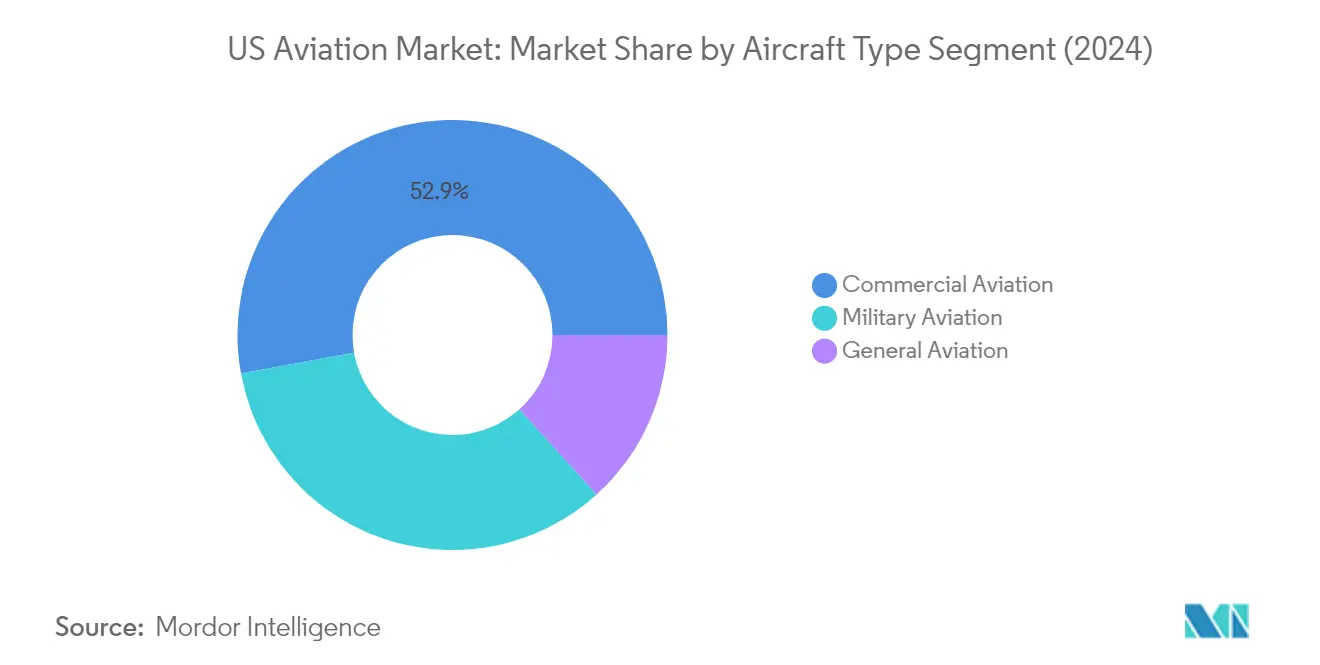
Military Aviation Segment in US Aviation Market
The military aviation segment is experiencing significant growth momentum, driven by increased defense spending and modernization programs. The segment is witnessing substantial investments in next-generation fighter aircraft, transport aircraft, and military helicopters. The US Air Force's procurement plans for F-35 jets, B-21 Raider bombers, and KC-46A Pegasus tankers are major growth drivers. The military aviation sector is also benefiting from the development of advanced combat capabilities and the integration of cutting-edge technologies. The focus on maintaining air superiority and enhancing strategic airlift capabilities continues to drive investments in both fixed-wing and rotary-wing platforms, making this segment particularly dynamic in terms of technological advancement and capability enhancement.
Remaining Segments in Aircraft Type
The general aviation segment, while smaller in market share, plays a vital role in the US aviation market by serving diverse needs from private and business aviation to specialized operations. This segment includes business jets, which cater to corporate travel and high-net-worth individuals, as well as various other aircraft types used for training, agricultural operations, and recreational flying. The segment's dynamics are influenced by factors such as corporate travel demands, private aviation preferences, and the growing need for pilot training aircraft. The versatility of general aviation aircraft and their ability to serve niche markets continues to make this segment an essential part of the overall aviation industry ecosystem.
US Aviation Industry Overview
Top Companies in US Aviation Market
The leading companies in the US aviation market are demonstrating a strong commitment to innovation through the development of next-generation aircraft platforms that incorporate advanced aviation technology and sustainable solutions. Companies are focusing on expanding their aviation manufacturing capabilities and service networks to enhance operational efficiency and market reach. Strategic partnerships and collaborations, particularly in areas like electric aviation and sustainable fuel development, have become increasingly common as companies aim to address evolving market demands. Major players are also investing in the digitalization and automation of production processes while strengthening their aftermarket aviation services capabilities. The emphasis on research and development of new materials, propulsion systems, and aircraft designs reflects the industry's push toward more fuel-efficient and environmentally friendly solutions.
Consolidated Market Led By Global Players
The US aviation market exhibits a highly consolidated structure dominated by large global aerospace conglomerates with diverse product portfolios spanning commercial, military, and general aviation segments. These established players leverage their extensive manufacturing capabilities, technological expertise, and long-standing relationships with government and commercial customers to maintain their market positions. The market is characterized by high entry barriers due to significant capital requirements, complex regulatory frameworks, and the need for specialized technological expertise, which limits new entrant penetration.
The competitive dynamics are shaped by the presence of both integrated aerospace manufacturers and specialized aircraft producers focusing on specific market segments. While the commercial and military aviation segments are dominated by a few major players, the general aviation segment shows relatively more fragmentation with multiple specialized manufacturers. The industry has witnessed strategic acquisitions and partnerships aimed at expanding product portfolios, accessing new technologies, and strengthening market presence, particularly in emerging segments like electric aircraft and advanced air mobility solutions.
Innovation and Adaptability Drive Future Success
Success in the US aviation market increasingly depends on companies' ability to innovate while maintaining operational efficiency and financial stability. Incumbent players must focus on developing next-generation aircraft platforms, investing in sustainable technologies, and expanding their service networks to maintain their competitive advantage. Companies need to strengthen their supply chain resilience, embrace digital transformation, and develop closer relationships with key customers while maintaining flexibility to adapt to changing market conditions and regulatory requirements.
For emerging players and market contenders, success lies in identifying and capitalizing on specific market niches while building strong technological capabilities and strategic partnerships. Companies must focus on developing innovative solutions that address specific customer needs or market gaps while maintaining cost competitiveness. The ability to navigate complex regulatory requirements, secure necessary certifications, and build strong relationships with suppliers and customers will be crucial for long-term success. Additionally, companies need to maintain a strong focus on sustainability initiatives and environmental compliance while developing robust risk management strategies to address market uncertainties. The development of aviation infrastructure and capturing market share in the aviation industry will be crucial for sustaining growth.
US Aviation Market Leaders
-
Airbus SE
-
Embraer
-
Lockheed Martin Corporation
-
Textron Inc.
-
The Boeing Company
- *Disclaimer: Major Players sorted in no particular order

Need More Details on Market Players and Competitors?
Download PDF
US Aviation Market News
- June 2023: Delta Air Lines Inc. is in talks with Airbus SE (AIR.PA) for a jumbo jet order. Orders include both A350 and A330neo dual-aisle.
- March 2023: Boeing has been awarded a contract by the US government to manufacture 184 AH-64E Apache attack helicopters for the US military and international customers. The US government announced USD 1.95 million, indicating that the helicopter will be delivered to the US military and overseas buyers - specifically Australia and Egypt - as a part of the paramilitary process to the Foreign Service (FMS) from the US government. Contract completion is expected by the end of 2027.
- February 2023: Boeing received a contract from the US Air Force for E-7 Airborne Early Warning & Control Aircraft.
Free With This Report
We provide a complimentary and exhaustive set of data points on global and regional metrics that present the fundamental structure of the industry. Presented in the form of 45+ free charts, the section covers data on commercial aircraft deliveries by manufacturer, backlogs of commercial aircraft, active military aircraft fleet by type of aircraft, overall business jets and helicopters fleet by manufacturer and also classified by type of ownership.


US Aviation Market Report - Table of Contents
1. EXECUTIVE SUMMARY & KEY FINDINGS
2. REPORT OFFERS
3. INTRODUCTION
- 3.1 Study Assumptions & Market Definition
- 3.2 Scope of the Study
- 3.3 Research Methodology
4. KEY INDUSTRY TRENDS
- 4.1 Air Passenger Traffic
- 4.2 Air Transport Freight
- 4.3 Gross Domestic Product
- 4.4 Revenue Passenger Kilometers (rpk)
- 4.5 Inflation Rate
- 4.6 Active Fleet Data
- 4.7 Defense Spending
- 4.8 High-net-worth Individual (hnwi)
- 4.9 Regulatory Framework
- 4.10 Value Chain Analysis
5. MARKET SEGMENTATION (includes market size in Value in USD and Volume, Forecasts up to 2030 and analysis of growth prospects)
-
5.1 Aircraft Type
- 5.1.1 Commercial Aviation
- 5.1.1.1 By Sub Aircraft Type
- 5.1.1.1.1 Freighter Aircraft
- 5.1.1.1.2 Passenger Aircraft
- 5.1.1.1.2.1 By Body Type
- 5.1.1.1.2.1.1 Narrowbody Aircraft
- 5.1.1.1.2.1.2 Widebody Aircraft
- 5.1.2 General Aviation
- 5.1.2.1 By Sub Aircraft Type
- 5.1.2.1.1 Business Jets
- 5.1.2.1.1.1 By Body Type
- 5.1.2.1.1.1.1 Large Jet
- 5.1.2.1.1.1.2 Light Jet
- 5.1.2.1.1.1.3 Mid-Size Jet
- 5.1.2.1.2 Piston Fixed-Wing Aircraft
- 5.1.2.1.3 Others
- 5.1.3 Military Aviation
- 5.1.3.1 By Sub Aircraft Type
- 5.1.3.1.1 Fixed-Wing Aircraft
- 5.1.3.1.1.1 By Body Type
- 5.1.3.1.1.1.1 Multi-Role Aircraft
- 5.1.3.1.1.1.2 Training Aircraft
- 5.1.3.1.1.1.3 Transport Aircraft
- 5.1.3.1.1.1.4 Others
- 5.1.3.1.2 Rotorcraft
- 5.1.3.1.2.1 By Body Type
- 5.1.3.1.2.1.1 Multi-Mission Helicopter
- 5.1.3.1.2.1.2 Transport Helicopter
- 5.1.3.1.2.1.3 Others
6. COMPETITIVE LANDSCAPE
- 6.1 Key Strategic Moves
- 6.2 Market Share Analysis
- 6.3 Company Landscape
-
6.4 Company Profiles
- 6.4.1 Air Tractor Inc.
- 6.4.2 Airbus SE
- 6.4.3 ATR
- 6.4.4 Bombardier Inc.
- 6.4.5 Cirrus Design Corporation
- 6.4.6 Dassault Aviation
- 6.4.7 Embraer
- 6.4.8 General Dynamics Corporation
- 6.4.9 Honda Motor Co., Ltd.
- 6.4.10 Leonardo S.p.A
- 6.4.11 Lockheed Martin Corporation
- 6.4.12 MD Helicopters LLC.
- 6.4.13 Northrop Grumman Corporation
- 6.4.14 Pilatus Aircraft Ltd
- 6.4.15 Piper Aircraft Inc.
- 6.4.16 Robinson Helicopter Company Inc.
- 6.4.17 Textron Inc.
- 6.4.18 The Boeing Company
- *List Not Exhaustive
7. KEY STRATEGIC QUESTIONS FOR AVIATION CEOS
8. APPENDIX
-
8.1 Global Overview
- 8.1.1 Overview
- 8.1.2 Porter’s Five Forces Framework
- 8.1.3 Global Value Chain Analysis
- 8.1.4 Market Dynamics (DROs)
- 8.2 Sources & References
- 8.3 List of Tables & Figures
- 8.4 Primary Insights
- 8.5 Data Pack
- 8.6 Glossary of Terms
You Can Purchase Parts Of This Report. Check Out Prices For Specific Sections
Get Price Break-up Now
List of Tables & Figures
- Figure 1:
- AIR PASSENGER TRAFFIC, NUMBER OF PASSENGERS TRAVELLED, UNITED STATES, 2017 - 2030
- Figure 2:
- AIR TRANSPORT FREIGHT, MILLION TON-KM, UNITED STATES, 2017 - 2030
- Figure 3:
- DISTANCE TRAVELLED BY REVENUE PASSENGERS, RPK, UNITED STATES, 2017 - 2030
- Figure 4:
- INFLATION RATE, %, UNITED STATES, 2017 - 2030
- Figure 5:
- ACTIVE MILITARY AIRCRAFT FLEET, NUMBER OF AIRCRAFT, VOLUME, UNITED STATES, 2016 - 2030
- Figure 6:
- DEFENSE SPENDING, USD, UNITED STATES, 2017 - 2030
- Figure 7:
- POPULATION OF HIGH-NET-WORTH INDIVIDUAL (HNWI), NUMBER OF HNWIS, UNITED STATES, 2017 - 2030
- Figure 8:
- NUMBER OF NEW AIRCRAFT DELIVERIES, VOLUME, UNITED STATES, 2017 - 2030
- Figure 9:
- NUMBER OF NEW AIRCRAFT DELIVERIES, USD, UNITED STATES, 2017 - 2030
- Figure 10:
- NEW AIRCRAFT DELIVERIES BY AIRCRAFT TYPE, VOLUME, UNITED STATES, 2017 - 2030
- Figure 11:
- NEW AIRCRAFT DELIVERIES BY AIRCRAFT TYPE, USD, UNITED STATES, 2017 - 2030
- Figure 12:
- MARKET SHARE BY AIRCRAFT TYPE, VOLUME %, UNITED STATES, 2017 VS 2023 VS 2030
- Figure 13:
- MARKET SHARE BY AIRCRAFT TYPE, VALUE %, UNITED STATES, 2017 VS 2023 VS 2030
- Figure 14:
- COMMERCIAL AVIATION DELIVERIES BY SUB AIRCRAFT TYPE, VOLUME, UNITED STATES, 2017 - 2030
- Figure 15:
- COMMERCIAL AVIATION DELIVERIES BY SUB AIRCRAFT TYPE, USD, UNITED STATES, 2017 - 2030
- Figure 16:
- COMMERCIAL AVIATION DELIVERIES BY SUB AIRCRAFT TYPE, VOLUME %, UNITED STATES, 2017 VS 2023 VS 2030
- Figure 17:
- COMMERCIAL AVIATION DELIVERIES BY SUB AIRCRAFT TYPE, VALUE %, UNITED STATES, 2017 VS 2023 VS 2030
- Figure 18:
- US AVIATION MARKET, BY FREIGHTER AIRCRAFT, UNITS, 2017 - 2030
- Figure 19:
- US AVIATION MARKET, BY FREIGHTER AIRCRAFT, USD, 2017 - 2030
- Figure 20:
- US AVIATION MARKET, BY SUB AIRCRAFT TYPE, USD, %, 2023 VS 2030
- Figure 21:
- PASSENGER AIRCRAFT DELIVERIES BY BODY TYPE, VOLUME, UNITED STATES, 2017 - 2030
- Figure 22:
- PASSENGER AIRCRAFT DELIVERIES BY BODY TYPE, USD, UNITED STATES, 2017 - 2030
- Figure 23:
- PASSENGER AIRCRAFT DELIVERIES BY BODY TYPE, VOLUME %, UNITED STATES, 2017 VS 2023 VS 2030
- Figure 24:
- PASSENGER AIRCRAFT DELIVERIES BY BODY TYPE, VALUE %, UNITED STATES, 2017 VS 2023 VS 2030
- Figure 25:
- US AVIATION MARKET, BY NARROWBODY AIRCRAFT, UNITS, 2017 - 2030
- Figure 26:
- US AVIATION MARKET, BY NARROWBODY AIRCRAFT, USD, 2017 - 2030
- Figure 27:
- US AVIATION MARKET, BY BODY TYPE, USD, %, 2023 VS 2030
- Figure 28:
- US AVIATION MARKET, BY WIDEBODY AIRCRAFT, UNITS, 2017 - 2030
- Figure 29:
- US AVIATION MARKET, BY WIDEBODY AIRCRAFT, USD, 2017 - 2030
- Figure 30:
- US AVIATION MARKET, BY BODY TYPE, USD, %, 2023 VS 2030
- Figure 31:
- GENERAL AVIATION DELIVERIES BY SUB AIRCRAFT TYPE, VOLUME, UNITED STATES, 2017 - 2030
- Figure 32:
- GENERAL AVIATION DELIVERIES BY SUB AIRCRAFT TYPE, USD, UNITED STATES, 2017 - 2030
- Figure 33:
- GENERAL AVIATION DELIVERIES BY SUB AIRCRAFT TYPE, VOLUME %, UNITED STATES, 2017 VS 2023 VS 2030
- Figure 34:
- GENERAL AVIATION DELIVERIES BY SUB AIRCRAFT TYPE, VALUE %, UNITED STATES, 2017 VS 2023 VS 2030
- Figure 35:
- BUSINESS JETS DELIVERIES BY BODY TYPE, VOLUME, UNITED STATES, 2017 - 2030
- Figure 36:
- BUSINESS JETS DELIVERIES BY BODY TYPE, USD, UNITED STATES, 2017 - 2030
- Figure 37:
- BUSINESS JETS DELIVERIES BY BODY TYPE, VOLUME %, UNITED STATES, 2017 VS 2023 VS 2030
- Figure 38:
- BUSINESS JETS DELIVERIES BY BODY TYPE, VALUE %, UNITED STATES, 2017 VS 2023 VS 2030
- Figure 39:
- US AVIATION MARKET, BY LARGE JET, UNITS, 2017 - 2030
- Figure 40:
- US AVIATION MARKET, BY LARGE JET, USD, 2017 - 2030
- Figure 41:
- US AVIATION MARKET, BY BODY TYPE, USD, %, 2023 VS 2030
- Figure 42:
- US AVIATION MARKET, BY LIGHT JET, UNITS, 2017 - 2030
- Figure 43:
- US AVIATION MARKET, BY LIGHT JET, USD, 2017 - 2030
- Figure 44:
- US AVIATION MARKET, BY BODY TYPE, USD, %, 2023 VS 2030
- Figure 45:
- US AVIATION MARKET, BY MID-SIZE JET, UNITS, 2017 - 2030
- Figure 46:
- US AVIATION MARKET, BY MID-SIZE JET, USD, 2017 - 2030
- Figure 47:
- US AVIATION MARKET, BY BODY TYPE, USD, %, 2023 VS 2030
- Figure 48:
- US AVIATION MARKET, BY PISTON FIXED-WING AIRCRAFT, UNITS, 2017 - 2030
- Figure 49:
- US AVIATION MARKET, BY PISTON FIXED-WING AIRCRAFT, USD, 2017 - 2030
- Figure 50:
- US AVIATION MARKET, BY SUB AIRCRAFT TYPE, USD, %, 2023 VS 2030
- Figure 51:
- US AVIATION MARKET, BY OTHERS, UNITS, 2017 - 2030
- Figure 52:
- US AVIATION MARKET, BY OTHERS, USD, 2017 - 2030
- Figure 53:
- US AVIATION MARKET, BY SUB AIRCRAFT TYPE, USD, %, 2023 VS 2030
- Figure 54:
- MILITARY AVIATION DELIVERIES BY SUB AIRCRAFT TYPE, VOLUME, UNITED STATES, 2017 - 2030
- Figure 55:
- MILITARY AVIATION DELIVERIES BY SUB AIRCRAFT TYPE, USD, UNITED STATES, 2017 - 2030
- Figure 56:
- MILITARY AVIATION DELIVERIES BY SUB AIRCRAFT TYPE, VOLUME %, UNITED STATES, 2017 VS 2023 VS 2030
- Figure 57:
- MILITARY AVIATION DELIVERIES BY SUB AIRCRAFT TYPE, VALUE %, UNITED STATES, 2017 VS 2023 VS 2030
- Figure 58:
- FIXED-WING AIRCRAFT DELIVERIES BY BODY TYPE, VOLUME, UNITED STATES, 2017 - 2030
- Figure 59:
- FIXED-WING AIRCRAFT DELIVERIES BY BODY TYPE, USD, UNITED STATES, 2017 - 2030
- Figure 60:
- FIXED-WING AIRCRAFT DELIVERIES BY BODY TYPE, VOLUME %, UNITED STATES, 2017 VS 2023 VS 2030
- Figure 61:
- FIXED-WING AIRCRAFT DELIVERIES BY BODY TYPE, VALUE %, UNITED STATES, 2017 VS 2023 VS 2030
- Figure 62:
- US AVIATION MARKET, BY MULTI-ROLE AIRCRAFT, UNITS, 2017 - 2030
- Figure 63:
- US AVIATION MARKET, BY MULTI-ROLE AIRCRAFT, USD, 2017 - 2030
- Figure 64:
- US AVIATION MARKET, BY BODY TYPE, USD, %, 2023 VS 2030
- Figure 65:
- US AVIATION MARKET, BY TRAINING AIRCRAFT, UNITS, 2017 - 2030
- Figure 66:
- US AVIATION MARKET, BY TRAINING AIRCRAFT, USD, 2017 - 2030
- Figure 67:
- US AVIATION MARKET, BY BODY TYPE, USD, %, 2023 VS 2030
- Figure 68:
- US AVIATION MARKET, BY TRANSPORT AIRCRAFT, UNITS, 2017 - 2030
- Figure 69:
- US AVIATION MARKET, BY TRANSPORT AIRCRAFT, USD, 2017 - 2030
- Figure 70:
- US AVIATION MARKET, BY BODY TYPE, USD, %, 2023 VS 2030
- Figure 71:
- US AVIATION MARKET, BY OTHERS, UNITS, 2017 - 2030
- Figure 72:
- US AVIATION MARKET, BY OTHERS, USD, 2017 - 2030
- Figure 73:
- US AVIATION MARKET, BY BODY TYPE, USD, %, 2023 VS 2030
- Figure 74:
- ROTORCRAFT DELIVERIES BY BODY TYPE, VOLUME, UNITED STATES, 2017 - 2030
- Figure 75:
- ROTORCRAFT DELIVERIES BY BODY TYPE, USD, UNITED STATES, 2017 - 2030
- Figure 76:
- ROTORCRAFT DELIVERIES BY BODY TYPE, VOLUME %, UNITED STATES, 2017 VS 2023 VS 2030
- Figure 77:
- ROTORCRAFT DELIVERIES BY BODY TYPE, VALUE %, UNITED STATES, 2017 VS 2023 VS 2030
- Figure 78:
- US AVIATION MARKET, BY MULTI-MISSION HELICOPTER, UNITS, 2017 - 2030
- Figure 79:
- US AVIATION MARKET, BY MULTI-MISSION HELICOPTER, USD, 2017 - 2030
- Figure 80:
- US AVIATION MARKET, BY BODY TYPE, USD, %, 2023 VS 2030
- Figure 81:
- US AVIATION MARKET, BY TRANSPORT HELICOPTER, UNITS, 2017 - 2030
- Figure 82:
- US AVIATION MARKET, BY TRANSPORT HELICOPTER, USD, 2017 - 2030
- Figure 83:
- US AVIATION MARKET, BY BODY TYPE, USD, %, 2023 VS 2030
- Figure 84:
- US AVIATION MARKET, BY OTHERS, UNITS, 2017 - 2030
- Figure 85:
- US AVIATION MARKET, BY OTHERS, USD, 2017 - 2030
- Figure 86:
- US AVIATION MARKET, BY BODY TYPE, USD, %, 2023 VS 2030
- Figure 87:
- MOST ACTIVE COMPANIES, NUMBER OF STRATEGIC MOVES, UNITED STATES, 2018-2023
- Figure 88:
- MOST ADOPTED STRATEGIES, COUNT, UNITED STATES, 2018 - 2023
- Figure 89:
- MAJOR PLAYERS REVENUE SHARE (%), UNITED STATES
US Aviation Industry Segmentation
Commercial Aviation, General Aviation, Military Aviation are covered as segments by Aircraft Type.| Aircraft Type | Commercial Aviation | By Sub Aircraft Type | Freighter Aircraft | |||
| Passenger Aircraft | By Body Type | Narrowbody Aircraft | ||||
| Widebody Aircraft | ||||||
| General Aviation | By Sub Aircraft Type | Business Jets | By Body Type | Large Jet | ||
| Light Jet | ||||||
| Mid-Size Jet | ||||||
| Piston Fixed-Wing Aircraft | ||||||
| Others | ||||||
| Military Aviation | By Sub Aircraft Type | Fixed-Wing Aircraft | By Body Type | Multi-Role Aircraft | ||
| Training Aircraft | ||||||
| Transport Aircraft | ||||||
| Others | ||||||
| Rotorcraft | By Body Type | Multi-Mission Helicopter | ||||
| Transport Helicopter | ||||||
| Others | ||||||
Need A Different Region or Segment?
Customize Now
Market Definition
- Aircraft Type - All the aircraft related to commercial, military and general aviation have been included in this study
- Sub-Aircraft Type - Fixed-Wing passenger aircraft, freighter aircraft, business jets, piston fixed-wing aircraft, military fixed-wing aircraft, and rotorcraft are included under this study.
- Body Type - Body type includes all types of aircraft segmented based on application/size/capacity/role.
| Keyword | Definition |
|---|---|
| IATA | IATA stands for the International Air Transport Association, a trade organization composed of airlines around the world that has an influence over the commercial aspects of flight. |
| ICAO | ICAO stands for International Civil Aviation Organization, a specialized agency of the United Nations that supports aviation and navigation around the globe. |
| Air Operator Certificate (AOC) | A certificate granted by a National Aviation Authority permitting the conduct of commercial flying activities. |
| Certificate Of Airworthiness (CoA) | A Certificate Of Airworthiness (CoA) is issued for an aircraft by the civil aviation authority in the state in which the aircraft is registered. |
| Gross Domestic Product (GDP) | Gross domestic product (GDP) is a monetary measure of the market value of all the final goods and services produced in a specific time period by countries. |
| RPK (Revenue Passenger Kilometres) | The RPK of an airline is the sum of the products obtained by multiplying the number of revenue passengers carried on each flight stage by the stage distance - it is the total number of kilometers traveled by all revenue passengers. |
| Load Factor | The load factor is a metric used in the airline industry that measures the percentage of available seating capacity that has been filled with passengers. |
| Original Equipment Manufacturer (OEM) | An original equipment manufacturer (OEM) traditionally is defined as a company whose goods are used as components in the products of another company, which then sells the finished item to users. |
| International Transportation Safety Association (ITSA) | International Transportation Safety Association (ITSA) is an international network of heads of independent safety investigation authorities (SIA). |
| Available Seats Kilometre (ASK) | This metric is calculated by multiplying Available Seats (AS) in one flight, defined above, multiplied by the distance flown. |
| Gross Weight | The fully-loaded weight of an aircraft, also known as “takeoff weight,” which includes the combined weight of passengers, cargo, and fuel. |
| Airworthiness | The ability of an aircraft, or other airborne equipment or system, to operate in flight and on the ground without significant hazard to aircrew, ground crew, passengers or to other third parties. |
| Airworthiness Standards | Detailed and comprehensive design and safety criteria applicable to the category of aeronautical product (aircraft, engine or propeller). |
| Fixed Base Operator (FBO) | A business or organization that operates at an airport. An FBO provides aircraft operating services like maintenance, fueling, flight training, charter services, hangaring, and parking. |
| High Net worth Individuals (HNWIs) | High Net worth Individuals (HNWIs) are individuals with over USD 1 million in liquid financial assets. |
| Ultra High Net worth Individuals (UHNWIs) | Ultra High Net worth Individuals (UHNWIs) are individuals with over USD 30 million in liquid financial assets. |
| Federal Aviation Administration (FAA) | The division of the Department of Transportation is concerned with aviation. It operates Air Traffic Control and regulates everything from aircraft manufacturing to pilot training to airport operations in the United States. |
| EASA (European Aviation Safety Agency) | The European Aviation Safety Agency is a European Union agency established in 2002 with the task of overseeing civil aviation safety and regulation. |
| Airborne Warning and Control System (AW&C) aircraft | Airborne Warning and Control System (AEW&C) aircraft is equipped with a powerful radar and on-board command and control center to direct the armed forces. |
| The North Atlantic Treaty Organization (NATO) | The North Atlantic Treaty Organization (NATO), also called the North Atlantic Alliance, is an intergovernmental military alliance between 30 member states – 28 European and two North American. |
| Joint Strike Fighter (JSF) | Joint Strike Fighter (JSF) is a development and acquisition program intended to replace a wide range of existing fighter, strike, and ground attack aircraft for the United States, the United Kingdom, Italy, Canada, Australia, the Netherlands, Denmark, Norway, and formerly Turkey. |
| Light Combat Aircraft (LCA) | A light combat aircraft (LCA) is a light, multirole jet/turboprop military aircraft, commonly derived from advanced trainer designs, designed for engaging in light combat. |
| Stockholm International Peace Research Institute (SIPRI) | Stockholm International Peace Research Institute (SIPRI) is an international institute that provides data, analysis, and recommendations for armed conflict, military expenditure, and arms trade as well as disarmament and arms control. |
| Maritime Patrol Aircraft (MPA) | A maritime patrol aircraft (MPA), also known as maritime reconnaissance aircraft is a fixed-wing aircraft designed to operate for long durations over water in maritime patrol roles, in particular, anti-submarine warfare (ASW), anti-ship warfare (AShW), and search and rescue (SAR). |
| Mach Number | The Mach number is defined as the ratio of true airspeed to the speed of sound at the altitude of a given aircraft. |
| Stealth Aircraft | Stealth is a Common term applied to low observable (LO) technology and doctrine, that makes an aircraft near invisible to radar, infrared or visual detection. |
Need More Details on Market Definition?
Ask a Question
Research Methodology
Mordor Intelligence follows a four-step methodology in all our reports.
- Step-1: Identify Key Variables: In order to build a robust forecasting methodology, the variables and factors identified in Step-1 are tested against available historical market numbers. Through an iterative process, the variables required for market forecast are set and the model is built on the basis of these variables.
- Step-2: Build a Market Model: Market-size estimations for the historical and forecast years have been provided in revenue and volume terms. For sales conversion to volume, the average selling price (ASP) is kept constant throughout the forecast period for each country, and inflation is not a part of the pricing.
- Step-3: Validate and Finalize: In this important step, all market numbers, variables and analyst calls are validated through an extensive network of primary research experts from the market studied. The respondents are selected across levels and functions to generate a holistic picture of the market studied.
- Step-4: Research Outputs: Syndicated Reports, Custom Consulting Assignments, Databases & Subscription Platforms

Get More Details On Research Methodology
Download PDF


