
Market Overview
| Study Period | 2021 - 2031 |
|---|---|
| Forecast Data Period | 2026 - 2031 |
| Base Year Market Size (2025) | USD 5.73 Billion |
| Market Size (2026) | USD 6.13 Billion |
| Market Size (2031) | USD 8.62 Billion |
| Growth Rate (2026 - 2031) | 7.05 % |
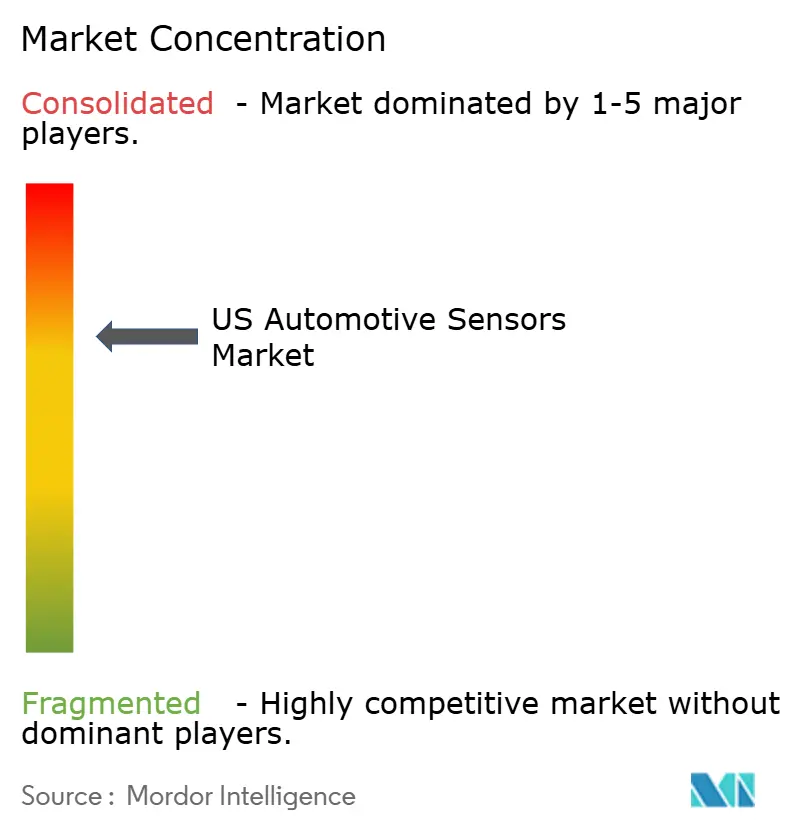
| Market Concentration | Medium |
Major Players *Disclaimer: Major Players sorted in no particular order Image © Mordor Intelligence. Reuse requires attribution under CC BY 4.0. | |
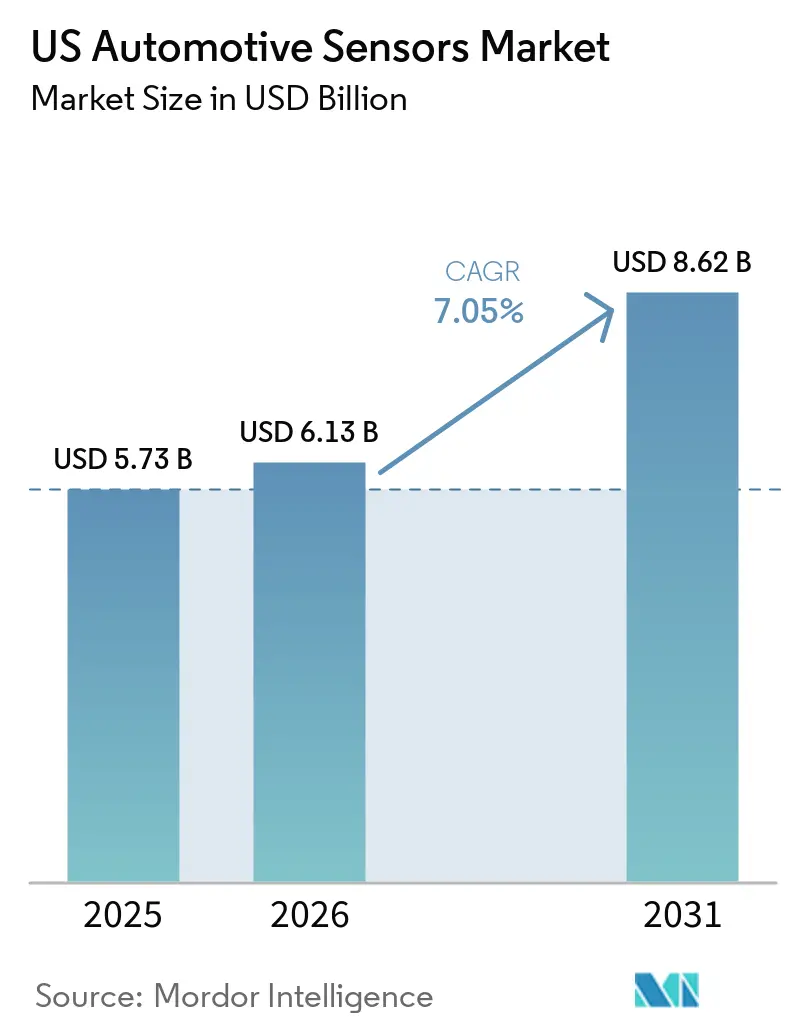
US Automotive Sensors Market Analysis by Mordor Intelligence
The US Automotive Sensors Market size is expected to grow from USD 5.73 billion in 2025 to USD 6.13 billion in 2026 and is forecast to reach USD 8.62 billion by 2031 at 7.05% CAGR over 2026-2031. Automakers are embedding more sensors per vehicle to comply with tire-pressure, stability-control, and automated-braking mandates. At the same time, fleet operators adopt sensor-rich telematics to control insurance costs and emissions. Radar, lidar, and MEMS-based devices continue to achieve cost and performance breakthroughs, giving legacy suppliers and start-ups new avenues for differentiation in the United States automotive sensors market.
Key Report Takeaways
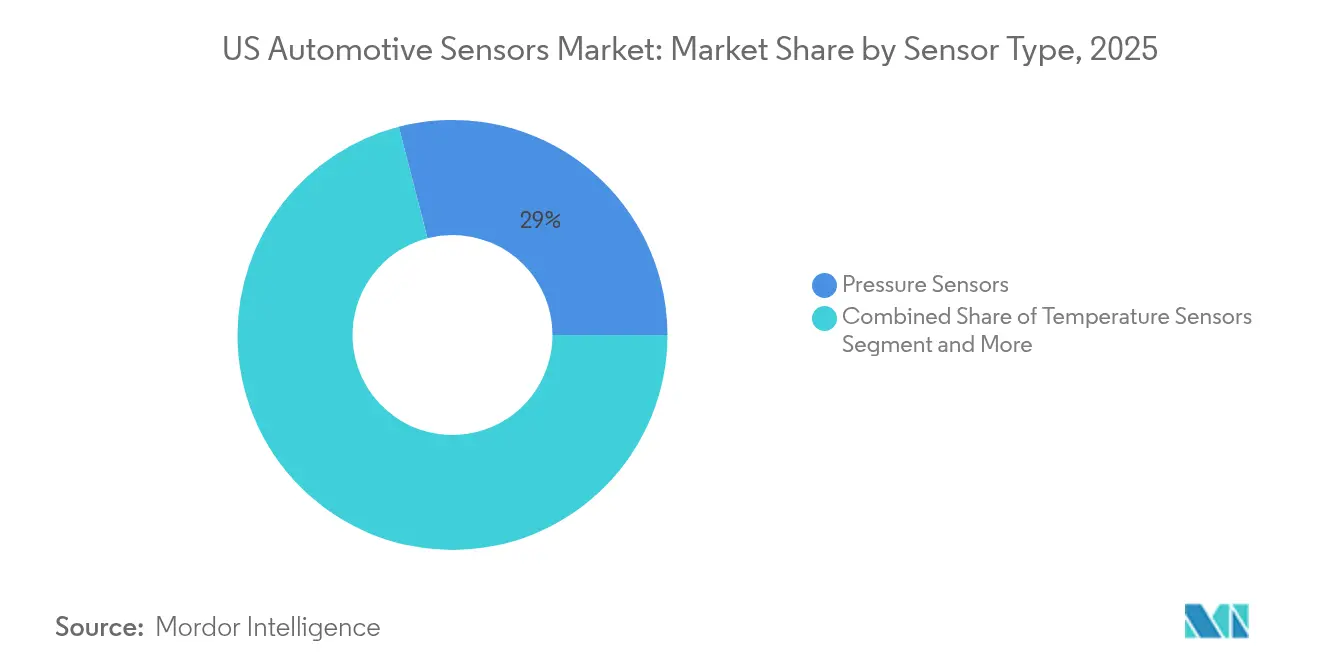
- By sensor type, pressure sensors led with 29.02% of the United States automotive sensors market share in 2025; radar sensors are forecast to expand at a 8.02% CAGR through 2031.
- By application, powertrain systems accounted for 35.98% of revenue in 2025, while ADAS is set to grow at an 8.36% CAGR to 2031.
- By vehicle type, passenger cars held 64.55% of the United States automotive sensors market size in 2025, and heavy commercial vehicles will post the quickest growth at an 8.62% CAGR.
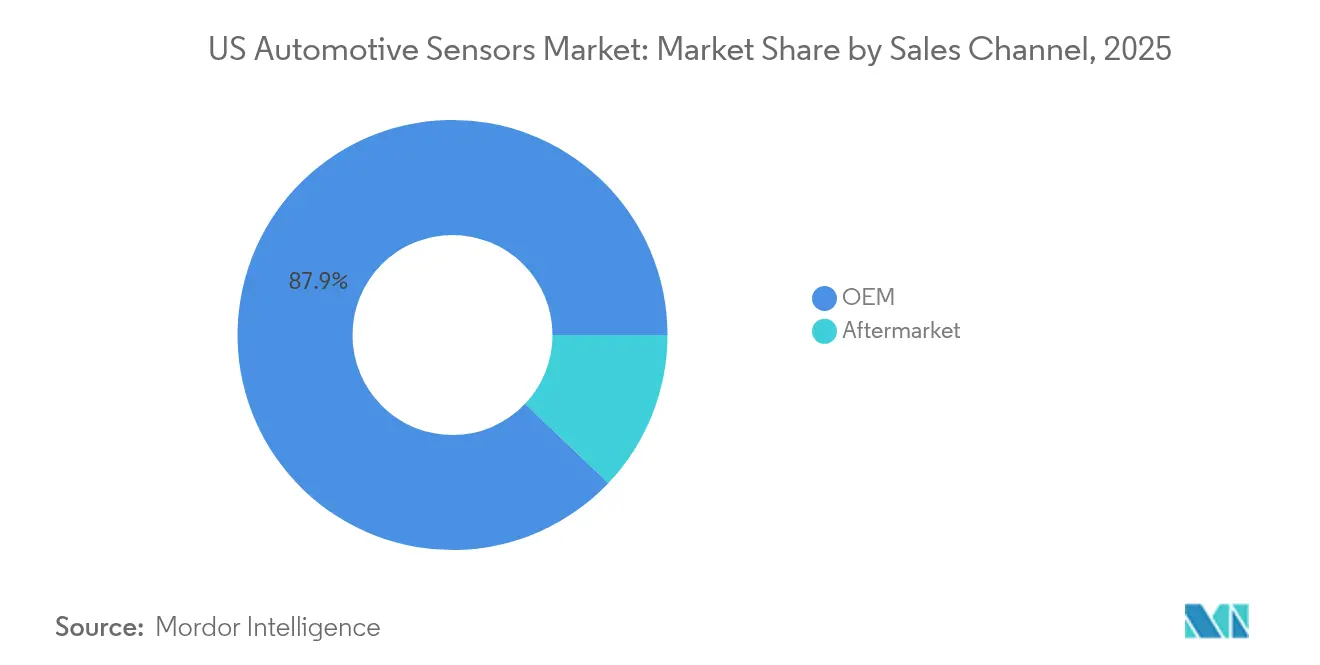
- By sales channel, OEM installations captured 87.92% share in 2025; the aftermarket segment is rising at a 8.99% CAGR as retrofits gain popularity.
- By propulsion, ICE powertrains kept 67.58% share during 2025; the Battery EV segment is rising at a 7.34% CAGR through 2031.
- By sensor technology, MEMS devices dominated with 73.44% share and are also the fastest-growing category at a 7.21% CAGR.
Note: Market size and forecast figures in this report are generated using Mordor Intelligence’s proprietary estimation framework, updated with the latest available data and insights as of 2026.
US Automotive Sensors Market Trends and Insights
Drivers Impact Analysis*
| Driver | (~) % Impact on CAGR Forecast | Geographic Relevance | Impact Timeline |
|---|---|---|---|
| EV Adoption Pushes Sensor Content per Vehicle | +2.4% | California, Washington, Northeast states | Long term (≥ 4 years) |
| Federal TPMS, ESC & NCAP Upgrades | +1.8% | Nationwide, with regulatory enforcement from Washington DC | Medium term (2-4 years) |
| Software-Defined Vehicle Architectures | +1.5% | Technology hubs: California, Michigan, Texas | Medium term (2-4 years) |
| CHIPS Act Incentivizes On-Shore MEMS Fabs | +1.2% | US nationwide, with concentration in Arizona, Texas, New York | Medium term (2-4 years) |
| Connected-Insurance Telematics Retrofits | +0.8% | Urban centers, initially in Northeast and West Coast | Short term (≤ 2 years) |
| Fleet Decarbonisation Targets | +0.6% | Corporate fleets nationwide, led by coastal states | Long term (≥ 4 years) |
| Source: Mordor Intelligence | |||
CHIPS Act Incentivises On-Shore MEMS Fabs
New federal grants worth USD 39 billion are steering wafer-fab projects to Arizona, Texas and upstate New York, ensuring a local pipeline of MEMS pressure, inertial and magnetic sensors that underpin engine, battery and chassis controls. Rogue Valley Microdevices has already secured USD 6.7 million for a Florida plant that will nearly triple its automotive MEMS capacity, illustrating how smaller foundries can scale under the program. The added capacity reduces lead-times, cuts shipping risk and supports just-in-time delivery for Detroit and coastal assembly plants. Universities gain research grants that seed next-gen micromachining processes, further anchoring innovation inside the United States automotive sensors market. Combined, these actions lift resilience and pull future production back from overseas fabs.[1]
EV Adoption Pushes Sensor Content per Vehicle
Electric models integrate two to three times more semiconductors than ICE cars, pushing sensor value toward a greater share by 2030. Battery-management systems alone require multiple temperature, current and voltage nodes to prevent thermal runaway. Position and magnetic sensors monitor e-motor speed, while high-voltage isolation devices maintain safety. Government tax credits and coast-to-coast charging grants accelerate delivery volumes, so suppliers are scaling SiC-based pressure and temperature dies to meet harsher under-hood environments. As a result, the United States automotive sensors market is benefiting from higher average selling prices even when overall vehicle production remains flat. The result is a chronic allocation risk that lengthens design cycles, prompts costly re-spins around alternative silicon, and caps the overall motor vehicle sensor market growth trajectory despite robust end-customer demand.
Connected-Insurance Telematics Retrofits
Usage-based insurance programs rely on accelerometers, gyroscopes and GNSS modules to track driving style and mileage. With connected cars projected to constitute more than four fifth of new US sales in 2025, retrofitting older models with plug-in telematics dongles is becoming common. Independent repair shops see new revenue in device installation and calibration, while insurers gain refined risk scoring that can slash claims costs increases. This aftermarket pull lifts unit volumes for MEMS inertial sensors and 4G/5G gateways across the United States automotive sensors market.
Software-Defined Vehicle Architectures
Central zonal controllers now aggregate data from hundreds of nodes and push updates over the air. Tesla proved that simplified wiring can cut cable length and weight, and mainstream OEMs are following suit. High-speed radar and lidar chips from Texas Instruments improve perception, and their software stacks are upgradable to future autonomy levels without hardware change.[2] For suppliers, this means designing sensors with encrypted communication and deterministic latency to slot cleanly into the evolving backbone. The shift keeps the United States automotive sensors market aligned with cloud-native development cycles rather than traditional model-year updates.
Restraints Impact Analysis*
| Restraint | (~) % Impact on CAGR Forecast | Geographic Relevance | Impact Timeline |
|---|---|---|---|
| Cost & Price-Erosion Squeeze Tier-1 Margins | -1.2% | Michigan, Ohio, Indiana auto manufacturing belt | Medium term (2-4 years) |
| Silicon-Supply Water-Stress | -0.9% | Arizona, New Mexico, Texas | Long term (≥ 4 years) |
| Sensor-Level Cyber-Security | -0.8% | Nationwide, with regulatory focus in Washington DC | Medium term (2-4 years) |
| Harsh-Duty Reliability & Calibration | -0.6% | Extreme climate regions: Alaska, Desert Southwest, Upper Midwest | Short term (≤ 2 years) |
| Source: Mordor Intelligence | |||
Silicon-Supply Water-Stress Constraints
Next-generation fabs in Arizona may each draw significant liters of water daily, straining aquifers already under drought pressure. Community opposition or permitting delays could cap local wafer output, tightening the flow of automotive pressure and inertial dies. To mitigate risk, manufacturers are installing closed-loop recycling that recovers more than 70% of process water, yet capital outlays lengthen payback. Prolonged shortages could temper growth for the United States automotive sensors market if additional sites are not approved.
Cost & Price-Erosion Squeeze Tier-1 Margins
OEMs are in-sourcing software and hardware road-maps, forcing traditional Tier-1s to slash prices and absorb design costs. Analysts expect average supplier margins to slip slightly within five years. Lower profitability limits R&D outlays for new sensing platforms, slowing mass-market deployment. Some US-based suppliers are pivoting to integration and over-the-air calibration services, yet widespread restructuring may still stifle innovation rates inside the United States automotive sensors market.
*Our forecasts treat driver/restraint impacts as directional, not additive. The impact forecasts reflect baseline growth, mix effects, and variable interactions.
Segment Analysis
By Sensor Type: Pressure Sensors Hold the Lead, Radar Closes the Gap
Pressure devices delivered 29.02% of 2025 revenue, anchoring applications such as fuel injection, brake boost and mandated tire-pressure monitoring. The United States automotive sensors market size for pressure units is set to expand steadily in line with fuel-efficiency and emissions targets. Radar modules, although smaller today, will grow at a 8.02% CAGR through 2031 thanks to falling 77 GHz chipset prices and NCAP pressure to add blind-spot, front-collision and cross-traffic alerts. Tier-1s now bundle four-corner 4D radar into mainstream SUVs, signalling that sensor fusion is shifting from premium to volume segments.
Second-generation millimetre-wave architectures integrate digital beam-forming and AI-enhanced object classification on a single CMOS die. This reduces bill-of-materials and simplifies thermal design, helping radar to erode camera-only ADAS share. Suppliers that combine radar with inertial reference units promise high-accuracy odometry even when GPS is blocked, creating new value pools within the United States automotive sensors industry.

By Application: Powertrain Leads, ADAS Posts Break-Out Growth
Powertrain systems accounted for 35.98% of 2025 spend, covering air-flow, knock, coolant-temperature and battery pack sensors. Compliance with Tier 3 emissions rules keeps powertrain allocations high. At the same time, ADAS and autonomous functions will expand at an 8.36% CAGR to 2031, raising their portion of the United States automotive sensors market size considerably. Ultrasonic, camera, radar and lidar combinations enable Level-2+ functions, while NHTSA’s new automatic emergency-braking mandate locks in baseline volumes.
To meet redundancy targets, OEMs specify dual independent sensing paths for lateral and longitudinal control. This pushes total semiconductor count per vehicle past thousand mark by 2029, cementing ADAS as the fastest-growing budget line for sensors. Continuous over-the-air feature upgrades further stretch lifecycle revenue because dormant compute headroom can be monetised years after vehicle sale.
By Vehicle Type: Passenger Cars Dominate, Heavy Trucks Accelerate
Passenger cars absorbed 64.55% of shipments in 2025 given their much higher build numbers. Content per unit is rising in mid-sized crossover utility vehicles as well, broadening demand. Heavy commercial vehicles will post an 8.62% CAGR as federal regulators roll out automatic emergency braking and electronic stability rules for Class 8 trucks. Rising e-commerce volumes amplify the need for collision-warning and fatigue-monitoring sensors. Such mandates elevate the United States automotive sensors market share for heavy-duty applications despite slower build rates.
Light commercial vans benefit from last-mile delivery growth and electrification grants, which enable richer telematics packages. Integration complexities include sealing lidar housings against power-washer spray and managing electromagnetic interference from high-current traction inverters. These nuances spur specialised suppliers to co-design sensors with body builders, creating fresh revenue pockets inside the United States automotive sensors industry.
By Sales Channel: OEM Remains Dominant, Aftermarket Picks Up Pace
Factory-fit installations owned 87.92% of 2025 turnover, reflecting the complexity of integrating sensors into safety-critical networks. Automakers lock in multi-year supply agreements, offering volume visibility. Yet the aftermarket will rise at a 8.99% CAGR as insurers, fleet managers and tech firms retrofit data loggers and ADAS calibration kits into ageing vehicles. Growth favours plug-and-play MEMS hubs that pair cellular modems with GPS, accelerometers and CAN gateways.
Escalating calibration requirements pose hurdles for independent workshops because alignment rigs and software subscriptions raise entry costs. Consolidation among service chains may follow, gradually shifting bargaining power within the United States automotive sensors market toward equipment vendors that bundle hardware with training.
By Propulsion: ICE Still Largest, Battery EVs Surge
ICE powertrains kept 67.58% share during 2025, sustained by continued consumer preference for gasoline pickups and SUVs. Their sensor spend revolves around exhaust gas recirculation, particulate filtering and turbo boost control. Battery EV sensors will climb at a 7.34% CAGR, fuelled by federal tax credits and coast-to-coast charging network expansion. High-precision shunt, hall-effect and fibre-optic sensors supervise 800-V architectures, and silicon-carbide pressure dies monitor coolant flow in fast-charging loops.
Hybrid systems add duplicated sensing layers because both the internal combustion engine and electric motor require independent temperature and vibration monitoring. As cumulative hybrid volumes rise, suppliers can leverage shared pressure and position sensor platforms, smoothing ramp-up costs across the United States automotive sensors market.
By Sensor Technology: MEMS Commands Volume and Momentum
MEMS platforms supplied 73.44% of 2025 units and will grow at a 7.21% CAGR. Micro-machined capacitive and piezoresistive structures give unmatched size, cost and vibration resilience. Foundries are now releasing wafer-level packages that integrate ASIC signal-conditioning, slashing board space in power-dense inverters. Early adoption of MEMS micromirror lidar offers 120° field-of-view with sub-three-centimetre depth accuracy, crucial for urban automated-valet modes.
Non-MEMS sensors, such as bulk-wave ultrasonic transducers and macro-machined pressure capsules, retain niches where extreme pressures or fluid compatibility rule out silicon structures. Still, ongoing cost decreases within MEMS will gradually replace these legacy designs, cementing the dominant position of MEMS in the United States automotive sensors market.
Geography Analysis
Midwestern states such as Michigan and Ohio continue to assemble the majority of vehicles and therefore integrate the largest absolute number of engine, chassis and cabin sensors. Skilled labour pools and established Tier-1 clusters make these regions indispensable for validation and volume production. However, capital for greenfield fabs is drifting southwest toward Arizona and Texas, allowing a new semiconductor corridor to emerge under the CHIPS and Science Act. As those fabs reach volume, sensor wafers can ship directly to Midwest module lines, shrinking logistics risk and inventory buffers across the United States automotive sensors market.
California leads national electric-vehicle penetration, which in turn accelerates adoption of high-voltage current, temperature and isolation sensors. Silicon Valley software firms work hand-in-glove with semiconductor specialists to refine sensor fusion algorithms that underpin Level-2+ autopilot features. Regulatory open-roads permits further entice lidar and radar start-ups to pilot fleets in San Francisco and Los Angeles, reinforcing the coast’s innovation flywheel.
The Northeast and Mid-Atlantic present dense traffic and harsh winters. Demand therefore skews toward radar and all-weather camera modules capable of handling salt spray and sub-zero conditions. Insurance headquarters in Connecticut, New York and Pennsylvania promote telematics rollouts, spurring aftermarket dongle uptake. Meanwhile, Southeastern states like Tennessee and South Carolina host several new battery-plant and EV-assembly projects, expanding regional consumption of pack-level temperature and pressure sensors. Collectively, these geographic dynamics build a balanced regional footprint for suppliers serving the United States automotive sensors market.
Regulatory Landscape
Automotive sensor demand in the United States is shaped by Federal Motor Vehicle Safety Standards (FMVSS) administered by the National Highway Traffic Safety Administration (NHTSA) under 49 CFR Part 571, which set performance requirements for safety systems that rely on radar, camera, inertial and other sensing. A key recent anchor is the NHTSA final rule for FMVSS No. 127 on automatic emergency braking (AEB) for light vehicles (published in 2024). It specifies functional requirements such as detecting sensor obstructions and providing driver telltales for malfunctions, which raises the compliance burden for sensing hardware and diagnostics.
Trade policy also influences sourcing and pricing of sensor components and subassemblies. The Section 232 automobile and automobile parts framework has a defined inclusion and administration process through the US Department of Commerce, Bureau of Industry and Security (BIS), including recurring submission windows established in 2025 and an April 2026 inclusions window (April 1 to April 14, 2026) for additional parts to be considered within the scope of Section 232 duties. For suppliers, this reinforces documentation, traceability and compliance workflows for imported parts, including FMVSS conformity and required markings (for example, DOT certification practices for regulated components).
Value Chain Analysis
The US automotive sensors value chain begins with semiconductor materials and device fabrication (MEMS, mixed-signal ICs, radar MMICs, and power devices such as SiC) and then moves into sensor die, packaging and module assembly. Tier-1 integrators (for example, Bosch, Continental and Denso) and semiconductor majors (for example, Texas Instruments and Infineon) convert these inputs into qualified automotive-grade sensors and perception modules. Those modules then feed OEM programs that dominate installations (87.92% share in 2025) and a growing retrofit ecosystem supporting telematics and calibration-heavy ADAS upgrades in the aftermarket.
Recent moves point to scaling and regionalization across the chain. Bosch began chip production at a US silicon carbide plant in Roseville, California (reported in July 2026), supporting local availability for automotive-grade semiconductors used in sensor and powertrain electronics. In perception sensors, Ouster expanded its long-term manufacturing partnership with Benchmark Electronics (June 2026) to scale high-volume production of its Rev8 digital lidar sensor family in the United States. Suppliers are also diversifying assembly footprints for cost and risk, illustrated by Standard Motor Products forming a 50/50 joint venture with Techstrong Holdings to manufacture automotive sensors in Thailand (July 2026), targeting ABS speed and position sensors to broaden sourcing options.
Competitive Landscape
Five semiconductor majors—Infineon, NXP, STMicroelectronics, Texas Instruments and Renesas—collectively captured just over half of 2024 revenue, confirming a tight oligopoly. Continental, Bosch and Denso still lead module-level integration, yet their influence fades as OEMs negotiate directly with chip houses for next-gen radar and battery controllers. Texas Instruments recently introduced a 2.5-nanosecond response lidar driver that cuts system latency and a new 77 GHz radar transceiver that extends detection range past 500 metres.
Domestic capacity build-outs alter power balances further. Foundry start-ups supported by CHIPS grants can offer niche processes such as silicon-on-insulator MEMS to Tier-1s seeking dual sourcing. Strategic alliances pair fab-less radar designers with wafer fabs that specialise in high-resistivity substrates, ensuring volume scalability. Suppliers that master vertically integrated sensor-plus-software stacks stand to capture premium margins as vehicles morph into data platforms.
Tier-1s face margin compression yet retain integration expertise. Forward-looking firms reposition as system orchestrators that unify chips from multiple vendors, manage cyber-security keys and certify ISO 26262 safety. The value of such orchestration rises with every added ECU domain, allowing agile Tier-1s to defend relevance even while direct silicon revenue migrates upward in the United States automotive sensors market.
US Automotive Sensors Industry Leaders
-
Texas Instruments Incorporated
-
Robert Bosch GmbH
-
Continental AG
-
Denso Corporation
-
Infineon Technologies
- *Disclaimer: Major Players sorted in no particular order
Market Opportunities and Future Outlook
One opportunity area is compliance-driven ADAS sensing content linked to FMVSS No. 127 (AEB for light vehicles), which embeds requirements such as obstruction detection and malfunction telltales. Those requirements increase demand for radar and camera sensing, diagnostics and validation, and they support investment in US-based production and test capacity for safety sensors and associated electronics. This is especially relevant where OEMs prefer local supply, tighter lead times and stronger traceability.
A second whitespace is domestic capacity expansion for the semiconductor building blocks used across automotive sensors, particularly where supply assurance and automotive-grade qualification constrain scaling. In July 2026, Bosch announced a definitive agreement for up to USD 225 million in direct funding from the US Department of Commerce CHIPS Program Office to support its USD 2 billion Roseville, California investment for silicon carbide semiconductors, with sample production already underway. On the module side, AUMOVIO announced a USD 110 million investment (October 2025) to expand its New Braunfels, Texas facility for ADAS radar sensors, with construction scheduled to begin in summer 2026, aligning new capacity build with the rising baseline of radar-enabled safety functions.
Recent Industry Developments
- June 2026: Infineon Technologies entered mass production of its RASIC CTRX8188F imaging radar MMIC, positioned as an 8Tx8Rx solution for higher-resolution radar sensing. The action strengthens the supplier roadmap for imaging radar architectures used in ADAS and supports OEM and Tier-1 efforts to consolidate sensing functions while improving perception performance.
- April 2025: Bosch and Horizon Robotics signed a memorandum of understanding to intensify collaboration on assisted driving solutions, including Bosch multi-purpose cameras and ADAS product families using Horizon Journey 6 hardware. The agreement ties sensor hardware to AI compute platforms, reinforcing the shift toward software-defined perception stacks that can be deployed across multiple automakers.
- September 2024: Pirelli and Bosch signed a development cooperation to create intelligent tire technology using integrated sensors and BLE MEMS technology. The collaboration expands the sensor footprint into tire and chassis-related use cases and supports new data streams for safety, maintenance and vehicle dynamics applications.
Research Methodology Framework and Report Scope
Market Definition and Coverage
For this study, the market covers the value of sensors installed in motor vehicles sold and operated in the United States, counting sensor hardware used across core vehicle systems such as powertrain, chassis, safety, body electronics, and telematics.
Scope exclusions: We exclude non-automotive sensor demand and most stand-alone software and analytics value that sits outside the sensor hardware sale.
Segmentation Overview
- By Sensor Type
- Temperature Sensors
- Pressure Sensors
- Speed / Velocity Sensors
- Level / Position Sensors
- Magnetic Sensors
- Gas / Chemical Sensors
- Inertial Sensors (Accel/Gyro)
- LiDAR Sensors
- Radar Sensors
- Ultrasonic Sensors
- Image / Camera Sensors
- Current Sensors
- By Application
- Powertrain
- Body Electronics & Comfort
- Vehicle Security & Safety
- ADAS & Autonomous Systems
- Telematics & Connectivity
- Battery-Management (EV)
- By Vehicle Type
- Motorcycles
- Passenger Cars
- Light Commercial Vehicles
- Heavy Commercial Vehicles
- By Sales Channel
- OEM
- Aftermarket
- By Propulsion
- Internal-Combustion Vehicles
- Hybrid Electric Vehicles
- Battery Electric Vehicles
- Fuel-Cell Electric Vehicles
- By Sensor Technology
- MEMS
- Non-MEMS / Macro Sensors
Data Sources, Market Sizing, and Validation
Desk Research
Desk research was used to set the fact base for US vehicle production and sales, regulation-led sensor adoption, and the direction of sensor technology shifts. We relied on public sources such as NHTSA and EPA releases, US Census and BEA data series, Bureau of Labor Statistics inflation indicators, and SAE technical papers that describe how sensors are deployed in modern vehicles.
To translate those signals into a working model, we also reviewed company filings and investor presentations, industry association updates, and press coverage tracking ADAS fitment and powertrain changes. A limited set of paid subscriptions for company financials, patents, and shipment-level trade checks was used only to validate supplier exposure and pricing movement, not to replace the demand logic. The sources listed here are illustrative, and we used additional public references to collect data, confirm assumptions, and close gaps.
Primary Interviews and Surveys
Primary work centered on interviews and structured surveys with people across the US automotive sensor value chain, including component suppliers, vehicle system integrators, and downstream OEM-facing functions. The main focus was to confirm sensor content per vehicle, pricing direction by sensor family, and the timing of feature adoption (for example, safety systems, emissions monitoring, and braking and stability functions), and then to sanity-check the desk assumptions before finalizing totals.
Distribution of primary research fieldwork respondents
| Company type | Respondent position |
|---|---|
| Top tier: 39% | CXOs: 14% |
| Mid tier: 47% | Functional/Unit leaders: 40% |
| Smaller Players: 14% | Managers: 46% |
Market-Sizing & Forecasting
Sizing starts from a top-down demand pool built from US vehicle production and sales by major vehicle categories, which is then converted into sensor dollars using estimated sensors-per-vehicle and average pricing by sensor group. The model is structured so safety mandates and feature penetration changes feed into the installed sensor count, followed by expected pricing movement as technologies mature.
To keep the totals grounded, we then corroborate with selective bottom-up approximations, such as sampled supplier revenue exposure to US automotive end demand and channel checks on typical sensor pricing ranges. Inputs that drive the result most include US light vehicle build volumes, ADAS and braking system penetration, emissions and diagnostics requirements, the EV share (which shifts the sensor mix), and inflation-adjusted price trends for electronics components. When company disclosure is incomplete, gaps are handled using peer averages and conservative mix assumptions, and these assumptions are reviewed with experts during calls.
For forecasting, scenario analysis is used because regulatory timing and feature adoption can move faster or slower than a straight-line projection. The final scenario path is selected only after primary respondents confirm what they see in model-year rollouts, sourcing plans, and expected pricing resets.
Data Validation & Update Cycle
Outputs are checked against independent signals such as vehicle production trends, import and export direction for key components, and known shifts in safety and emissions requirements. If a segment trend appears inconsistent with these signals, we reopen the drivers, followed by a second pass of assumptions and a targeted re-contact with interviewees to confirm the change.
Before sign-off, the model and calculations undergo a multi-step internal review so the final numbers are consistent across years and across key sub-markets. Reports are refreshed annually, and interim updates are made when a material event changes volumes, fitment rates, or pricing. Right before delivery, we run a final review pass so the client receives the latest updated view.
Mordor Intelligence's US Automotive Sensors Market Market Size Versus Other Published Estimates
Published market sizes for US automotive sensors often do not match because the counting rules are not the same, even when the titles sound similar. Differences usually come from what is included as a sensor, which sales channels are counted, the base year chosen, and how pricing is adjusted over time.
Some sources stretch the scope by folding in broader motor-vehicle electronics and adjacent modules, and they may also use aggressive price paths for newer ADAS-related sensors. In Mordor Intelligence, only sensor hardware tied to automotive use in the United States is counted, and the totals are anchored to vehicle build and feature penetration checks, followed by supplier-side validation so the value does not drift away from real fitment and pricing behavior.
Benchmark comparison
| Source | Market Size | Gaps in Research Methodology |
|---|---|---|
| Mordor Intelligence | USD 5.73 B (2025) | |
| Industry Publisher A | USD 5.50 B (2024) | Uses a different base year and can mix OEM and aftermarket assumptions at a higher level, which shifts the implied sensors-per-vehicle and the price mix when rolled forward to later years. |
| Market Publisher B | USD 4.60 B (2026) | Starts from a later base year and may apply narrower product groupings and a tighter application scope, which can undercount ADAS-linked sensor content that is increasingly standardizing across new vehicle builds. |
Taken together, the spread is mainly explained by timing and scope choices, plus how pricing and feature penetration are treated in the forward years. By keeping the build-volume math visible and then pressure-testing it with supplier and application checks, the final number stays traceable to a clear demand pool that can be repeated and updated without changing the logic.
Key Questions Answered in the Report
What is the current value of the United States automotive sensors market?
The market is valued at USD 6.13 billion in 2026 and is on track to expand at a 7.05% CAGR toward 2031.
Which sensor category holds the largest share today?
Pressure sensors lead with 29.02% of 2025 revenue due to mandatory tire-pressure monitoring and powertrain applications.
How quickly are radar sensors growing in the United States automotive sensors market?
Radar modules are projected to achieve a 8.02% CAGR between 2026-2031, making them the fastest-growing sensor type.
Why is the CHIPS Act significant for sensor suppliers?
Federal grants and tax credits worth USD 39 billion are financing new US fabs that shorten supply chains and expand MEMS production capacity, improving resilience.
Which vehicle segment offers the strongest growth opportunity?
Battery electric vehicles show the highest sensor CAGR at 7.34% through 2031 because they use two to three times more semiconductors than ICE models.
How are new safety rules influencing demand?
NHTSA mandates on seat-belt reminders and proposed automatic emergency braking require additional radar, camera and occupancy sensors, locking in baseline growth for suppliers.