
Market Overview
| Study Period | 2020 - 2031 |
|---|---|
| Base Year Market Size (2025) | USD 20.55 Billion |
| Market Size (2026) | USD 21.6 Billion |
| Market Size (2031) | USD 27.68 Billion |
| Growth Rate (2026 - 2031) | 5.12 % |
| Fastest Growing Market | Europe |
| Largest Market | North America |
Major Players *Disclaimer: Major Players sorted in no particular order Image © Mordor Intelligence. Reuse requires attribution under CC BY 4.0. | |
United States And Europe LED Lighting Market Analysis by Mordor Intelligence
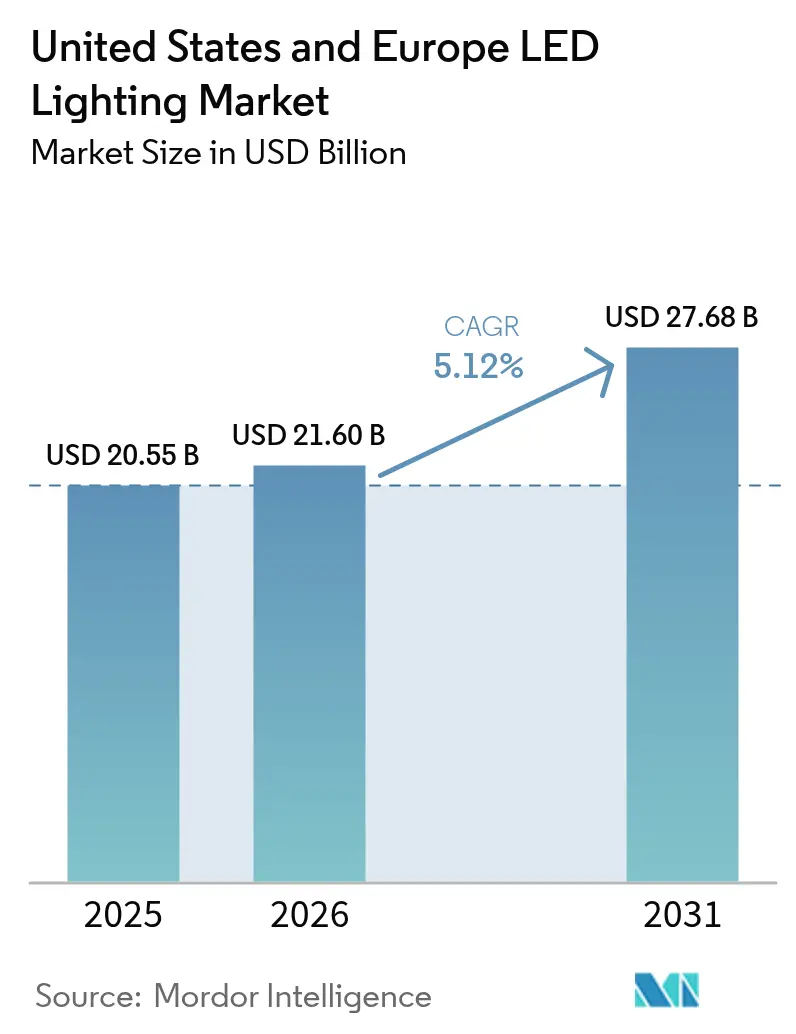
The United States and Europe LED lighting market size in 2026 is estimated at USD 21.6 billion, growing from 2025 value of USD 20.55 billion with 2031 projections showing USD 27.68 billion, growing at 5.12% CAGR over 2026-2031. Growth continues as policy-driven phase-outs of mercury-based lamps, escalating electricity prices and corporate net-zero mandates converge to make LEDs the default technology in both retrofit and new-build projects. Commercial buyers now view lighting upgrades as a strategic energy-optimization lever that yields rapid payback, particularly when coupled with smart building platforms. Supply-chain diversification is simultaneously becoming a competitive differentiator as geopolitical tensions re-shape sourcing strategies across the LED lighting market.
Key Report Takeaways
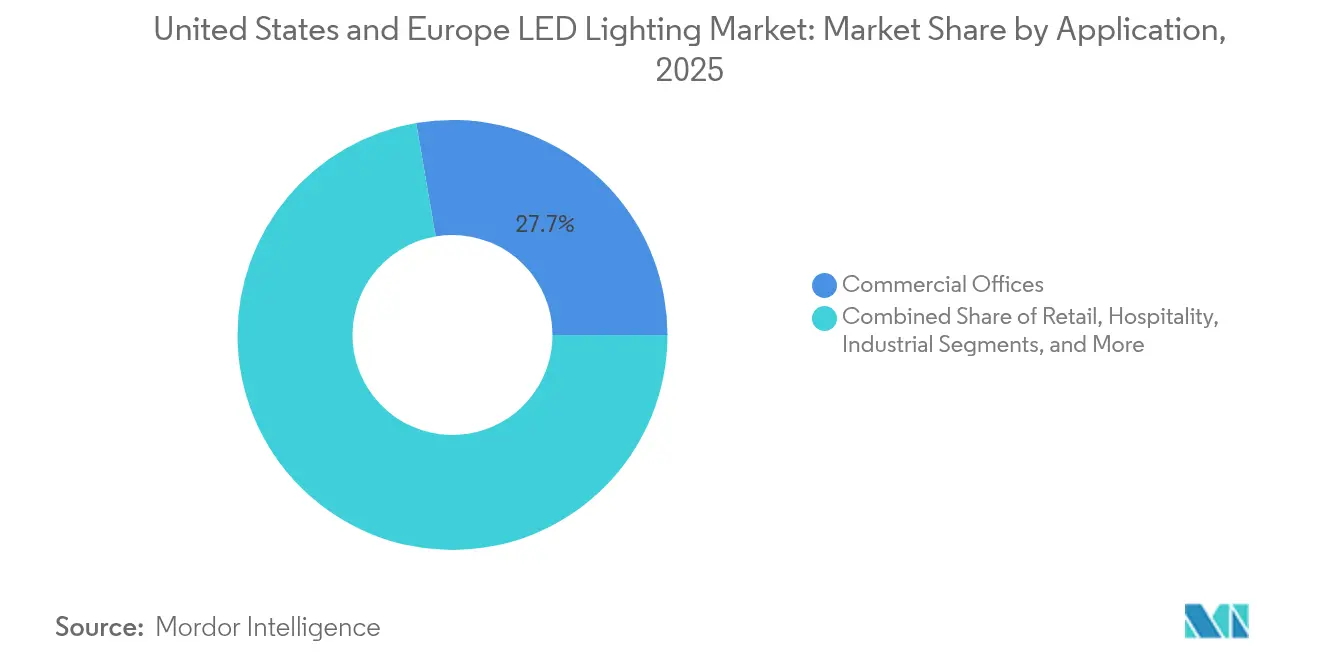
- By application, commercial offices held 27.70% of LED lighting market share in 2025, while hazardous zones are projected to expand at 8.92% CAGR through 2031.
- By product type, luminaires dominated with 67.10% revenue share in 2025; high-bay and low-bay models are poised for an 8.05% CAGR to 2031.
- By installation type, retrofit projects represented 61.30% of the LED lighting market size in 2025; new installations are expected to grow 7.78% annually to 2031.
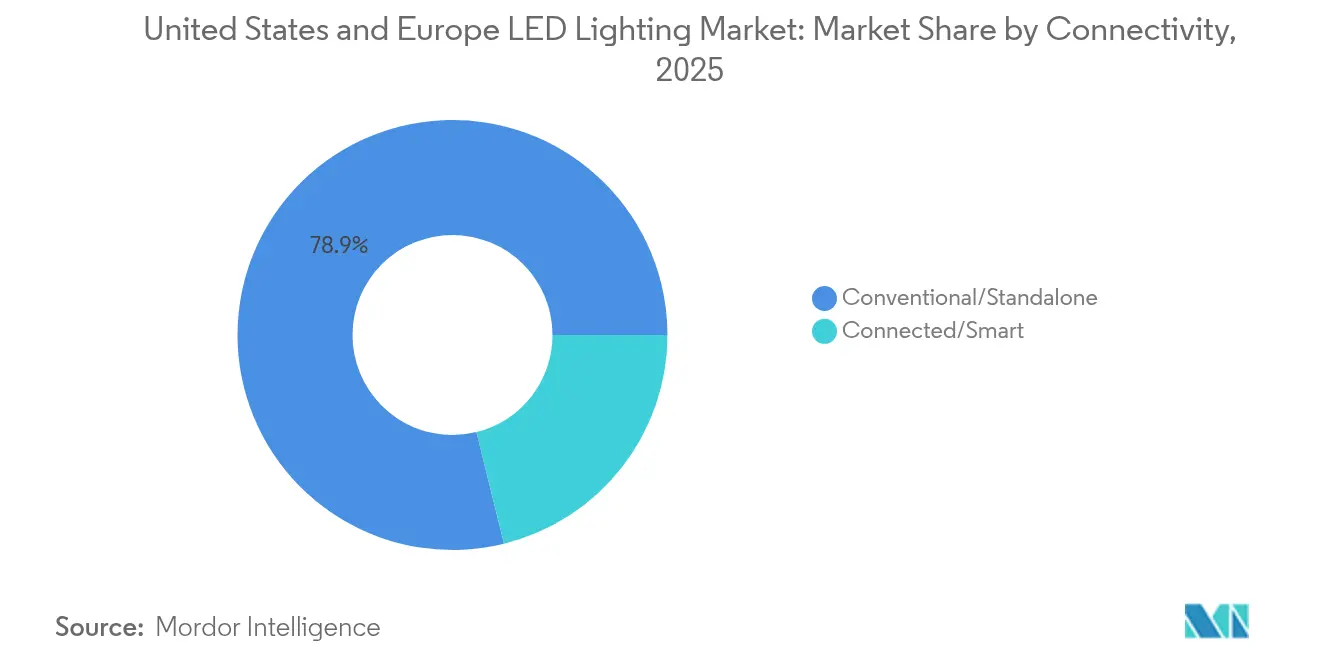
- By connectivity, conventional systems accounted for 78.85% share in 2025, whereas connected smart LEDs lead growth at a 9.22% CAGR.
- By end-user, industrial facilities contributed 39.10% share in 2025; residential demand is the most dynamic, advancing at 6.19% CAGR to 2031.
- By geography, the United States controlled 40.10% share in 2025, while France is forecast to record a 7.68% CAGR, the fastest among national markets.
Note: Market size and forecast figures in this report are generated using Mordor Intelligence’s proprietary estimation framework, updated with the latest available data and insights as of 2026.
Market Trends and Insights
Drivers Impact Analysis of United States And Europe LED Lighting Market*
| Driver | (~) % Impact on CAGR Forecast | Geographic Relevance | Impact Timeline |
|---|---|---|---|
| EU phase-out of fluorescent T5/T8 tubes | +1.2% | Europe and UK | Medium term (2-4 years) |
| United States DOE 120 lm/W rule | +0.8% | United States, Canada | Medium term (2-4 years) |
| Corporate net-zero commitments | +0.9% | North America, EU | Long term (≥ 4 years) |
| Electricity tariff surges | +0.6% | Germany, UK, California | Short term (≤ 2 years) |
| EU green public-procurement mandates | +0.4% | EU member states | Medium term (2-4 years) |
| PoE & Bluetooth-mesh smart retrofits | +0.7% | Urban districts, NA & EU | Long term (≥ 4 years) |
| Source: Mordor Intelligence | |||
EU phase-out of fluorescent T5/T8 tubes accelerating commercial retrofits
The August 2023 EU ban on mercury-based T5 and T8 tubes produced an immediate replacement surge, as facility managers discovered that LED retrofits lower lighting energy use by 80% and pay back in three months.[1] Demand strengthens into 2025 when the last exemptions expire, prompting manufacturers that pre-emptively ceased fluorescent production to channel capacity toward LED luminaires. Parallel UK restrictions extend the opportunity beyond EU borders, magnifying the LED lighting market’s retrofit revenues.
United States DOE 120 lm/W rule catalyzing residential adoption
Finalized efficacy standards that raise the residential baseline from 45 lm/W to 120 lm/W by July 2028 erase compact fluorescent competition and guarantee a protected runway for LEDs.[2] Annual consumer savings are projected at USD 1.6 billion, while utilities amplify rebates to accelerate compliance. Color-tunable and high-CRI products still face efficiency-performance trade-offs, creating design challenges that spur innovation in the LED lighting market.
Corporate net-zero commitments driving large-scale office relamping
More than 40 US cities will enforce building-performance standards by 2026, compelling landlords to retrofit lighting to meet carbon caps.[3] Federal agencies target a net-zero building portfolio by 2045, while multinational tenants view connected LED systems as essential for real-time energy analytics. Manufacturers such as Signify align product roadmaps with these priorities, evidenced by a jump to 153 million connected light points in Q1 2025.
Electricity tariff surges shortening payback periods
German commercial rates touched EUR 39.43 per 100 kWh in 2024, the EU’s highest, turning LED retrofits into near-term cash-flow positives.[4] California’s wholesale market fell below zero pricing during 15% of 2024 hours, encouraging demand-response programs that reward smart LEDs for load shifting.[5]
Restraints Impact Analysis of United States And Europe LED Lighting Market*
| Restraint | (~) % Impact on CAGR Forecast | Geographic Relevance | Impact Timeline |
|---|---|---|---|
| LED chip supply-chain volatility | -0.9% | Asia-Pacific manufacturing hubs | Short term (≤ 2 years) |
| High rewiring costs in historic buildings | -0.3% | NA & EU heritage districts | Medium term (2-4 years) |
| Stricter glare and blue-light ordinances | -0.4% | North America, EU | Medium term (2-4 years) |
| Laser-phosphor high-bay competition | -0.2% | Global industrial sites | Long term (≥ 4 years) |
| Source: Mordor Intelligence | |||
LED chip supply-chain volatility extending OEM lead times
Semiconductor bottlenecks pushed delivery windows for specialty LED drivers from 12 weeks to as many as 24 weeks, forcing manufacturers to carry higher inventories and eroding margins. China’s export restrictions on gallium and germanium intensified price pressure, while the forecast 67,000-engineer shortfall in the US semiconductor workforce threatens capacity expansions.
Stricter glare and blue-light ordinances delaying outdoor projects
At least 19 US states now require warm-spectrum, fully shielded fixtures to curb sky glow, with Maine proposing one of the tightest codes nationally. Compliance raises design complexity and project costs, particularly for municipalities where budget cycles already limit large-scale LED rollouts.
*Our forecasts treat driver/restraint impacts as directional, not additive. The impact forecasts reflect baseline growth, mix effects, and variable interactions.
United States And Europe LED Lighting Market Segment Analysis
By Application:
Hazardous zones drive industrial growthHazardous-area installations captured only a modest slice of the LED lighting market in 2025 yet are expected to post a 8.92% CAGR, outpacing every other application category. Explosion-proof luminaires are gaining traction in chemical plants, oil refineries and grain silos, where a single fixture failure can trigger catastrophic downtime. Certification requirements such as ATEX and UL844 widen the moat for established suppliers, supporting premium pricing.
Commercial offices remain the volume leader at 27.70% LED lighting market share, buoyed by corporate sustainability programs that demand fast-payback energy retrofits. Retailers continue to shift toward tunable-white LEDs that enhance merchandise appeal and cut refrigeration loads. Hospitality conversions progress more slowly because rewiring historic buildings can inflate project costs, yet owners increasingly specify filament-style LED lamps that preserve heritage aesthetics. Hospitals and schools are adopting circadian-supportive lighting, with occupancy sensors further trimming operational expenses. Industrial logistics hubs are layering Li-Fi connectivity atop high-bay LED arrays to support asset tracking. Taken together, the application mix underscores the maturity of the LED lighting market while highlighting pockets of double-digit growth where safety and automation intersect.

By Product Type:
Luminaires lead market evolutionIntegrated luminaires accounted for 67.10% of 2025 revenues, reflecting buyers’ preference for complete fixtures that merge optics, drivers and sensors into sealed systems. High-bay and low-bay models, driven by warehouse automation, represent the fastest-growing sub-segment with an 8.05% CAGR, underscoring how e-commerce reshapes lighting demand. The lamp category, although still significant for quick retrofits, faces commoditization pressures that squeeze margins. Troffers and downlights dominate ceiling-grid renovations because they drop into existing openings without rewiring, cutting labor costs by as much as 40%.
Street and area lighting demand is moving toward adaptive luminaires that dim automatically after midnight, extending service life and meeting dark-sky bylaws. Manufacturers increasingly bundle wireless drivers, photometric files and commissioning apps, pushing the LED lighting market further from component sales toward solution-oriented business models. Advanced optic designs now enable uniform vertical illuminance critical for automated picking robots, while upgraded thermal management extends rated life beyond 70,000 hours. As buyers prioritize lifecycle value over initial cost, luminaire-centric strategies reinforce leadership positions for integrated brands within the LED lighting market.
By Installation Type:
Retrofit dominance signals market maturityRetrofit projects commanded 61.30% of 2025 revenue, proof that the LED lighting market still leans heavily on replacement demand for fluorescent and HID systems. Rising electricity prices have shortened payback periods to well under two years in Germany and under 18 months in several US states, triggering mass relamping even before end-of-life failures. Utilities sweeten economics with prescriptive rebates that cover up to 30% of fixture cost when connected controls are included. New installations hold a smaller baseline but advance at 7.78% CAGR as data-center builds, semiconductor fabs and life-science campuses proliferate.
Building codes in both the EU and several North American jurisdictions now specify LEDs as the minimum standard, eliminating alternative technologies in new construction. Smart building retrofits often bundle luminaires, sensors and gateways to create demand-response ready spaces, a configuration increasingly required for green financing. Contractors favor plug-and-play kits that minimize wiring changes, reducing project timelines by up to 25%. Together, these dynamics illustrate how retrofit momentum anchors the LED lighting market while new-build projects introduce higher-margin smart-lighting opportunities.
By Connectivity:
Smart LEDs transform building operationsConnected products captured just 21.15% of 2025 shipments yet are forecast for a 9.22% CAGR to 2031 as building owners integrate lighting, HVAC and security into unified platforms. The revised EU Energy Performance of Buildings Directive mandates interoperable lighting controls in non-residential structures, guaranteeing a regulatory tailwind. PoE luminaires appeal to tenants that want low-voltage wiring and granular sensor data without separate cabling, while Bluetooth-mesh retrofits solve control challenges in older properties.
Conventional standalone LEDs still dominate on cost, but buyers are increasingly evaluating total cost of ownership when selecting fixtures. Demand-response incentives in California require addressable luminaires, pushing the LED lighting market further toward connectivity. Cloud dashboards enable maintenance teams to replace only failed drivers, cutting service calls by 40%. Cybersecurity certifications such as ISO/IEC 27001 become differentiators as connected nodes proliferate. These shifts indicate that smart capabilities will be central to long-term value capture in the LED lighting market.
By Distribution Channel:
E-commerce reshapes market accessWholesale and retail outlets maintained 59.05% share in 2025, yet online channels grew fastest at 8.56% CAGR as electricians adopt just-in-time ordering. Manufacturer-direct portals provide photometric calculators, BIM objects and live inventory status, shortening specification cycles by weeks. Bulk purchasing programs through e-commerce platforms now offer tiered discounts that rival traditional distributor pricing, eroding incumbent advantages.
Distributors respond by offering design-assist services and bonded inventory for large projects, demonstrating their ability to mitigate supply-chain uncertainty. Retail showrooms focus on educational displays featuring tunable-white and filament LEDs, driving homeowner awareness. Direct-to-site delivery reduces job-site downtime for contractors, while drop-ship models minimize inventory risk for suppliers. The rise of e-procurement reflects broader digitalization trends and underpins a more price-transparent LED lighting market.
By End-user Industry:
Residential growth outpaces industrial baseIndustrial facilities contributed 39.10% of 2025 revenues, supported by continuous-run production lines that value LED reliability and low maintenance. However, residential demand is projected to outstrip all other segments with a 6.19% CAGR, fueled by the DOE efficacy rule that phases out compact fluorescents. DIY e-commerce kits and rebate-backed promotions drive homeowner adoption, while smart speakers integrate voice-controlled lighting scenes.
Commercial office retrofits persist as tenants seek LEED certification and prepare for mandatory carbon reporting. Municipal street-lighting conversions progress unevenly as budget cycles extend project timelines, though smart-city pilots highlight energy and maintenance savings. Horticulture growers deploy spectrum-tunable LEDs to maximize crop yields, carving out a premium niche. Across all verticals, declining component costs and advancing controls technologies sustain volume expansion within the LED lighting market.
Geography Analysis
North America LED Lighting Market
North America accounted for 40.10% share of the LED lighting market in 2025, anchored by stringent DOE standards and escalating corporate sustainability commitments. US sales benefit from state-level fluorescent bans and utility rebates that push connected controls into mainstream specifications. Canada mirrors US policy under Natural Resources Canada guidelines, while Mexico’s maquiladora corridor accelerates industrial uptake amid reshoring trends. US manufacturers increasingly dual-source drivers from domestic and Mexican plants to mitigate Asian geopolitical risk.
Europe LED Lighting Market
Europe exhibits the most aggressive regulatory landscape, with the August 2023 mercury ban creating a compulsory upgrade cycle across all member states. France leads growth at 7.68% CAGR on the back of the revised EPBD and strong municipal modernization programs. German tariff levels reinforce payback-driven retrofits, while Nordic countries integrate LEDs into district smart-grid pilots. Southern economies prioritize basic lamp swaps due to budget constraints yet still benefit from EU funding instruments that subsidize energy efficiency.
Europe, North America and APAC LED Lighting Market
Supply-chain diversification reshapes regional competitive dynamics. European brands add Eastern European assembly lines to avoid Asian freight shocks, while US vendors near-shore driver production. These moves underpin a more resilient LED lighting market that can maintain delivery commitments despite semiconductor shortages or shipping disruptions.
Value Chain Analysis
The value chain starts upstream with raw materials and subcomponents (semiconductor materials, phosphors, optics, and thermal substrates) feeding LED chips, packages, drivers, sensors, and connectivity modules. These inputs go into luminaire and lamp OEMs that design, certify, and integrate control gear, then scale production via regional assembly and finishing before shipment to project channels. In the United States, compliance requirements tied to government-funded work have increased the importance of origin documentation across agents and distributors, reflected in industry discussions around Buy American Act and Build America, Buy America compliance at LightFair 2025.
Midstream, manufacturers balance in-house capabilities (optics, mechanicals, firmware, and commissioning tools) with outsourced electronics and contract manufacturing, then sell through direct project channels, wholesalers/distributors, and e-commerce. Downstream, lighting agents, ESCOs, electrical contractors, and facility management firms bundle products with audits, installation, and controls commissioning, which becomes more central for connected deployments. Supply chain risk remains a constraint, with specialty driver lead times extending versus historical norms, pushing OEMs to carry more inventory, qualify second sources, and redesign around component availability. Industry bodies such as LightingEurope and the American Lighting Association have also engaged policymakers on ecodesign, circularity, and cross-border test-procedure alignment to reduce friction in the EU and USMCA corridors.
Competitive Landscape
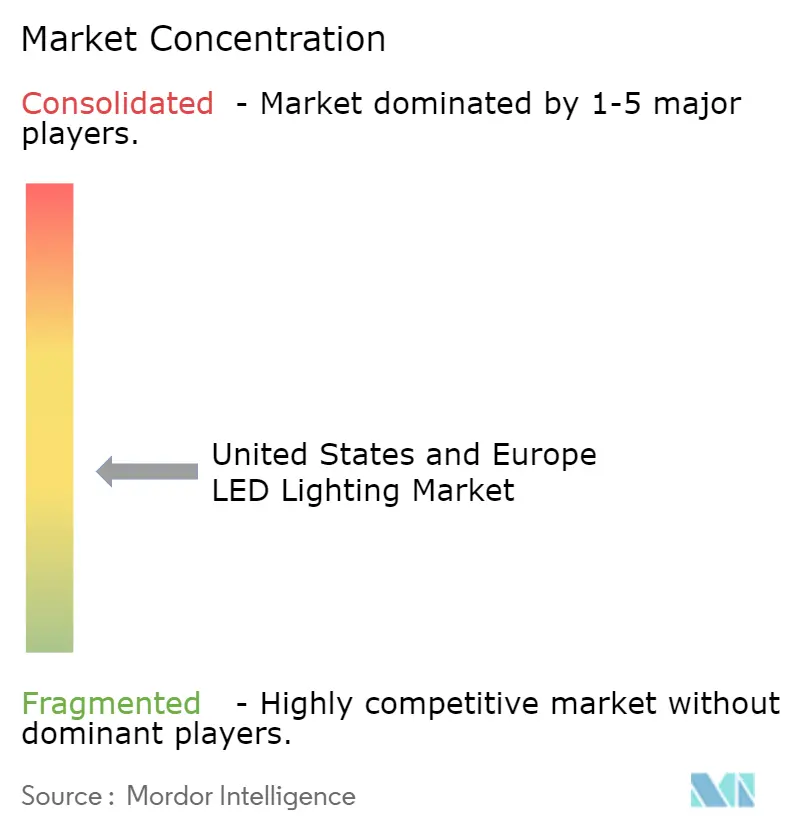
The LED lighting market displays a moderate concentration as global multinationals leverage vertical integration and smart-system portfolios to sustain margins against agile newcomers. Signify’s USD 1.4 billion acquisition of Cooper Lighting bolstered its North American channel reach and yielded USD 60 million in annual synergies. Siemens’ pending USD 10.6 billion purchase of Altair Engineering, owner of Toggled, evidences how industrial-automation vendors see lighting as a critical data layer within smart buildings.
Component specialists such as Nichia are advancing photonic-crystal surface-emitting lasers to compete in high-brightness niches, while semiconductor suppliers promote integrated drivers that shrink bill-of-materials cost. Meanwhile, Wolfspeed’s USD 1.25 billion financing for 200 mm silicon-carbide fabs aims to secure future capacity for high-efficiency drivers. Competitive focus is shifting from raw lumen output to system-level value, including data analytics, cybersecurity credentials and grid-interactive capabilities.
Pricing pressure persists in commodity lamps, but explosion-proof and smart-connected segments retain double-digit margins due to certification hurdles and software value-adds. Manufacturers that can guarantee delivery windows despite chip shortages command premium positioning. As a result, supply-chain flexibility joins product innovation as a decisive success factor in the LED lighting market.
United States And Europe LED Lighting Industry Leaders
-
Acuity Brands Inc.
-
Signify Holding (Philips Lighting)
-
LEDVANCE GmbH (MLS Co Ltd)
-
OSRAM GmbH
-
Current Lighting Solutions, LLC.
- *Disclaimer: Major Players sorted in no particular order
United States And Europe LED Lighting Market Companies Covered in this Report
- Signify Holding (Philips Lighting)
- OSRAM GmbH
- Acuity Brands Inc.
- Eaton Corporation (Cooper Lighting)
- LEDVANCE GmbH (MLS Co Ltd)
- Current Lighting Solutions, LLC.
- Cree Inc.
- Nichia Corporation
- Sharp Corporation
- Dialight PLC
- Zumtobel Group AG
- Hubbell Incorporated
- Panasonic Corporation
- US LED Ltd.
- Legrand S.A.
- Feilo Sylvania (Shanghai Yaming)
- Lutron Electronics Co.
- Trilux GmbH and Co. KG
- Fagerhult AB
- Heliospectra AB
Read Analysis of United States And Europe LED Lighting Companies
Market Opportunities and Future Outlook
Near-term whitespace is concentrating where policy and standards changes steer buyers toward higher-performance, compliant systems rather than basic lamp swaps. In Europe, ecodesign and energy labelling frameworks for light sources and separate control gear (Single Lighting Regulation (EU) 2019/2020 and the associated labelling rules) keep efficiency and product-information requirements prominent in specifications. New technical requirements are also tightening alongside this, with EN IEC 62471-2:2026 for commercial flicker-free LED lighting published in July 2026 and enforcement starting January 1, 2027. Manufacturers and test labs can translate this into qualification, documentation, and driver and control redesign work that preserves light quality under stricter compliance expectations.
Manufacturing and supply-chain investments are also creating a second opportunity lane, especially in localized, flexible production that supports customization, shorter lead times, and circularity-aligned designs. Signify opened a new 3D printing factory in Piła, Poland in July 2026, positioning additive manufacturing for tailored luminaires and spare-part supply in Europe, while LAMILUX inaugurated a new production facility in Hof-Gattendorf, Germany in May 2026 after a EUR 25 million investment, reinforcing regional capacity build-out. In the United States, policy process work continues as well, with the U.S. Department of Energy issuing a Request for Information on June 30, 2026 and advancing a proposal to revise its Process Rule for energy conservation standards. Firms with compliance engineering strength and rapid redesign cycles can gain leverage as rulemaking pathways progress and buyers keep prioritizing verifiable efficiency and lifecycle performance.
Recent Industry Developments in United States And Europe LED Lighting Market
- July 2026: Luminii acquired Croatia-based Filix Lighting, extending its portfolio into underwater and marine lighting applications. The deal broadens Luminii's reach in specialized environments where product sealing, corrosion resistance, and performance requirements differ from mainstream architectural lighting. It also signals ongoing consolidation around niche, higher-specification LED segments.
- June 2026: Signify expanded the Philips Hue smart home line with new wired switches, Play lamps, and next-generation candle bulbs across North American and European markets. The refresh deepens the installed base for app-controlled and interoperable smart lighting, reinforcing demand for connected LEDs rather than standalone replacements. The launch also strengthens ecosystem lock-in through accessories and upgraded form factors.
- June 2024: Acuity Brands advanced its 3D-printed luminaire strategy through the Eureka brand, extending additive-manufactured fixture options that emphasize design flexibility and rapid customization. This supports project specifications where differentiated aesthetics and shorter product iteration cycles matter, particularly in commercial interiors. The move also aligns with broader industry shifts toward localized, configurable manufacturing for luminaires.
United States And Europe LED Lighting Market Report Scope and Research Methodology
Market Definition and Coverage
We define this market as the revenue generated from LED-based lighting products sold and installed across the United States and Europe, covering both retrofit upgrades and new installations in indoor and outdoor settings.
Scope exclusions: It excludes non-LED legacy lighting (such as halogen, fluorescent, and HID) and excludes decorative components sold without a functional LED light source.
Segments Covered in This Report
- By Application
- Commercial Offices
- Retail
- Hospitality
- Industrial
- Warehouses and Factories
- Hazardous Zones
- Other Industrial Applications
- Other Applications
- By Product Type
- Lamps
- Bulbs
- Tubes
- Other Lamps
- Luminaires
- Downlights
- Troffers/Panel Lights
- High-bay/Low-bay
- Street and Area Lights
- Lamps
- By Installation Type
- Retrofit
- New Installation
- By Connectivity
- Conventional/Standalone
- Connected/Smart
- By Distribution Channel
- Direct Sales
- Wholesale/Retail
- E-Commerce
- By End-user Industry
- Commercial
- Industrial
- Residential
- Public and Street Lighting
- Horticulture
- By Geography
- North America
- United States
- Canada
- Mexico
- Europe
- United Kingdom
- Germany
- France
- Spain
- Italy
- Nordics
- Benelux
- Rest of Europe
- North America
Data Sources, Market Sizing, and Validation
Desk Research
For the initial fact base, we review public information that anchors demand, supply, and policy signals in the United States and Europe. Sources used include energy and efficiency publications such as the US Department of Energy and the European Commission, trade and market surveillance materials such as LightingEurope, and statistics portals such as Eurostat and the US Census Bureau for macro and construction-linked indicators.
We also triangulate the story with company annual reports, investor presentations, product catalogs, and credible press coverage to track product mix shifts and pricing direction. Where it helps to confirm company presence and rough scale, we reference paid subscriptions that compile company financials and news, patent databases for technology activity, and shipment-level import and export databases for trade flow checks. The desk sources listed here are illustrative, and many other public documents and datasets were reviewed to collect, validate, and clarify inputs.
Primary Interviews and Surveys
To close gaps left by public data, we conduct expert interviews and structured surveys with stakeholders across the value chain, including manufacturers, distributors, contractors, facility managers, and commercial and residential buyers. We balance inputs across the United States and major European markets so that adoption drivers, replacement cycles, and channel pricing assumptions can be cross-checked, then fed back into our totals.
Distribution of primary research fieldwork respondents
| Company type | Respondent position |
|---|---|
| Top tier: 27% | CXOs: 16% |
| Mid tier: 53% | Functional/Unit leaders: 26% |
| Smaller Players: 20% | Managers: 58% |
Market-Sizing & Forecasting
Sizing starts with a top-down build that links lighting demand to construction activity and the installed base replacement cycle, and then allocates value into LED adoption using policy phase-out timelines and observed penetration by application. Once the demand pool is reconstructed, we corroborate it with selective bottom-up checks such as sampled average selling price (ASP) by common form factors and a roll-up of representative supplier and channel volumes, which helps adjust for under-reporting in fragmented channels.
Key inputs used in the model include renovation and new-build indicators, LED retrofit rates, replacement intervals by end-use, ASP movement by lamp versus luminaire mix, and the share of connected or smart-enabled LED products where relevant. Forecasts are produced using scenario analysis that stress-tests energy price sensitivity and retrofit acceleration, and then aligns the chosen path with expert consensus from interviews. Where bottom-up datapoints are missing for smaller channels, we fill gaps using calibrated mix assumptions that are validated against trade flows and reported revenue splits.
Data Validation & Update Cycle
We validate outputs through multiple checks, starting with cross-verifying totals against independent signals like construction spending direction, policy-led technology transitions, and observable pricing and mix shifts. Large variances are reviewed in detail, and follow-up calls are triggered when a key assumption changes materially, such as a sharp ASP move or an unexpected slowdown in retrofit activity.
Before sign-off, the model is reviewed in steps by analysts so calculation logic, unit consistency, and year-to-year movements are checked, and then corrected where needed. Reports are refreshed annually, with interim updates when major events occur, and a final pre-delivery review is completed so clients receive the latest updated view.
Mordor Intelligence's US and Europe Led Lighting Market Size Compared Against Other Published Estimates
Published market values for US and Europe LED lighting can look far apart because the boundaries are not always the same, even when the titles sound similar. Differences typically come from what is counted as LED lighting revenue, how retrofit versus new-build demand is treated, and the year and currency timing used for conversion.
The table shows a noticeable spread that is mainly driven by scope and pricing logic, since some estimates fold in adjacent controls or broader fixtures revenue, and some assume faster ASP erosion without checking it against channel feedback and mix changes.
Benchmark comparison
| Source | Market Size | Gaps in Research Methodology |
|---|---|---|
| Mordor Intelligence | USD 21.60 B (2026) | |
| Regional Consultancy A | USD 24.10 B (2026) | This figure appears to include a wider set of lighting revenues bundled with LED fixtures, and it uses a higher share of commercial new-build value with limited adjustment for retrofit-driven replacement timing. |
| Trade Journal B | USD 18.90 B (2026) | This estimate seems to apply aggressive ASP decline assumptions across lamps and luminaires and may undercount contractor-led and distributor-led retrofit demand that does not show up cleanly in reported project pipelines. |
The table shows that the widest gap comes from what is treated as in-scope LED lighting revenue, and in Mordor Intelligence's model the total is limited to LED light sources and LED luminaires sold into the US and Europe, with retrofit replacement cycles explicitly modeled rather than assumed. With clear demand drivers, mix-linked pricing, and repeatable checks, the resulting number is easier to trace back to real installation and replacement activity.
Key Questions Answered in the Report
What is the current value of the LED lighting market in the United States and Europe?
The combined market generated USD 21.6 billion in 2026 and is forecast to reach USD 27.68 billion by 2031.
Which country leads the LED lighting market?
The United States led with 40.10% share in 2025, reflecting strong regulatory and corporate-sustainability drivers.
Why are hazardous-zone luminaires growing so quickly?
Explosion-proof LEDs meet stringent safety codes in oil, gas and chemical facilities, supporting a 8.92% CAGR through 2031.
How will the DOE 120 lm/W rule impact residential lighting?
The rule removes compact fluorescent options after 2028, effectively making LEDs the only compliant technology and accelerating residential retrofits.
What supply-chain risks could slow LED adoption?
Semiconductor shortages and China’s export controls on gallium and germanium have doubled lead times for certain LED drivers, pressuring project schedules and costs.