
United States Aftermarket Automotive Parts and Components Market Size and Share
Market Overview
| Study Period | 2020 - 2031 |
|---|---|
| Forecast Data Period | 2026 - 2031 |
| Base Year Market Size (2025) | USD 229.31 Billion |
| Market Size (2026) | USD 238.75 Billion |
| Market Size (2031) | USD 292.27 Billion |
| Growth Rate (2026 - 2031) | 4.12 % |
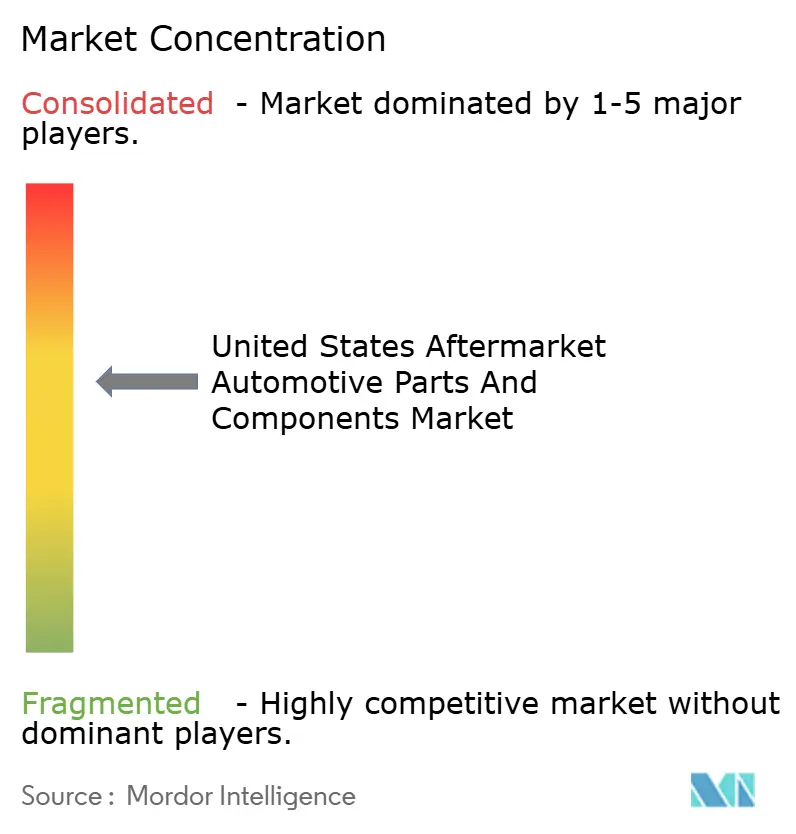
| Market Concentration | Medium |
Major Players *Disclaimer: Major Players sorted in no particular order Image © Mordor Intelligence. Reuse requires attribution under CC BY 4.0. | |
United States Aftermarket Automotive Parts and Components Market Analysis by Mordor Intelligence
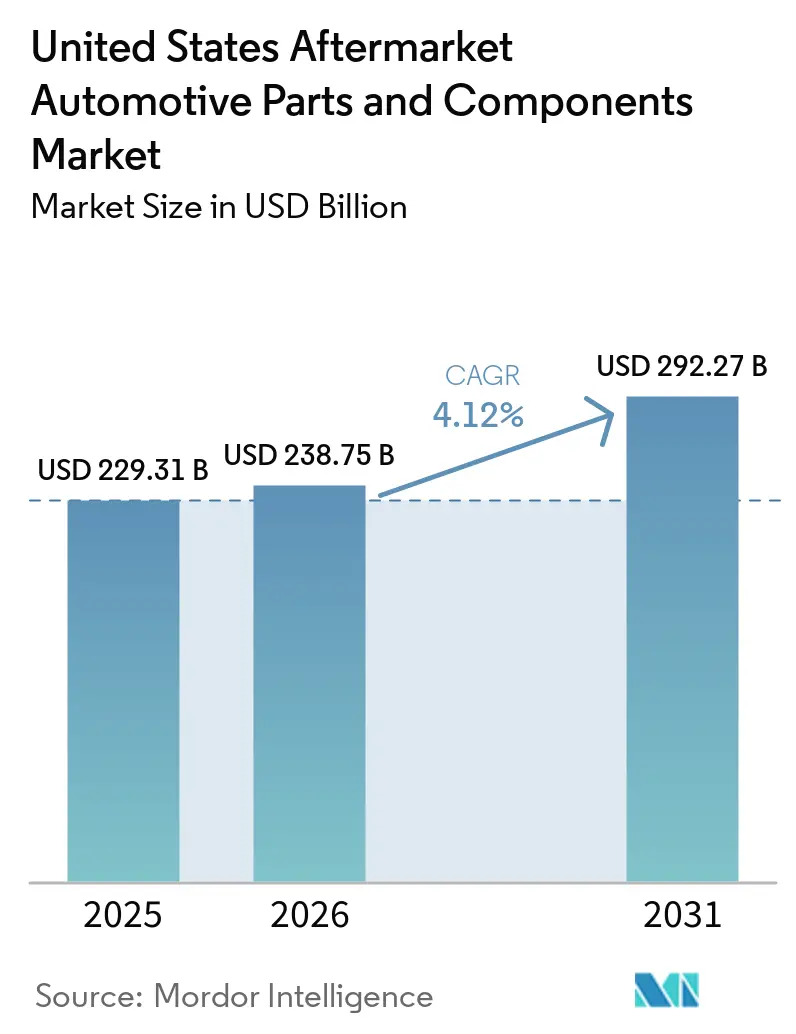
The United States aftermarket automotive parts and components market size is expected to grow from USD 229.31 billion in 2025 to USD 238.75 billion in 2026 and is forecast to reach USD 292.27 billion by 2031 at 4.12% CAGR over 2026-2031. A longer average vehicle age, strong light-truck sales, and rapid e-commerce uptake underpin this expansion. Elevated new-vehicle prices, wider right-to-repair statutes, and post-pandemic driving recovery stimulate replacement demand, while emerging electrified retrofit kits carve out premium specialty niches. Competitive intensity varies by component category, yet suppliers that pair omnichannel distribution with electronics expertise are positioning for durable growth. Regulatory initiatives, from EPA emissions rules to state EV mandates, act as simultaneous headwinds and tailwinds, reshaping the aftermarket automotive parts market through shifting compliance requirements.
Key Report Takeaways
- By vehicle type, passenger cars held 52.74% of the United States aftermarket automotive parts and components market share in 2025, whereas light commercial vehicles are projected to expand at a 7.05% CAGR through 2031.
- By component, engine parts commanded 31.45% the United States aftermarket automotive parts and components market size in 2025, while advanced ADAS sensors posted the fastest 7.52% CAGR during the forecast period.
- By sales channel, offline distribution retained 78.20% of the United States aftermarket automotive parts and components market share in 2025, yet online platforms are advancing at a 8.88% CAGR by 2031.
- By propulsion, internal-combustion vehicles accounted for 86.95% of the United States aftermarket automotive parts and components market share in 2025; battery electric segments are growing at a 7.18% CAGR through 2031.
- By service channel, DIFM independent garages captured a 56.30% of the United States aftermarket automotive parts and components market share in 2025, and online DIY activity is rising at a 7.56% CAGR during the forecast period (2026-2031).
Note: Market size and forecast figures in this report are generated using Mordor Intelligence’s proprietary estimation framework, updated with the latest available data and insights as of 2026.
Market Trends and Insights
Drivers Impact Analysis of United States Aftermarket Automotive Parts and Components Market*
| Driver | (~) % Impact on CAGR Forecast | Geographic Relevance | Impact Timeline |
|---|---|---|---|
| Aging Vehicle Parc | +1.2% | Rust Belt, Southwest | Long term (≥ 4 years) |
| Shift to Larger SUVs and Pickups | +0.8% | Texas, Mountain West | Medium term (2-4 years) |
| E-commerce Penetration | +0.6% | Urban centers nationwide | Short term (≤ 2 years) |
| Rebound in Vehicle-miles-traveled | +0.5% | National; weaker in transit-oriented metros | Short term (≤ 2 years) |
| Right-to-repair Statutes | +0.4% | Maine, Massachusetts; spreading nationally | Short term (≤ 2 years) |
| Electrified Retrofit Kits | +0.3% | California, Northeast | Medium term (2-4 years) |
| Source: Mordor Intelligence | |||
Shift to Larger SUVs and Pickups Raises Wear-Part Revenues
Light trucks are poised to take the automotive market by storm, likely capturing a substantial share of new-vehicle sales by 2027. Each of these robust vehicles commands a higher automotive aftermarket expenditure compared to traditional passenger cars, reflecting their unique demands and capabilities. The components that comprise these trucks, suspension, braking, and drivetrain parts, must endure considerably greater stress due to the hefty loads they tow and carry.
As lifestyle trends like overlanding, trailering, and outdoor adventures gain popularity, the appetite for performance-enhancing upgrades swells. Enthusiasts are seeking out lift kits, heavy-duty shocks, and oversized tires to elevate their driving experiences and tackle rugged terrains. The market for specialty equipment tailored to pickups has already surpassed an impressive USD 16 billion annually, prompting manufacturers to roll out dedicated product lines for these versatile vehicles.
Light-truck owners are often passionate about customization, leading to an average transaction value for upgrades that frequently eclipses that of standard replacements. This trend not only enhances the aesthetics and functionality of their trucks but also elevates profit margins across the aftermarket automotive parts sector, signaling a thriving market with boundless potential.
E-Commerce Penetration Accelerates Long-Tail SKU Availability
The vast majority of aftermarket transactions now traverse the dynamic landscape of digital channels, far surpassing the overall adoption of retail e-commerce across the United States. This remarkable shift allows online storefronts to showcase specialized SKUs without the burdensome costs of inventory that traditional brick-and-mortar wholesalers encounter. As a result, they can effortlessly provide nationwide access to hard-to-find parts for vintage models, catering to enthusiasts and collectors alike. Drop-shipment logistics and real-time inventory data reduce lead times for DIYers and small garages, redistributing market power toward digitally savvy suppliers. Yet counterfeit inflow remains an acute risk; federal enforcement actions underscore the importance of brand-protection programs [1]. Firms that combine robust authentication technology with user-friendly interfaces are capturing a disproportionate share of the expanding digital aftermarket.
Electrified Retrofit Kits Open High-Margin Specialty Niches
California incentives and northeastern clean-air mandates have triggered early adoption of bolt-on hybrid and full-electric conversion kits. These systems command premium prices and require expert installation, generating lucrative parts and service revenue. Commercial fleet operators see retrofits as bridges to compliance without full fleet replacement, while enthusiasts value performance gains and emissions benefits. Technical complexity raises entry barriers, insulating pioneers from commoditization pressures common in mature categories. Still, evolving safety certification protocols introduce regulatory uncertainty that could either streamline or constrain market uptake, making continuous standards monitoring crucial for kit manufacturers.
Post-Pandemic Rebound in Vehicle Miles Traveled Lifts Service Frequency
Federal Highway Administration data show total miles driven returned to pre-2020 baselines by mid-2024 and are projected to grow 0.5% annually through 2050 [2]. Combination truck mileage is rising even faster, at 1.1% per year, elevating demand for commercial-grade filters, tires, and drivetrain parts. Private-vehicle utilization rebounds unevenly, with suburban and rural areas eclipsing urban centers, still favoring remote work or multimodal transport. Regardless, increased road exposure accelerates wear cycles, benefiting suppliers of high-frequency replacement categories such as wipers, brake pads, and lubricants. Logistics operators, sensitive to downtime, are adopting predictive maintenance solutions that integrate parts ordering into telematics platforms, reinforcing parts turnover velocity.
Restraints Impact Analysis of United States Aftermarket Automotive Parts and Components Market*
| Restraint | (~) % Impact on CAGR Forecast | Geographic Relevance | Impact Timeline |
|---|---|---|---|
| EVs Contain Fewer Moving Parts | -0.9% | California, Northeast | Long term (≥ 4 years) |
| ADAS Lowers Collision-part Volumes | -0.4% | Nationwide, premium segments | Medium term (2-4 years) |
| OEM Service-as-software Subscriptions | -0.3% | National, luxury brands | Medium term (2-4 years) |
| Counterfeit Inflow Via E-commerce | -0.2% | Online-centric states | Short term (≤ 2 years) |
| Source: Mordor Intelligence | |||
ADAS Lowers Collision-Part Volumes
Automatic emergency braking and lane-keeping systems are cutting crash rates, trimming demand for bumpers, fenders, and lamps. Collision frequency declines most among late-model premium vehicles, where ADAS penetration is highest, compressing volumes for cosmetic body parts. Offsetting this decline, repairs on ADAS-equipped vehicles command higher invoice values due to mandatory sensor calibration and longer labor hours. Replacement of damaged cameras or radar modules fosters growth in specialized electronics sub-segments. Collision-repair centers are upskilling and investing in advanced scan tools, benefiting parts suppliers that offer OE-grade sensors and calibration fixtures.
OEM “Service-as-Software” Subscriptions Cannibalize Hardware Sales
Vehicle makers are monetizing software-locked features—heated seats, performance boosts, or light-duty towing modes—via subscription models delivered over-the-air. Such digitization diverts discretionary spending away from traditional bolt-on performance parts. Luxury brands are first movers, but midmarket adoption is visible in 2025 model-year launches. Hardware suppliers risk revenue erosion if digital upgrades fully substitute mechanical enhancements. Conversely, retro-software unlock kits and telematics interfaces represent emergent niches where independent developers might compete, though IP challenges could constrain scale.
*Our forecasts treat driver/restraint impacts as directional, not additive. The impact forecasts reflect baseline growth, mix effects, and variable interactions.
United States Aftermarket Automotive Parts and Components Market Segment Analysis
By Vehicle Type:
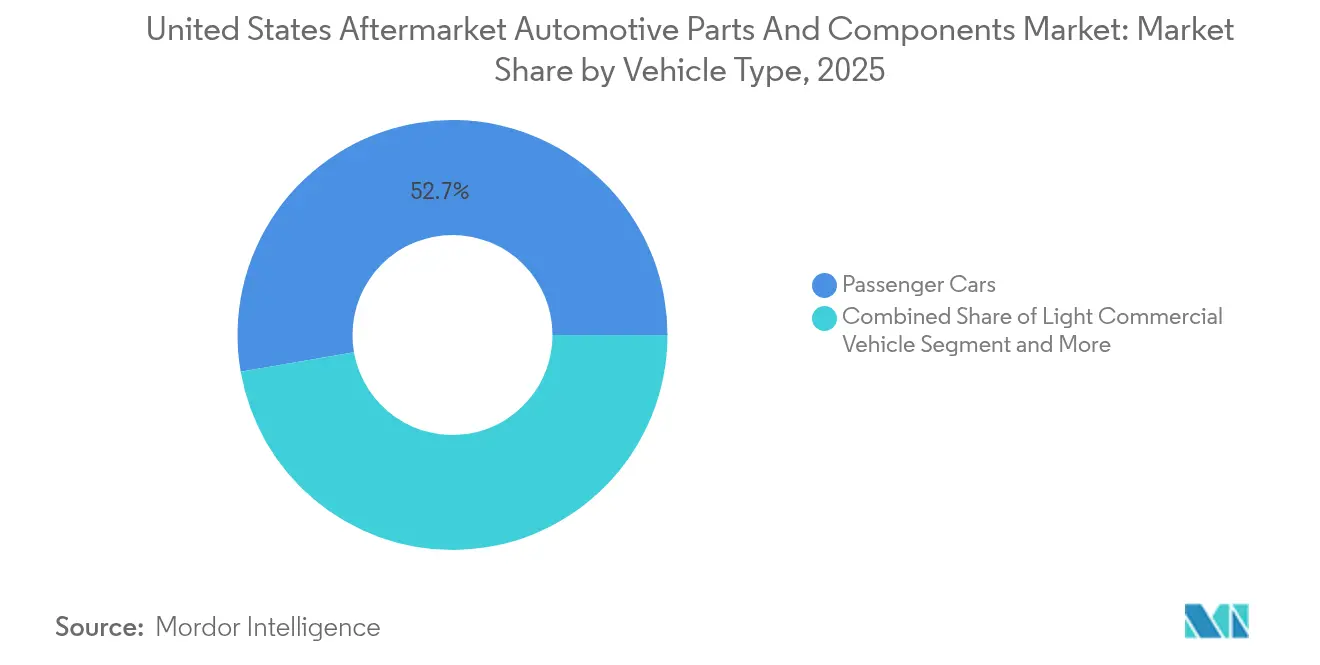
Commercial Demand Outpaces Passenger-Car GrowthPassenger cars accounted for 52.74% of the United States Aftermarket Automotive Parts and Components Market overall revenue in 2025, anchored through an expansive installed base. Nevertheless, commercial light trucks are projected to post a 7.05% CAGR, elevating their contribution to the aftermarket automotive parts market size as parcel delivery and service fleets log higher daily mileage. Combining intensive duty cycles and stringent uptime requirements lifts replacement frequency for brake assemblies, driveline joints, and cooling components. Fleet operators’ procurement practices favor suppliers that guarantee rapid availability and streamlined warranty processes, nudging parts makers toward depot-level inventory and predictive fulfillment systems.
Medium and heavy trucks yield outsized monetary value, while smaller in volume, because individual components carry higher price tags and downtime penalties. EPA 2027 emissions rules motivate prebuy activity and aftermarket retrofits of selective catalytic reduction and particulate filters, temporarily boosting heavy-duty demand. Buses and coaches, newly segmented in the forecast, open ancillary potential for specialist providers of high-capacity thermal-management and suspension products. Passenger-car segments remain relevant but confront a plateauing unit base as households question the need for multiple vehicles in the era of hybrid work, whereas fleet vehicles appear locked into growth trajectories tied to logistics expansion.

By Component Type:
Electronics Reshape Core CategoriesEngine components retained 31.45% of the United States Aftermarket Automotive Parts and Components Market in 2025, mirroring the still-dominant ICE parc. Yet ADAS sensors are forecast for a 7.52% CAGR, signaling the pivot from mechanical to electronic value. Camera modules, radar units, and control ECUs often fail in minor collisions or succumb to environmental contaminants, creating high-margin replacement cycles. Continental’s 2024 launch of 700 new engine-management SKUs illustrates suppliers’ dual strategy of defending mechanical strongholds while scaling electronics portfolios.
Suspension, brake, and tire categories see ongoing lift from the trend toward heavier SUVs and pickups. Electrical and infotainment sub-segments increase as drivers seek connectivity upgrades and over-the-air functionality, blurring the line between aftermarket hardware and software services. Body and exterior parts face mixed fortunes: ADAS reduces collision frequency, yet personalization culture and regional climate damage sustain baseline demand. Tools, diagnostics, and shop consumables are expanding as independent garages gear up to service complex, software-driven vehicle systems.
By Sales Channel:
Digital Surge Reshapes DistributionOffline wholesalers and jobbers preserved 78.20% the United States Aftermarket Automotive Parts and Components Market size in 2025, underscoring entrenched installer relationships in a market where professional labor remains indispensable for complex repairs. That said, the online segment exhibits a 8.88% CAGR—the strongest across the value chain—as price-sensitive DIYers and tech-enabled garages turn to e-retailers for rapid parts sourcing. Marketplace algorithms surface long-tail SKUs once restricted to specialty catalogs, aiding parts retrieval for discontinued models and niche performance builds.
Hybrid omnichannel strategies are emerging, with brick-and-mortar distributors offering click-and-collect and same-day courier services to retain professional customers. Pure-play e-commerce entities deploy fitment-verification AI to cut return rates and win consumer confidence. Counterfeit threats remain acute online, so platforms integrating authenticity blocks and serialized packaging gain reputational advantages. As fulfillment speed parity narrows between channels, comprehensive product data and installation support become differentiators in unit conversion.
By Propulsion Type:
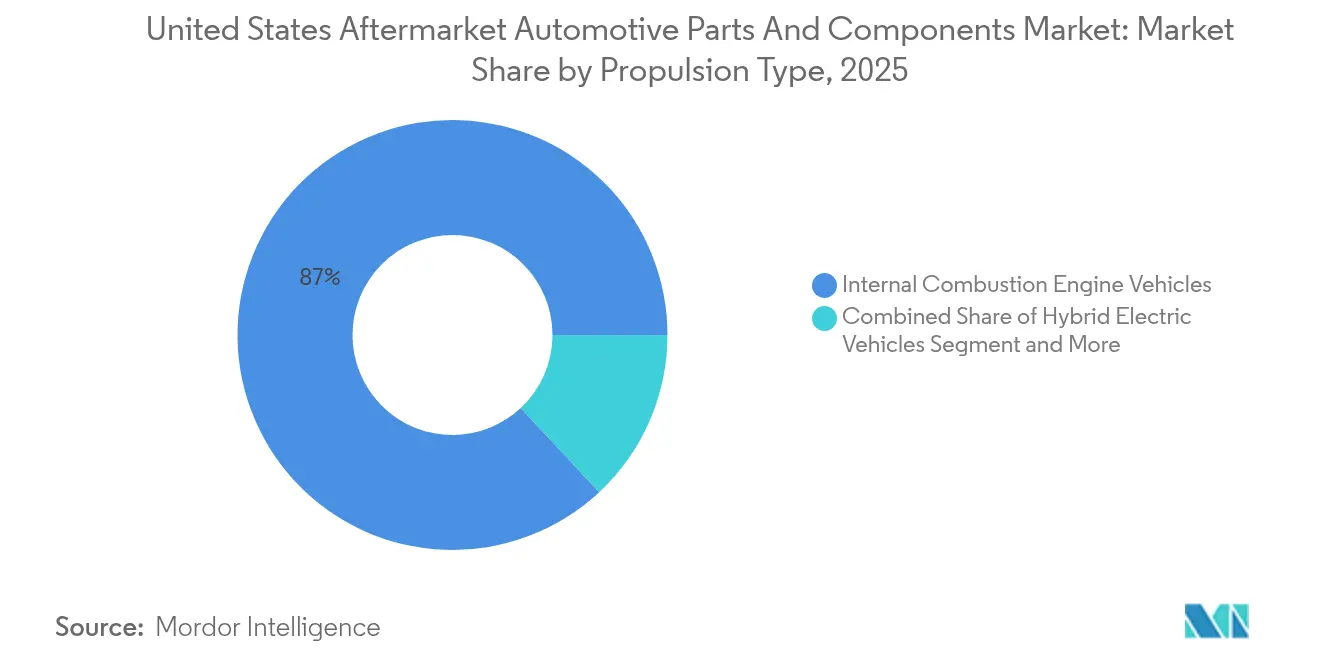
ICE Still Dominant Amid Gradual ElectrificationInternal-combustion vehicles represented 86.95% of the United States Aftermarket Automotive Parts and Components Market size in 2025, ensuring a long runway for traditional components such as timing belts, oil filters, and exhaust systems. Nevertheless, battery electric vehicles exhibit a 7.18% CAGR, introducing fresh demand for thermal-management loops, specialized brake pads, and cabin filters tuned for low-noise interiors. Hybrid platforms blend both worlds, creating dual parts pathways—conventional replacements and high-voltage systems—complicating inventory planning.
Regulatory accelerants such as California’s Advanced Clean Cars II mandate push OEMs toward EV rollouts, but regional variation slows nationwide component displacement. Suppliers hedging against ICE decline are investing in silicone-based fluid technologies and compact power electronics, areas forecast to mature rapidly. Fuel-cell vehicles remain nascent, but heavy-duty pilot programs could unlock aftermarket needs for hydrogen tanks and compressor components later in the decade.
By Service Channel:
Professional Installation Retains PrimacyDIFM independent garages held 56.30% of the United States Aftermarket Automotive Parts and Components Market size in 2025, benefiting from rising vehicle complexity that discourages driveway repairs. These shops leverage advanced scan tools and subscription-based diagnostic software to service aging ICE engines and next-gen sensor suites. Though the smallest segment, online DIY is expanding at a 7.56% CAGR as video tutorials and direct-ship parts lower entry barriers for competent enthusiasts.
Fleet maintenance networks pursue predictive analytics, scheduling component swaps ahead of failure to avoid costly downtime—a model driving steady parts throughput in commercial channels. Traditional DIY retail faces overlap from e-commerce but retains value through immediate product access, especially during emergency breakdowns. Training investments in high-voltage safety and ADAS calibration are becoming baseline requirements across professional channels, subtly shifting labor mix toward higher-skill positions.
Geography Analysis
Harsh winter climates in the Northeast and Midwest accelerate corrosion, lifting demand for chassis, brake, and under-body components at a pace that exceeds the national aftermarket automotive parts market size growth rate. Road salt exposure shortens replacement intervals for suspension arms and exhaust systems, making these regions prime territories for rust-resistant product lines. California remains the bellwether for EV-specific parts and retrofit solutions, spawning clusters of specialty installers focused on battery diagnostics and conversion kits.
The Southeast combines population growth with favorable economic conditions, fueling steady unit expansion in the aftermarket automotive parts market. Warm climates reduce corrosion but heighten cooling-system stress, leading to elevated radiator and condenser turnover. Mountain West states showcase strong demand for off-road accessories, with altitude and rugged terrain driving interest in heavy-duty suspension kits and performance air-intake upgrades. Texas stands out as a distribution powerhouse, serving both urban hubs and rural oil-field fleets, and its light-truck orientation amplifies parts revenue per vehicle.
Urban-rural splits persist: metropolitan areas rely on same-day logistics and expanded SKU assortments, whereas rural dealers prioritize reliability and broader coverage of multipurpose components. Proximity to OEM assembly plants in the Midwest offers freight advantages for some distributors. Federal safety and emissions rules create baseline uniformity, yet patchwork state regulations—particularly on data access and emissions—result in regional differentiation that suppliers must navigate.
Regulatory Landscape
The United States aftermarket automotive parts and components market works within a layered compliance regime covering emissions, safety, and consumer protection. In July 2026, the U.S. Environmental Protection Agency (EPA) recognized SEMA as an alternative certification authority for certain aftermarket emissions-related products under its Certified Emissions (SC-E) program framework, creating a new pathway alongside Clean Air Act compliance practices that have historically relied on state-level programs such as CARB for performance parts validation.
On safety, the National Highway Traffic Safety Administration (NHTSA) framework is built around manufacturer self-certification to Federal Motor Vehicle Safety Standards (FMVSS) under 49 U.S.C. 30115, while 49 U.S.C. 30122 (the "make inoperative" provision) constrains commercial installers from disabling compliance when fitting aftermarket parts. Right-to-repair momentum continues through federal and state activity, with the Federal Trade Commission (FTC) maintaining guidance and enforcement posture on repair restrictions and the marketing of rebuilt or reconditioned parts (16 CFR Part 20), reinforcing labeling and disclosure expectations in aftermarket distribution.
Value Chain Analysis
The value chain spans raw materials and subcomponents (metals, polymers, electronics), tiered parts manufacturing (OE suppliers, branded aftermarket producers, private label), and a multi-node distribution system (warehouse distributors, jobbers, retailers, e-commerce marketplaces) that supplies installers and end users across DIY and DIFM. Complexity is heightened by broad-range, low-volume, and limited-run SKU requirements, while USMCA-linked North American sourcing remains a key organizing structure for cross-border inputs and finished goods flows within the supplier ecosystem.
Recent operational responses show a push toward digitalization and alternative fulfillment models. In January 2025, 3D Systems and Daimler Truck (Daimler Buses) announced a decentralized spare-parts production approach using additive manufacturing with partners including Oqton and Wibu-Systems, aiming to reduce lead times for critical parts and ease logistics bottlenecks. At the same time, Stellantis has pursued distribution-oriented partnerships (including with NEXUS Automotive International globally and multi-year Mopar supply agreements in other regions), illustrating how OEM-aligned parts networks and independent channels both emphasize faster availability, authenticated product data, and tighter inventory coordination across omnichannel routes to market.
Competitive Landscape
Market fragmentation remains pronounced in commodity categories such as filters and fluids, where private-label penetration is rising. In contrast, electronics and ADAS parts show increasing concentration as certification hurdles favor scale players. Strategic acquisitions, Standard Motor Products’ purchases of Nissens Automotive and Stabil Group, for example, signal a pivot toward thermal-management and sensor capabilities that support future vehicle architectures[3].
Recent moves by RealTruck and others, seeking closer consumer contact and higher blended margins, have been characterized by vertical integration into distribution and e-commerce channels. Technology investments, including predictive demand algorithms and AI-driven fitment tools, differentiate top-tier suppliers from lower-capex rivals. White-space pockets exist around EV-specific consumables and connected-vehicle data services, but incumbents must balance capital allocation between emerging segments and legacy cash generators.
Regulatory compliance expertise—spanning EPA emissions standards, cybersecurity protocols, and battery shipment regulations—is becoming a competitive moat. Firms adept at navigating this complexity are forging preferred-supplier agreements with fleets and national repair chains. Yet headwinds persist: raw-material price volatility and skilled-labor shortages inflate cost structures, making operational efficiency gains and supply-chain resilience critical to sustaining profitability across the aftermarket automotive parts industry.
United States Aftermarket Automotive Parts and Components Industry Leaders
-
AutoZone Inc.
-
Advance Auto Parts Inc.
-
O’Reilly Automotive Inc.
-
Genuine Parts Co. (NAPA)
-
LKQ Corporation
- *Disclaimer: Major Players sorted in no particular order
United States Aftermarket Automotive Parts and Components Market Companies Covered in this Report
- Magna International Inc.
- Continental AG
- ZF Friedrichshafen AG
- DENSO Corporation
- Robert Bosch GmbH
- Lear Corporation
- Flex-N-Gate Corporation
- Panasonic Automotive Systems Co. of America
- Aisin World Corp. of America
- American Axle & Manufacturing
- Yazaki North America
- Adient PLC
- Faurecia SE
- Aptiv PLC
- LKQ Corporation
- Advance Auto Parts Inc.
- O'Reilly Automotive Inc.
- AutoZone Inc.
- Genuine Parts Co. (NAPA)
- Tenneco Inc.
- Dana Incorporated
- BorgWarner Inc.
- Goodyear Tire & Rubber Co.
Read Analysis of United States Aftermarket Automotive Parts and Components Companies
Market Opportunities and Future Outlook
Regulatory and standards activity is creating specific pockets of opportunity where compliance capability becomes a differentiator. The EPA action in July 2026, recognizing SEMA as an alternative certification authority for certain aftermarket emissions-related products, gives performance and replacement suppliers a clearer way to support emissions compliance proof points, supporting product-line extensions in catalytic or exhaust-adjacent and engine-management categories without relying only on legacy certification pathways.
Operational compliance and traceability are also strengthening the case for import-heavy categories and online-first sellers. A new U.S. Consumer Product Safety Commission (CPSC) traceability requirement, communicated for implementation from August 1, 2026, calls for unique QR-code identification on the smallest sales unit for imported aftermarket parts, pushing distributors and brands to upgrade packaging, serialization, and data systems that connect product identity to fitment and provenance. In the same timeframe, policy movement around repair data access, including the House Energy and Commerce Committee approval of H.R. 7389 (Motor Vehicle Modernization Act) in May 2026, reinforces the value of diagnostic tooling, calibration services, and data-enabled parts programs for independent garages as the ADAS-equipped parc expands.
Recent Industry Developments in United States Aftermarket Automotive Parts and Components Market
- June 2026: AutoZone authorized an additional USD 1.5 billion share repurchase program. The move signals continued financial flexibility and reinforces the companys emphasis on capital returns alongside store and commercial-account execution, which can influence competitive pricing and investment intensity across major retail distributors.
- February 2026: Genuine Parts Company announced a plan to separate its automotive and industrial businesses into two independent public companies. The separation frames a clearer strategic focus for NAPA-linked operations and creates a cleaner structure for segment-specific investment decisions across distribution, digital tools, and supply-chain initiatives.
- November 2024: Standard Motor Products acquired Nissens Automotive for about USD 390 million, expanding its thermal-management portfolio. The deal strengthens coverage in cooling and climate categories that are gaining importance with heavier light trucks and electrified platforms, while also broadening the companys position with distributors and installer channels.
United States Aftermarket Automotive Parts and Components Market Report Scope and Research Methodology
Market Definition and Coverage
For this study, the market covers revenue generated in the United States from aftermarket automotive parts and components that are purchased to maintain, repair, or replace items on vehicles after the original sale.
Scope exclusions: We exclude labor-only repair services, extended warranties, and roadside assistance when they are billed separately from the sale of a physical part.
Segments Covered in This Report
- By Vehicle Type
- Passenger Cars
- Light Commercial Vehicles (Class 1-3)
- Medium & Heavy Trucks (Class 4-8)
- Buses & Coaches (NEW)
- By Component Type
- Engine Components (filters, gaskets, pistons)
- Transmission & Driveline
- Electrical & Electronics (sensors, alternators, ADAS)
- Suspension & Brakes
- Body & Exterior (bumpers, lighting)
- Tires
- Interior & Accessories
- Fluids & Lubricants
- Others (Seat and Covers, etc.)
- By Sales Channel
- Online
- Offline
- By Propulsion Type
- Internal-Combustion Engine (ICE) Vehicles
- Hybrid Electric Vehicles (HEV)
- Battery Electric Vehicles (BEV)
- Plug-in Hybrid Electric Vehicles (PHEV)
- Fuel-Cell Electric Vehicles (FCEV)
- By Service Channel
- DIY (Do-It-Yourself)
- DIFM Independent Garages
- Fleet / Commercial Service Providers
Data Sources, Market Sizing, and Validation
Desk Research
Desk research was used to set the factual base for the model and to keep assumptions realistic. We referenced public datasets and publications such as US Department of Transportation and FHWA vehicle miles traveled series, US Energy Information Administration fuel price and consumption trends, US Census Bureau retail trade releases, and US Bureau of Labor Statistics CPI series for vehicle parts and related maintenance inputs.
To connect demand with the replacement cycle, we also reviewed sources such as EPA and state-level vehicle emissions and inspection guidance, NHTSA recall databases, and trade association publications that discuss vehicle age, repair frequency, and channel shifts. Company filings, investor presentations, and reputable press were used to cross-check distribution patterns and price positioning, and a paid subscription for company financials and news helped confirm revenue splits where disclosures were available. This list is not exhaustive, and many other public and paid sources were also used for data collection, validation, and clarification.
Primary Interviews and Surveys
Primary work focused on validating the demand pool and the pricing logic behind major replacement categories. We spoke with a mix of distributors, retailers, service operators, and parts-focused experts across the US to pressure-test inputs such as repair incidence, channel mix (store-based vs online), and typical markups applied through the value chain.
Distribution of primary research fieldwork respondents
| Company type | Respondent position |
|---|---|
| Top tier: 27% | CXOs: 18% |
| Mid tier: 54% | Functional/Unit leaders: 34% |
| Smaller Players: 19% | Managers: 48% |
Market-Sizing & Forecasting
Sizing starts with a top-down build that links the US vehicle in operation and usage intensity to replacement-driven demand, and then converts that demand into dollars using observed price bands for common parts baskets. To keep the model tied to real-world activity, we used inputs such as vehicle parc and age mix, annual miles traveled, replacement cadence for wear items, the share of DIY versus DIFM jobs, and inflation-adjusted average selling price movement for key components.
Once the total is formed, results are corroborated with selective bottom-up checks where data is available, such as rolling up sampled supplier and distributor revenue disclosures, channel checks on unit volumes for high-frequency categories, and ASP times volume estimates for a few anchor parts. When bottom-up signals do not cover the full market, we handle gaps by applying conservative penetration rates and then validating those rates in follow-up expert calls.
Forecasts were built using scenario analysis, where variables like vehicle age progression, miles traveled, and parts price inflation are projected under base, cautious, and accelerated cases, and then aligned to what interviewees report in their order pipelines and service bay throughput. The final forecast path is selected after the assumptions produce a consistent story across demand indicators and pricing behavior.
Data Validation & Update Cycle
Validation is done through multiple checks so the final number is not dependent on a single dataset. We compare outputs against independent signals like retail sales trends, parts-related inflation series, and vehicle usage indicators, and then investigate any variance that looks too large to be explained by mix shifts.
Before sign-off, the model and key assumptions are reviewed by another analyst, and any sensitive parameters are rechecked with fresh source reads or re-contacts when responses conflict. The report is refreshed annually, and interim updates are made when material events occur, such as large pricing swings or major regulatory and recall changes. Right before delivery, a final pass is completed so the latest updated view is reflected in the published output.
Mordor Intelligence's US Aftermarket Automotive Parts and Components Market Size Compared With Other Published Estimates
Published market sizes for the US aftermarket often vary because not every estimate counts the same revenue streams, and the year assumptions behind pricing and volume can be different. Differences also come from how channels are treated, especially when online sales, installer-led purchases, and commercial fleet demand get mixed together.
The main gap comes from whether labor and bundled repair invoices are included, where Mordor Intelligence counts only parts and component revenue and then tests pricing using parts-specific inflation and channel markups rather than total repair spend.
Benchmark comparison
| Source | Market Size | Gaps in Research Methodology |
|---|---|---|
| Mordor Intelligence | USD 229.31 B (2025) | |
| Global Consultancy A | USD 217.56 B (2024) | Uses an earlier base year and a broader aftermarket ecosystem definition that can blend parts with installation and maintenance services, which changes the counted revenue pool and the implied price level. |
| Industry Publisher B | USD 238.40 B (2025) | Positions the estimate under a wider automotive aftermarket lens that typically includes service-channel economics, and the larger forecast window can apply different inflation and vehicle usage assumptions. |
The spread in the table is mostly explained by what is counted as aftermarket revenue, and how pricing is carried forward from the chosen base year. By keeping the scope anchored to parts and components and then cross-checking it with vehicle usage and parts price indicators, the final number remains traceable to clear drivers that can be repeated in updates.
Key Questions Answered in the Report
How big is the aftermarket automotive parts market in 2026?
It reached USD 238.75 billion in 2026.
Which vehicle category is growing fastest in U.S. parts demand?
Light commercial vehicles are the fastest, with a 7.05% CAGR forecast through 2031.
What component segment shows the highest growth rate?
Advanced ADAS sensors lead with a 7.52% CAGR, reflecting rising safety-technology penetration.
How will electrification impact replacement-part demand?
EVs feature 30–40% fewer moving parts, trimming traditional hardware demand but creating new needs in thermal-management and electronics.
Do right-to-repair laws benefit independent garages?
Yes, expanded data access is expected to steer more out-of-warranty repairs to independent shops, reinforcing their 56.30% market share.