
Urgent Care Center Market Size and Share
Market Overview
| Study Period | 2020 - 2031 |
|---|---|
| Market Size (2026) | USD 30.34 Billion |
| Market Size (2031) | USD 39.32 Billion |
| Growth Rate (2026 - 2031) | 5.32 % |
| Fastest Growing Market | Asia Pacific |
| Largest Market | North America |
| Market Concentration | Medium |
Major Players *Disclaimer: Major Players sorted in no particular order Image © Mordor Intelligence. Reuse requires attribution under CC BY 4.0. | |
Urgent Care Center Market Analysis by Mordor Intelligence
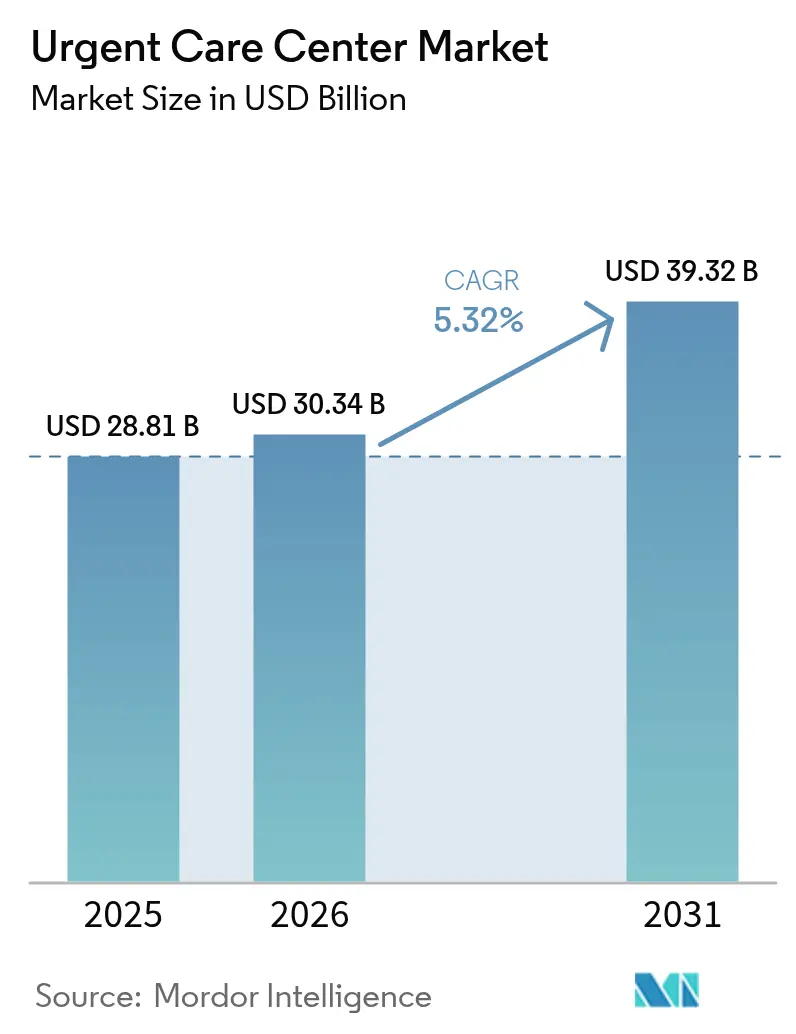
The urgent care center market size was valued at USD 28.81 billion in 2025 and estimated to grow from USD 30.34 billion in 2026 to reach USD 39.32 billion by 2031, at a CAGR of 5.32% during the forecast period (2026-2031). Sector momentum reflects emergency-department overcrowding, partnerships between retail chains and health-systems, and rapid digital scheduling uptake, all of which steer patients toward lower-cost same-day care. Corporate chains keep scale advantages through standardized clinical protocols, while hospital-owned facilities accelerate site openings to relieve inpatient bottlenecks and to tighten referral loops. Service-mix evolution is unmistakable: trauma care still attracts the largest visit volumes, yet vaccination and preventive offerings now grow fastest as operators reposition sites as frontline primary-care hubs. Geographic reach broadens as operators pivot to rural communities where 57 million residents lack adequate access to hospital-based services. Heightened consolidation, expanding advanced-practice provider (APP) staffing needs, and reimbursement pressure from value-based insurance plans will shape competitive dynamics through 2030.
Key Report Takeaways
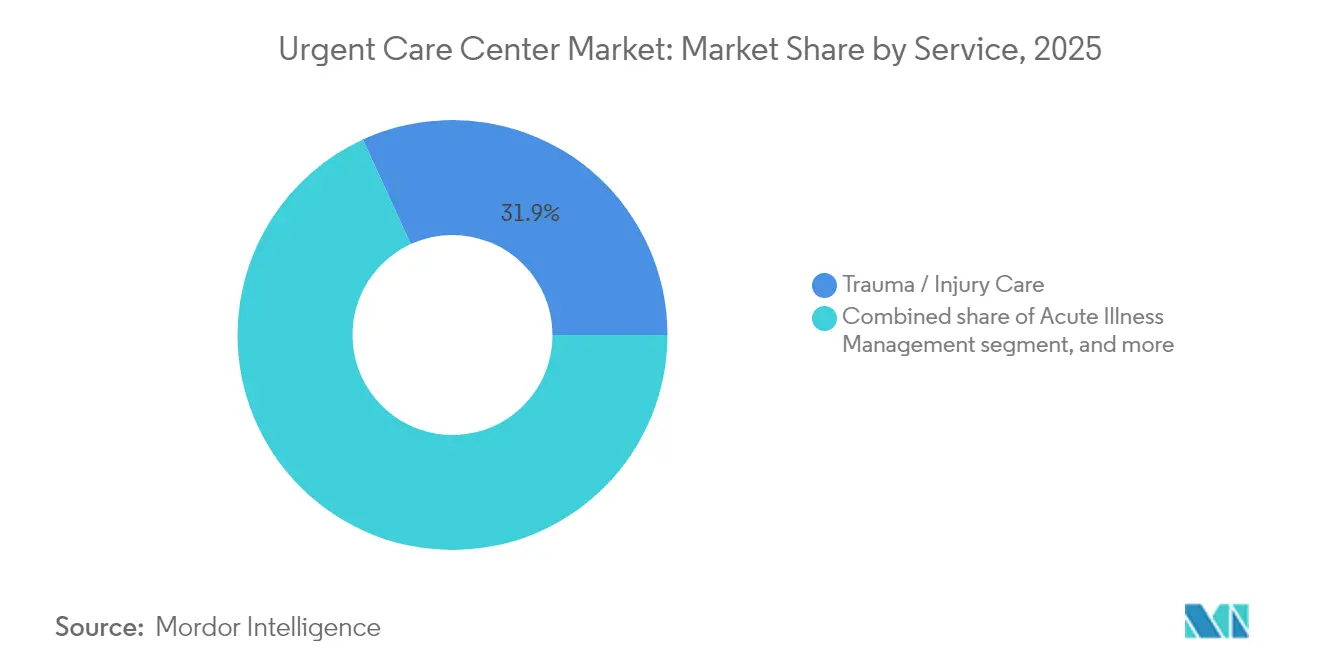
- By service, trauma and injury care led with 31.85% urgent care center market share in 2025, whereas vaccination and preventive services are forecast to expand at a 6.86% CAGR through 2031.
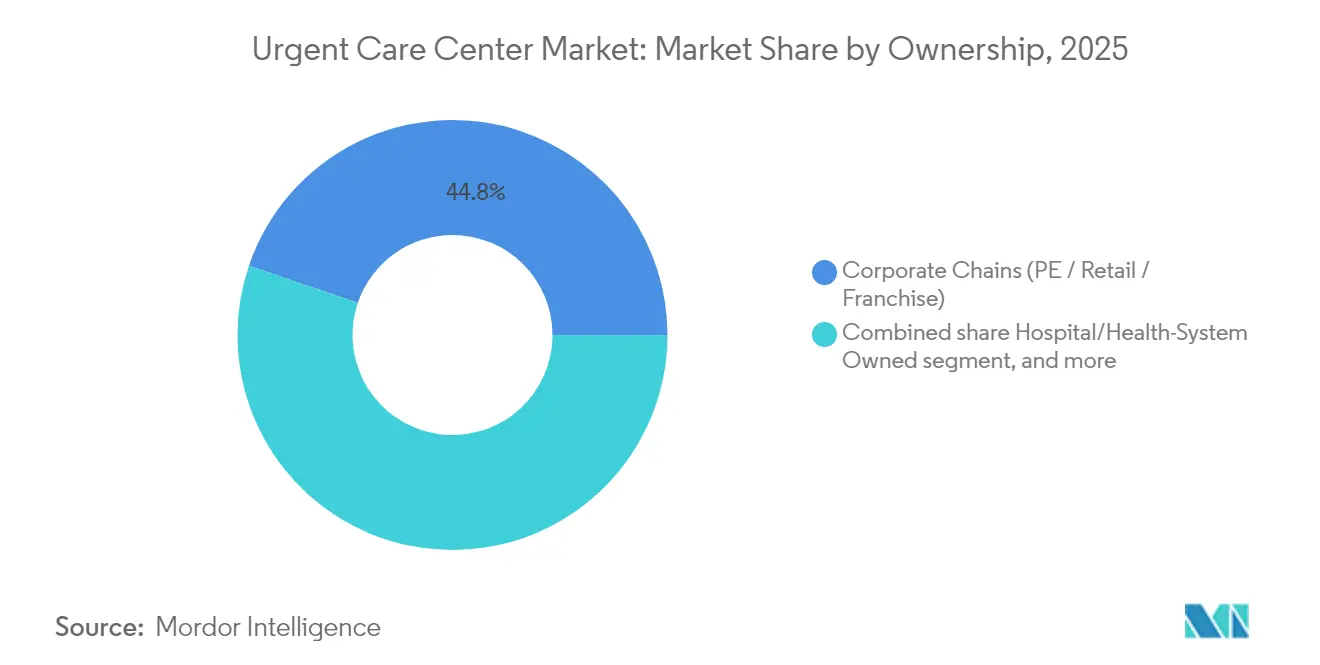
- By ownership, corporate chains captured 44.78% of the urgent care center market in 2025, and hospital-owned facilities are advancing at a 7.21% CAGR to 2031.
- By age group, adults aged 18–64 years made up 35.12% of 2025 patient volumes, while pediatric visits are projected to rise at a 6.74% CAGR to 2031.
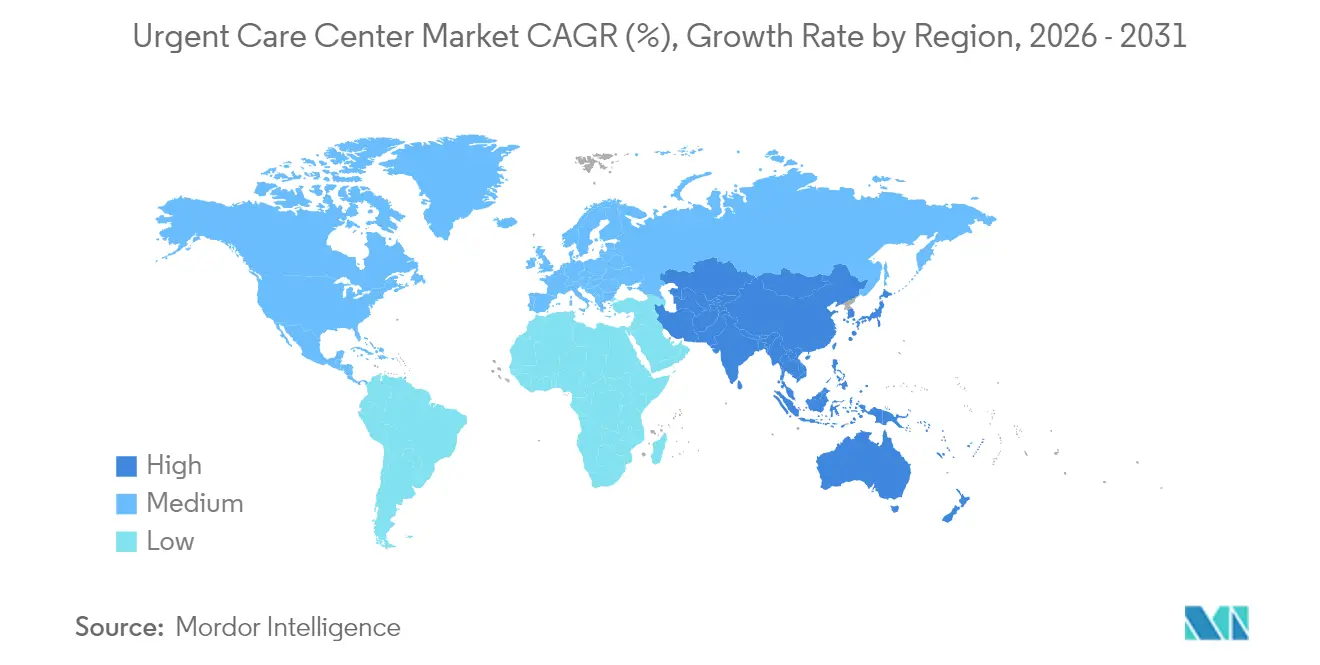
- By geography, North America retained 47.90% revenue share in 2025, whereas Asia-Pacific is anticipated to log the quickest 6.29% CAGR during the forecast window.
Note: Market size and forecast figures in this report are generated using Mordor Intelligence’s proprietary estimation framework, updated with the latest available data and insights as of 2026.
Market Trends and Insights
Drivers Impact Analysis of Urgent Care Center Market*
| Driver | % Impact on CAGR Forecast | Geographic Relevance | Impact Timeline |
|---|---|---|---|
| Emergency-department overcrowding shifting non-critical cases to urgent care | +1.8% | Global; most acute in North America | Short term (≤2 years) |
| Partnerships between retail chains & health systems accelerating site roll-outs | +1.2% | North America & Europe; emerging in APAC | Medium term (2–4 years) |
| Digital scheduling & tele-urgent add-ons enhancing patient capture rates | +0.9% | Global; led by developed markets | Medium term (2–4 years) |
| Active-lifestyle injuries among Millennials & Gen-Z populations | +0.7% | Global; concentrated in urban centers | Long term (≥4 years) |
| Expansion of value-based & high-deductible insurance plans favoring low-cost settings | +0.6% | North America; gaining traction in Europe | Medium term (2–4 years) |
| Aging populations seeking same-day care for chronic exacerbations | +0.3% | Global; most pronounced in developed markets | Long term (≥4 years) |
| Source: Mordor Intelligence | |||
Emergency-Department Overcrowding Shifting Non-Critical Cases to Urgent Care
Median emergency-department wait times have risen 16% since 2014, funneling lower-acuity patients toward urgent care centers that can deliver equivalent treatment at lower cost[1]. RAND research estimates that one-third of non-urgent ED encounters could be redirected, saving up to USD 4.4 billion annually. Hospitals consequently embed urgent care sites inside integrated delivery networks, transforming former competitors into throughput partners for ED de-congestion. Payer push toward site-of-care optimization reinforces the shift, as value-based contracts penalize unnecessary ED utilization. Collectively these demand-side and payer-side forces lock in steady volume growth for the urgent care center market.
Digital Scheduling & Tele-Urgent Add-Ons Enhancing Patient Capture Rates
Artificial-intelligence engines orchestrate patient intake, slot utilization, and documentation. CityMD’s multi-year pact with Notable automates front-end tasks for nearly 200 clinics handling 4 million visits each year, coinciding with a 60% visit surge since 2019. Surveys show 55% of consumers now prefer digital channels and 74% rate appointment speed as decisive. Telehealth reached 39.3% adult utilization in 2022; 80.5% experienced no technical glitches and three-quarters deemed visit quality equal to in-person care[2]. “Tele-untethered” models remove virtual waiting rooms, with 76% of users favoring freedom to multitask and saving 55 minutes per session. Digital capacity therefore heightens patient throughput, lifts net promoter scores, and entrenches competitive differentiation inside the urgent care center market.
Active-Lifestyle Injuries Among Millennials & Gen Z Populations
Millennials are now in prime earning and recreation years, spurring demand for safe, convenient musculoskeletal care when sports or fitness injuries strike. Gen Z’s preference for mobile scheduling and transparent pricing dovetails with urgent care’s walk-in ethos. Gig-economy participation further nudges these cohorts toward urgent care sites because many hold high-deductible plans that penalize ED use. Operators respond by embedding point-of-care X-ray, on-site casting, and sports-medicine fellowships, reinforcing brand relevance in dense urban and affluent suburban catchments. The demographic pipe-line assures long-run growth and supports new specialty clinics inside the urgent care center market.
Expansion Of Value-Based & High-Deductible Insurance Plans Favoring Low-Cost Settings
U.S. enrollment in high-deductible plans surpassed 64 million lives in 2024, incentivizing patients to price-shop before choosing care venues. Urgent care encounters typically cost 10 times less than ED visits, meeting payer mandates to steer consumers to efficient sites. Medicare Advantage and commercial payers integrate site-of-service modifiers and shared-savings deals that reward urgent care pivoting, thereby lifting visit volumes and reimbursement certainty for scale players. Europe’s shift toward diagnosis-related-group budgeting similarly prompts public payers to pilot urgent care models, extending global tailwinds for the urgent care center market.
Restraints Impact Analysis of Urgent Care Center Market*
| Restraints Impact Analysis | (~) % Impact on CAGR Forecast | Geographic Relevance | Impact Timeline |
|---|---|---|---|
| Physician & advanced-practitioner shortages in rural and suburban catchments | −1.4% | Global; acute in rural North America | Short term (≤2 years) |
| State-level certificate-of-need / licensing hurdles (US, EU select markets) | −0.8% | North America; select European markets | Medium term (2–4 years) |
| Growing competition from telehealth-only and retail pharmacy clinics | −0.5% | Global; strongest in developed markets | Medium term (2–4 years) |
| Reimbursement ambiguity in emerging markets limiting ROI | −0.4% | Latin America, parts of APAC & Africa | Long term (≥4 years) |
| Source: Mordor Intelligence | |||
Physician & Advanced-Practitioner Shortages in Rural and Suburban Catchments
Thirteen percent of Americans live in primary-care shortage areas, and the shortfall may swell to 49,000 physicians by 2030. Employing APPs mitigates gaps—63% of medical groups intend to add new APP roles in 2025—yet formal onboarding exists in only 70% of ambulatory sites. Rural EDs lack emergency physicians in 27% of counties, pushing urgent care centers to stretch clinician coverage with leaner staffing ratios. Productivity rises when APP penetration deepens, but competition for talent inflates labor costs and may slow clinic roll-outs, tempering the urgent care center market CAGR.
State-Level Certificate-Of-Need / Licensing Hurdles (US, EU Select Markets)
Thirty-five U.S. states and Washington D.C. still require certificate-of-need (CON) approval for major ambulatory investments, delaying builds by 12–24 months and imposing legal fees that deter smaller entrants[3]. Reforms are uneven: North Carolina and South Carolina repealed key provisions, whereas Tennessee will retain selective oversight until 2027. Meanwhile, anti-kickback and quality-reporting mandates persist, obliging multistate operators to navigate patchwork compliance regimes that elongate ramp-up timelines inside the urgent care center market.
*Our forecasts treat driver/restraint impacts as directional, not additive. The impact forecasts reflect baseline growth, mix effects, and variable interactions.
Urgent Care Center Market Segment Analysis
By Service:
Trauma Care Dominance amid Preventive GrowthTrauma and injury care accounted for 31.85% of 2025 revenue, underscoring an enduring core at the urgent care center market’s clinical mix. On-site X-ray, fracture stabilization, and laceration repair divert patients from EDs and offer favorable payer economics. Acute illness management ranks second, handling respiratory and gastrointestinal conditions with rapid throughput. Diagnostic advances now include ultrasound and advanced imaging, raising average ticket size.
Vaccination and preventive offerings expand fastest at a 6.86% CAGR, reshaping centers from episodic venues to comprehensive health destinations. Mass immunization campaigns and travel medicine bundles fill scheduling valleys, while AI-driven triage engines support standardized care. A Cedars-Sinai study found virtual urgent care algorithms outscored physicians for treatment appropriateness on common complaints, validating decision-support adoption. Preventive momentum creates spillover demand for chronic-condition screening and lifestyle coaching, elevating cross-sell potential within the urgent care center market size at both national and local levels.

By Ownership:
Corporate Chains Lead while Health Systems AccelerateCorporate operators held 44.78% of the urgent care center market in 2025, leveraging centralized procurement and uniform EHR systems to maintain cost efficiencies. Their standardized branding and digital front doors ensure strong consumer recall and rapid check-in, crucial for price-sensitive patients.
Hospital-owned sites, however, chart the briskest 7.21% CAGR to 2031 as health-systems acquire locations to stem ED overflow and tighten specialist pipelines. Deals such as Ardent Health’s purchase of 18 NextCare clinics and UPMC’s partnership with GoHealth highlight acquisition appetite. Private-equity sponsors steer further consolidation, with integration initiatives boosting collection rates 12% and trimming accounts-receivable days 39% post-close. Such financial engineering accelerates roll-outs but heightens exit-cycle risk if multiples compress.
By Age Group:
Adult Volumes Anchor, Pediatric Visits SurgeAdults aged 18–64 composed 35.12% of 2025 footfall, benefiting from employer insurance, sports injuries, and remote-work flexibility that favors quick walk-in care. This demographic’s digital savviness supports adoption of scheduling apps and virtual queueing, sustaining baseline traffic for the urgent care center market.
Pediatric volumes grow fastest at a 6.74% CAGR as parents flee ED waits. Youth utilization jumped from 21.6% to 28.4% of children between 2021–2022, with adolescents 12–17 leading at 30.3%. Centers invest in child-friendly décor, behavioral-health consultation rooms, and sports physicals to monetize seasonal peaks. Geriatric engagement lags, tied to complex comorbidities, yet telehealth bridges gaps and promises future uplift once mobility barriers lessen.
Geography Analysis
North America Urgent Care Center Market
North America captured 47.90% of 2025 revenue, underpinned by insurance mechanisms that reimburse out-of-hospital encounters and by well-established clinic chains. Consolidators continue to target suburban infill opportunities while pivoting toward rural counties where 57 million residents remain underserved. CON reform across the Carolinas, plus Tennessee’s phased deregulation, eases expansion and invites cross-state operator entries, fortifying the urgent care center market size within the region.
APAC Urgent Care Center Market
Asia-Pacific provides the sharpest 6.29% CAGR outlook. China’s aging demographic, India’s 275-million-plus eSanjeevani consultations, and Japan’s robust telemedicine adoption validate urgent care viability. Public-private partnerships blend physical clinics with digital triage kiosks located in transit hubs, yielding high-volume low-acuity throughput models that mirror U.S. suburban prototypes.
EMEA and South America Urgent Care Center Market
Europe, Middle East & Africa, and South America log moderate growth. European universal-care systems restrict private pay volumes, yet cross-border telehealth and expatriate communities sustain niche demand. Gulf nations deploy urgent care inside medical-tourism corridors, while Brazil and Colombia flirt with hybrid ED-urgent models inside private hospitals. Currency volatility and regulatory opacity temper speed of scale-out but open localized franchise pathways for risk-tolerant investors.
Competitive Landscape
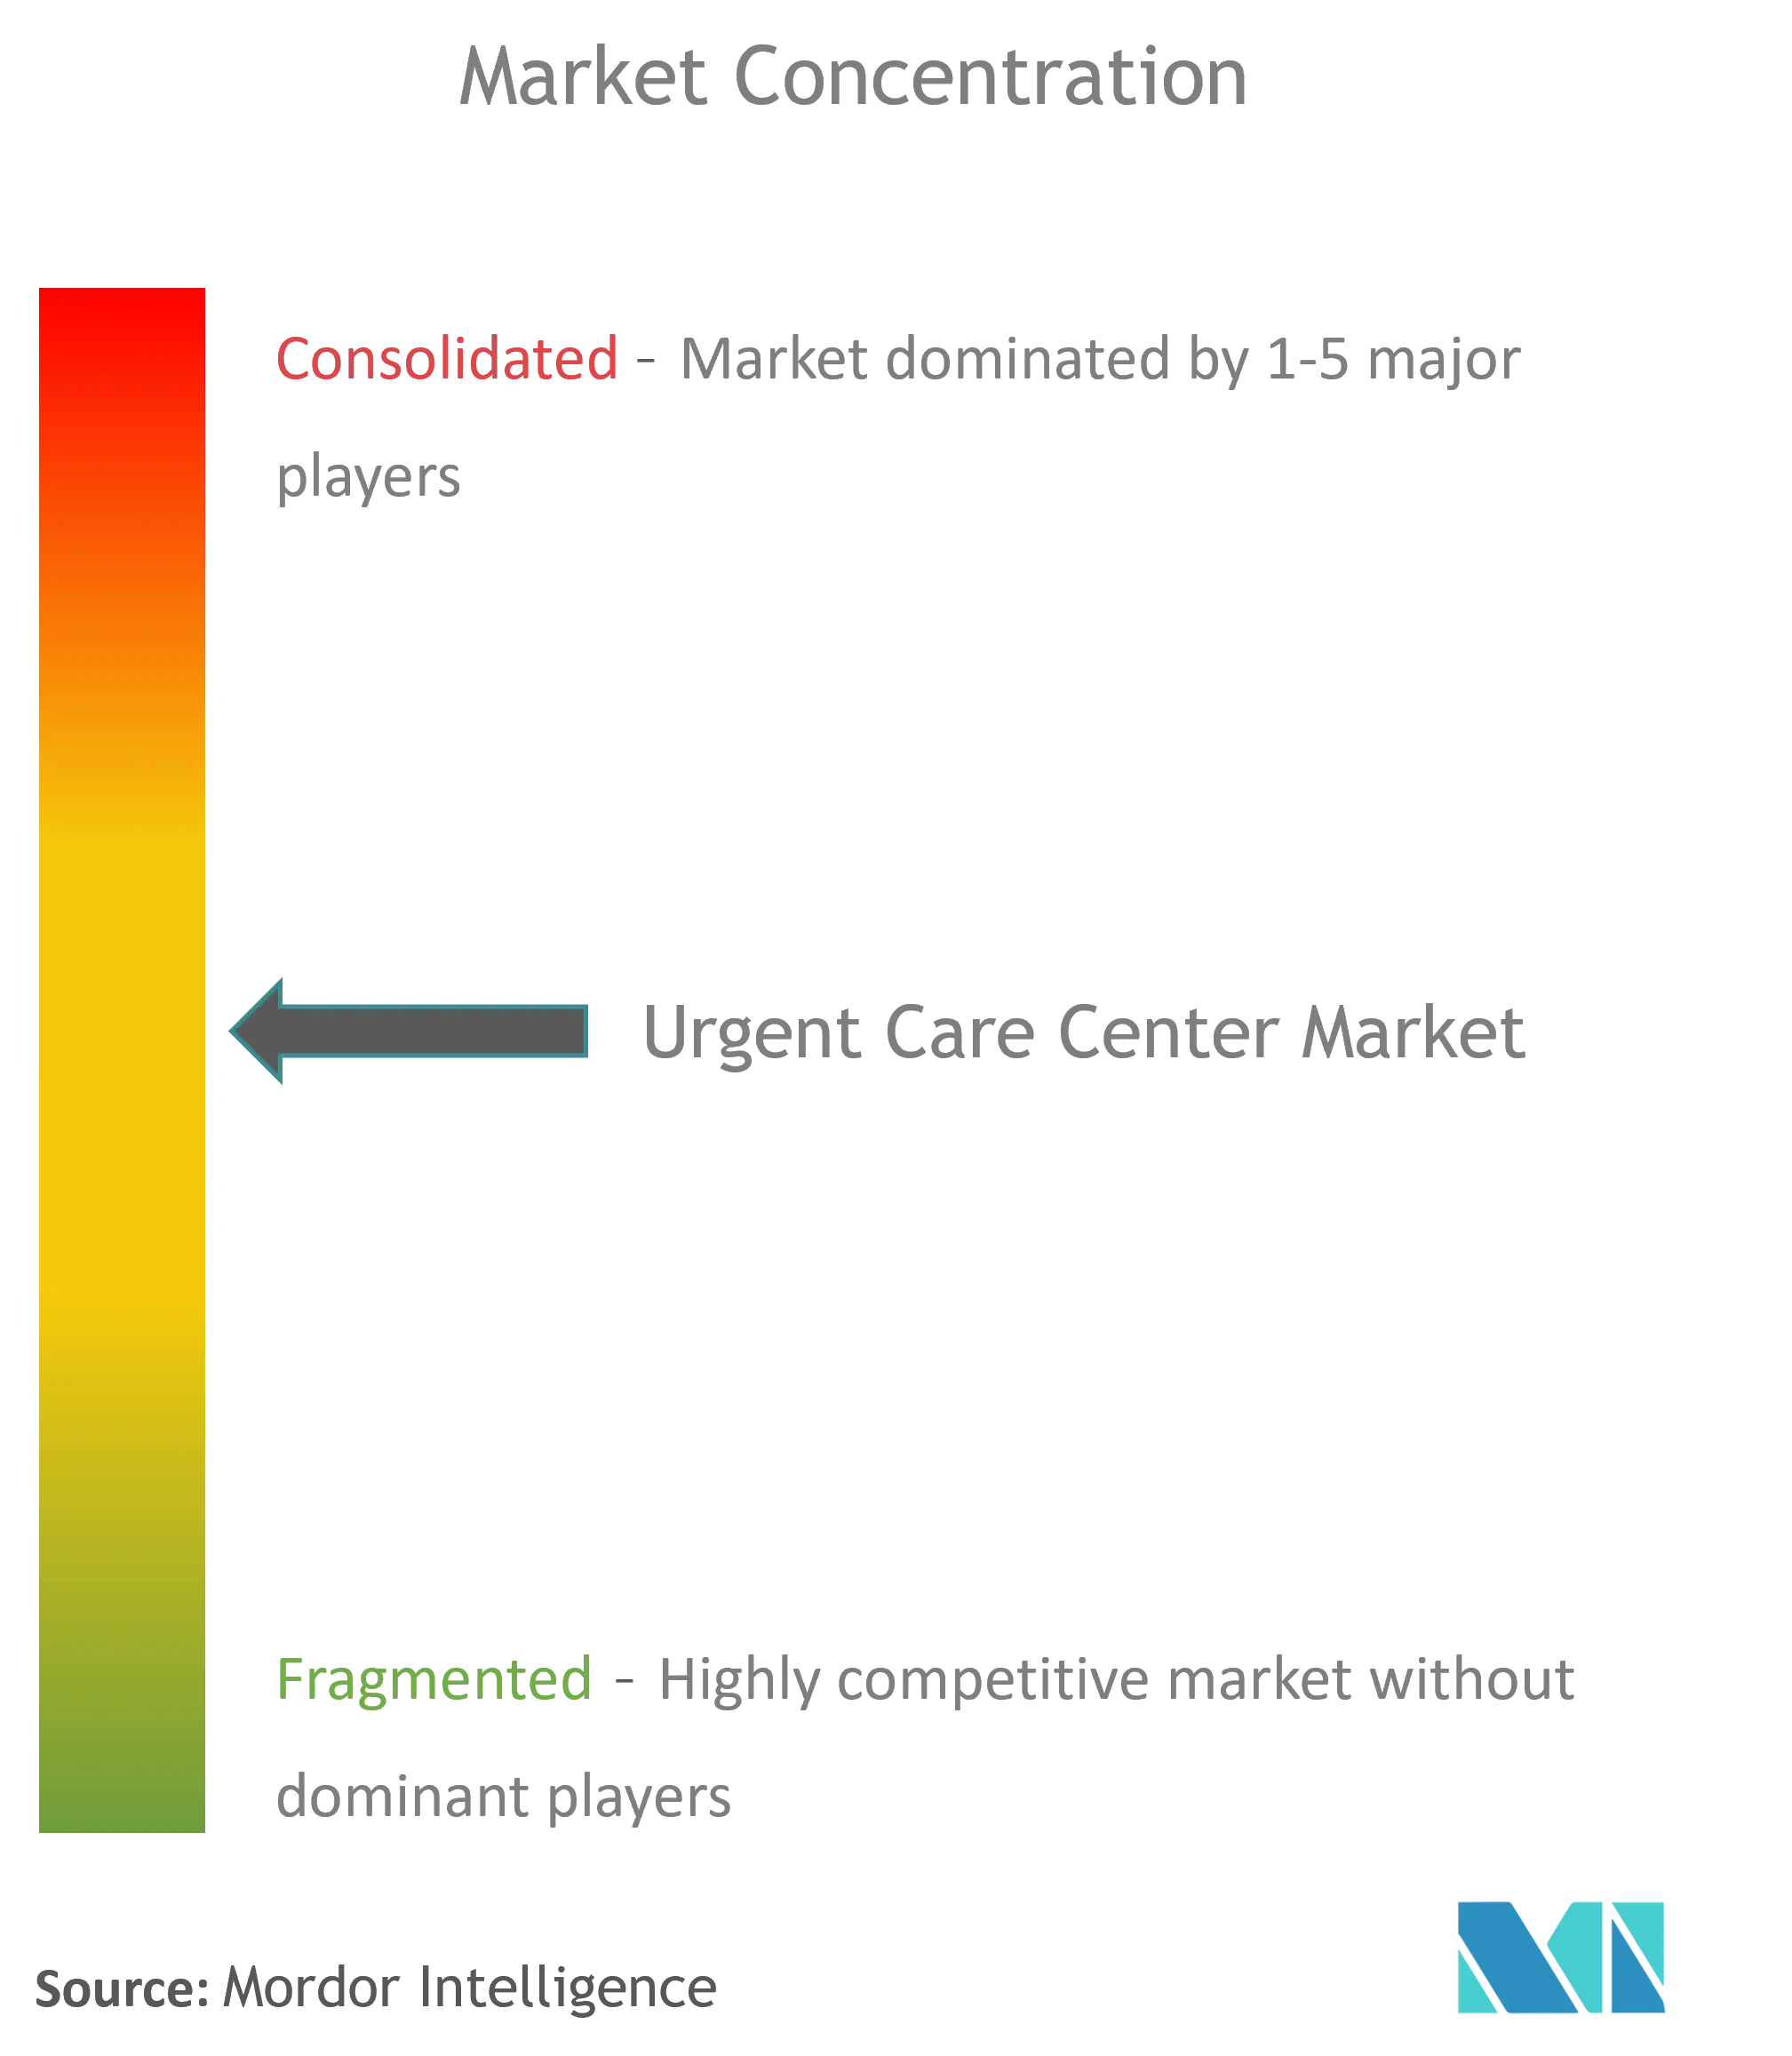
Industry fragmentation persists yet consolidation quickens. CVS Health commands the largest branded footprint through 1,100+ MinuteClinics and 49 health-system alliances. UnitedHealth’s Optum divested selected MedExpress sites under antitrust scrutiny, demonstrating regulatory brake capacity. CityMD wields AI to trim administrative costs and sustain 4 million annual visits, illustrating technology-enabled operating leverage.
Rural white-space represents the next battleground. Chains deploy mobile vans to test viability before committing brick-and-mortar, a tactic that slashes capital risk. Occupational health, sports-medicine, and hybrid ED-urgent models serve as adjacency wedges. Private-equity–backed groups finance multi-state roll-ups, optimizing revenue-cycle systems and staffing mixes for EBITDA lift ahead of exit. Yet high interest-rate environments may elongate holding periods, rewarding operators with durable cash-flow profiles.
Emergent moats revolve around digital front ends, unified EHRs, and consumer-facing apps that integrate with insurer directories. APP shortages could throttle growth; operators now sponsor tuition and residency pipelines to lock talent. Market incumbents unable to meet rising patient experience benchmarks risk volume leakage to digitally fluent rivals, propelling a Darwinian wave across the urgent care center market.
Urgent Care Center Industry Leaders
-
NextCare Holdings, Inc.
-
Select Medical Holdings (Concentra, Inc.)
-
UnitedHealth Group (MedExpress )
-
HCA Healthcare (CareNow / CareSpot)
-
CVS Health (MinuteClinic)
- *Disclaimer: Major Players sorted in no particular order
Urgent Care Center Market Companies Covered in this Report
- CVS Health
- Select Medical
- UnitedHealth Group (MedExpress)
- HCA Healthcare (CareNow / CareSpot)
- NextCare Holdings
- GoHealth Urgent Care
- CityMD / Summit Health
- American Family Care
- Carbon Health
- Patient First
- FastMed Urgent Care
- Dignity Health (US HealthWorks)
- Tenet Healthcare (United Surgical Partners)
- Adeptus Health
- Indigo Health (MultiCare)
- Urgent Care Group
- HealthBay (UAE)
- Virgin Care (UK)
Market Opportunities and Future Outlook
White-space expansion continues to focus on persistent access gaps and on capturing lower-acuity demand that currently shifts to hospital emergency departments, particularly in rural and exurban catchments highlighted by the report (57 million residents lacking adequate access to hospital-based services). Operators are also broadening the visit mix beyond episodic injury and acute illness toward vaccination and preventive services (the fastest-growing service line in the report). These additions help smooth seasonality and support repeat utilization.
At the same time, health-system ownership momentum and retail and payer steering are reinforcing urgent care as a front door into integrated networks, which keeps joint ventures and acquisitions central to scaling. On the operations side, the most visible near-term opportunity is automation and interoperability that reduce administrative load and improve throughput. CityMDs multi-year automation partnership with Notable (covering nearly 200 clinics and tied to high annual visit volumes in the report context) shows how digital intake and scheduling infrastructure has become a practical competitive requirement. Platform vendors are also extending revenue-cycle and compliance automation, including Experitys July 2026 acquisition of Exdion Healthcare to integrate AI-driven coding and compliance tools into its on-demand care software stack, which supports multi-site standardization for urgent care operators. Portfolio optimization is another recurring theme, with operators pruning lower-volume sites to redeploy capital into higher-performing locations, while unified EMR and practice-management platforms provide the data backbone needed for payer contracting, referral-loop management, and consistent patient experience across networks.
Recent Industry Developments in Urgent Care Center Market
- January 2026: Concentra Group Holdings Parent, Inc. released preliminary 2025 results and set 2026 revenue guidance of USD 2.25-2.35 billion. The update reinforced Concentras standalone operating cadence following its separation, and it signaled continued investment capacity for its occupational health and on-demand clinic footprint.
- August 2025: UPMC and GoHealth Urgent Care unveiled 81 UPMC-GoHealth Urgent Care centers across Pennsylvania and West Virginia, integrating former MedExpress and UPMC sites into the joint venture network. The rollout increased regional scale and strengthened health-system anchored urgent care as a referral and access channel.
- November 2024: Select Medical completed the spin-off of Concentra Group Holdings Parent, Inc., distributing about 81.7% of Concentra shares to Select Medical stockholders. The transaction created a more independent strategic path for Concentra, sharpening focus on occupational health and expanding its options for partnerships and capital allocation.
Urgent Care Center Market Report Scope and Research Methodology
Market Definition and Coverage
For this study, the urgent care center market means revenue earned from walk-in, non-emergency outpatient care delivered at urgent care facilities, including related visits, tests, and common on-site procedures that are billed through cash-pay or insurers.
Scope exclusions: We exclude hospital emergency department services, inpatient admissions, and pure telehealth-only providers that do not operate urgent care clinics.
Segments Covered in This Report
- By Service
- Trauma / Injury Care
- Acute Illness Management
- Vaccination & Preventive Services
- Diagnostic & Screening Services
- Other Services
- By Ownership
- Corporate Chains (PE / Retail / Franchise)
- Hospital / Health-System Owned
- Physician Group Owned
- Other Ownerships
- By Age Group
- Pediatrics (0-17 yrs)
- Adults (18-64 yrs)
- Geriatrics (65+ yrs)
- Geography
- North America
- United States
- Canada
- Mexico
- Europe
- Germany
- United Kingdom
- France
- Italy
- Spain
- Rest of Europe
- Asia-Pacific
- China
- Japan
- India
- Australia
- South Korea
- Rest of Asia-Pacific
- Middle East & Africa
- GCC
- South Africa
- Rest of Middle East & Africa
- South America
- Brazil
- Argentina
- Rest of South America
- North America
Data Sources, Market Sizing, and Validation
Desk Research
Desk research starts with public healthcare utilization and cost signals that help anchor the demand pool and pricing reality. We typically pull from the CDC (including NCHS), CMS, and the U.S. Bureau of Labor Statistics for wage and inflation context. We also use OECD health statistics to sanity check cross-country patterns where comparable data exists.
To understand how care settings are regulated and how outpatient reporting is handled, we review government health department releases and selected peer-reviewed papers on urgent care utilization and non-emergency pathways. We also screen company filings, investor presentations, and reputable press coverage to map operator footprints and expansion patterns. In a few places, a paid subscription for company financials and a patent database are used to speed up fact checks, but the model is not dependent on any single paid source. These sources are illustrative only, and many other public references were used to collect, verify, and clarify data points.
Primary Interviews and Surveys
Primary work is used to convert the desk-view into usable market math, especially where utilization and pricing differ by country and payer mix. We speak with urgent care operators, clinic network executives, payor-side specialists, and suppliers supporting diagnostics and clinic operations. We also cover major regions so assumptions are not anchored to a single health system structure.
Distribution of primary research fieldwork respondents
| Company type | Respondent position | Region |
|---|---|---|
| Top tier: 31% | CXOs: 14% | APAC: 48% |
| Mid tier: 51% | Functional/Unit leaders: 28% | EMEA: 29% |
| Smaller Players: 18% | Managers: 58% | Americas: 23% |
Market-Sizing & Forecasting
Sizing begins with a top-down build where outpatient demand indicators are converted into urgent care addressable visits, then translated into revenue using realistic pricing per visit and service mix. In practice, the model uses variables such as urgent care visit volumes per clinic, clinic counts and opening cadence, average revenue per visit (by payer type), share of visits that include diagnostic testing, and staffing and operating-hour patterns that influence throughput.
Once the total is formed, we corroborate it with selective bottom-up approximations, such as rolling up a sample of operator revenues, using channel checks on typical visit pricing bands, and applying sampled volume per site to mapped clinic footprints in key countries. Where direct revenue disclosure is limited, gaps are handled using conservative ranges based on interview-derived utilization and publicly visible clinic footprints, then narrowed through consistency checks.
Forecasting is run using scenario analysis supported by a simple multivariate regression layer, where demand growth is linked to population growth, insurance coverage direction, non-emergency diversion trends, and clinic expansion plans reported by operators. Assumptions are kept explicit so they can be re-run when a new reimbursement rule, labor cost shift, or clinic rollout pattern is observed.
Data Validation & Update Cycle
Validation is done through step-by-step cross-checks, not a single pass. Outputs are compared against independent signals like reported clinic counts, implied visits per site, and realistic revenue per visit ranges, and any sharp jumps are traced back to the exact input that created them.
Before sign-off, a second analyst reviews the logic, units, and year alignment, and follow-up outreach is triggered when interview feedback conflicts with the desk trend. The report is refreshed annually, and interim updates are made when material events occur, such as reimbursement changes or major clinic network consolidation. Right before delivery, a final review pass is completed so clients receive the most current view available.
Mordor Intelligence's Urgent Care Center Market Estimate Compared With Other Published Estimates
It is normal to see different market sizes for urgent care centers because publishers do not always count the same set of services, geographies, and revenue lines, and they also use different base years and price assumptions. The spread is usually explained by what is treated as an urgent care visit, how diagnostic and ancillary services are counted, and how fast revenue per visit is assumed to move over time.
Some published figures broaden scope by blending adjacent ambulatory settings, or they use aggressive visit growth and a fast ASP ramp without enough checks against clinic throughput. In this study, the split mainly comes from scope and year alignment, and the estimate is tied to Mordor Intelligence's approach of counting only revenue tied to care delivered in urgent care clinics (including common on-site tests and procedures), with the pricing progression linked to payer mix and inflation timing.
Benchmark comparison
| Source | Market Size | Gaps in Research Methodology |
|---|---|---|
| Mordor Intelligence | USD 28.81 B (2025) | |
| Industry Publisher A | USD 27.05 B (2025) | Uses a revenue definition that can exclude parts of on-site ancillary services and applies a different historic-to-forecast splice, which lowers the 2025 total even when the global geography is similar. |
| Industry Publisher B | USD 27.30 B (2024) | Anchors the model on a 2024 base with a service and ownership segmentation that may under-capture pricing differences by payer mix and clinic throughput, so year-to-year comparability can look tighter than it is. |
The table shows that most of the variance is not about demand direction, but about what revenues are treated as in-scope and how the base year is mapped to the forecast. By keeping the visit-driven logic transparent and then re-checking it with operator realities like sites, throughput, and pricing bands, the resulting market value stays traceable to inputs that can be revalidated over time.
Key Questions Answered in the Report
What is the current value of the urgent care center market?
The urgent care center market size is USD 30.34 billion in 2026 and is forecast to reach USD 39.32 billion by 2031.
How fast is the urgent care center market expected to grow?
The market is projected to expand at a 5.32% CAGR between 2026 and 2031.
Which service segment leads the urgent care center market?
Trauma and injury care held 31.85% of 2025 revenue, making it the largest service segment.
Which ownership model is growing the fastest?
Hospital-owned urgent care facilities are advancing at a 7.21% CAGR through 2031.
Why are retail chains key to urgent care expansion?
Retail-health partnerships combine accessible storefronts with health-system clinical expertise, accelerating site roll-outs and patient acquisition.
Which region offers the highest growth potential?
Asia-Pacific shows the fastest 6.29% CAGR outlook, thanks to aging populations and significant digital-health investments.