
Market Overview
| Study Period | 2020 - 2031 |
|---|---|
| Market Size (2026) | USD 69.18 Billion |
| Market Size (2031) | USD 89.36 Billion |
| Growth Rate (2026 - 2031) | 5.25% CAGR |
| Fastest Growing Market | Asia Pacific |
| Largest Market | North America |
| Market Concentration | Low |
Major Players *Disclaimer: Major Players sorted in no particular order Image © Mordor Intelligence. Reuse requires attribution under CC BY 4.0. | |
Upholstered Furniture Market Analysis by Mordor Intelligence
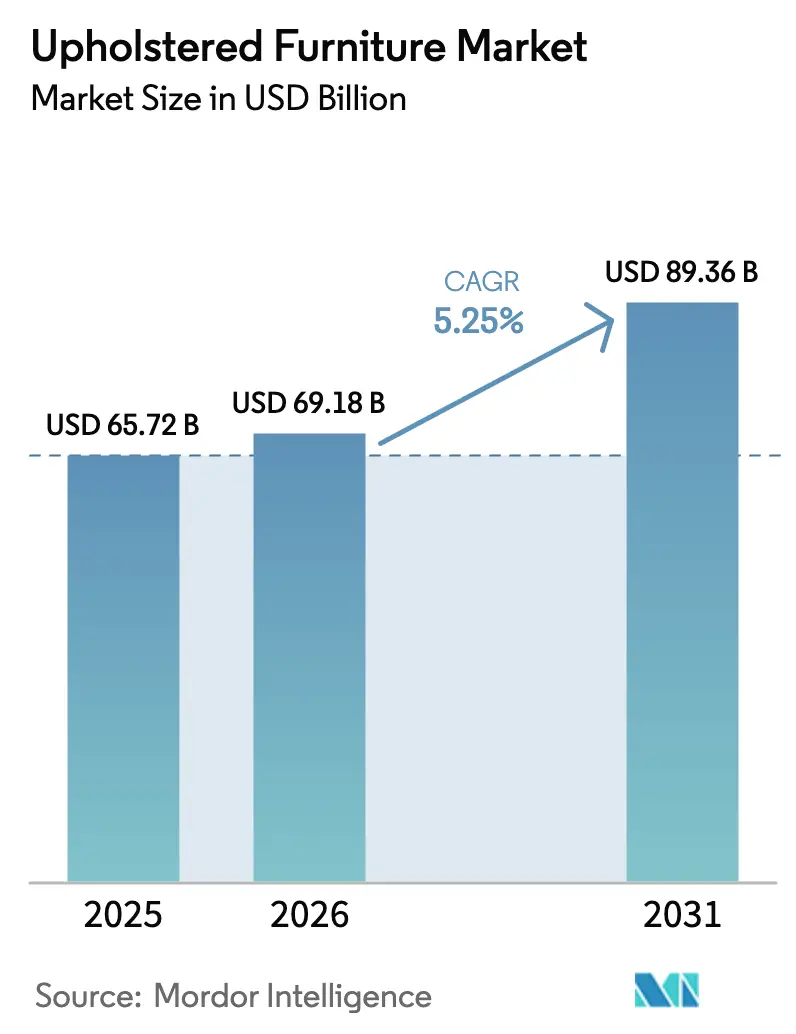
The upholstered furniture market size is expected to increase from USD 65.72 billion in 2025 to USD 69.18 billion in 2026 and reach USD 89.36 billion by 2031, growing at a CAGR of 5.25% over 2026-2031. Growth is driven by urbanization in emerging economies and by the adoption of omnichannel retail, supported by digital visualization tools. Demand from hospitality and hybrid office setups, emphasizing ergonomic seating and flexible layouts, is a key factor. Consumers prioritize comfort, durability, and sustainability, with eco-certified textiles influencing purchase decisions. Margin pressures driven by feedstock volatility, particularly in polyurethane foam, underscore the need for agile procurement and lean supply chains. EU regulations, including deforestation rules and circularity mandates, are shaping product design, sourcing, and traceability, as well as after-sales and end-of-life strategies. North America holds the largest market share due to established infrastructure, while Asia-Pacific is the fastest-growing region, driven by rising domestic consumption and strong local manufacturing. Evolving preferences, regulatory compliance, and investments in sustainable, flexible solutions sustain growth.
Key Report Takeaways
- By product, sofas accounted for 31.37% of the upholstered furniture market share in 2025, while chairs are projected to grow at a CAGR of 7.26% through 2031.
- By material, fabric held 59.33% of the market share in 2025, while leather materials are projected to grow at a CAGR of 5.53% through 2031.
- By price range, the mid-range tier accounted for 51.39% of market share in 2025, while premium offerings are projected to grow at a CAGR of 6.16% through 2031.
- By end user, residential applications captured 72.33% of the market share in 2025, while commercial applications are projected to grow at a CAGR of 5.87% through 2031.
- By distribution channel, specialty stores accounted for 45.84% of the market share in 2025, while online channels are projected to grow at a CAGR of 7.28% through 2031.
- By geography, North America held 38.35% of the market share in 2025, while Asia-Pacific is projected to grow at a CAGR of 7.17% through 2031.
Note: Market size and forecast figures in this report are generated using Mordor Intelligence’s proprietary estimation framework, updated with the latest available data and insights as of January 2026.
Global Upholstered Furniture Market Trends and Insights
Drivers Impact Analysis*
| Drivers | (~) % Impact on CAGR Forecast | Geographic Relevance | Impact Timeline |
|---|---|---|---|
| Growing urban populations and demand for compact living solutions | +1.2% | Global, early gains in Asia-Pacific with spillover to North America urban cores | Medium term (2-4 years) |
| Rapid expansion of online retail channels | +0.9% | Global, strongest in North America and Europe, emerging in Asia-Pacific | Short term (≤ 2 years) |
| Surge in hospitality and commercial construction projects | +0.8% | Middle East and Africa, followed by Asia-Pacific and select European cities | Medium term (2-4 years) |
| Rising preference for sustainable and eco-certified textiles among millennials | +0.7% | Europe and North America, emerging in Latin America | Long term (≥ 4 years) |
| Adoption of hybrid work models and redesign of office lounge areas | +0.6% | North America and Europe corporate hubs, Asia-Pacific city centers | Short term (≤ 2 years) |
| Increasing integration of smart home features and connected furniture | +0.5% | North America and Europe early adopters, expanding in Asia-Pacific urban markets | Medium term (2-4 years) |
| Source: Mordor Intelligence | |||
Growing urban populations and demand for compact living solutions
Rapid urbanization is transforming how households use space for seating, sleeping, and storage, driving demand for modular and convertible upholstered furniture. Smaller apartments and dense city living are increasing the popularity of sofa beds, storage ottomans, and stackable lounge chairs that optimize utility without sacrificing comfort. Advanced engineering, including durable mechanisms and carefully calibrated foam densities, ensures long-lasting performance for dual-purpose furniture. Performance textiles with stain-resistant and antimicrobial properties help maintain hygiene and durability in high-use compact homes. Digital tools, such as room planners and augmented reality previews, reduce consumer hesitation by allowing easy customization of modules and fabrics. The United Nations projects that the share of the world’s population living in urban areas will rise from around 55% today to about 68% by mid-century, adding roughly 2.5 billion urban residents, mainly in Asia and Africa[1]United Nations Department of Economic and Social Affairs, World Population Projected to Live in Urban Areas by 2050, un.org/en/desa/68‑world‑population‑projected‑live‑urban‑areas‑2050‑says‑un. As living spaces shrink, multifunctional and space-efficient furniture becomes essential for urban households, reflecting changing lifestyle needs. Manufacturers and retailers are responding by designing furniture that combines adaptability, comfort, and long-term durability to meet this growing urban demand.
Rapid expansion of online retail channels
Digital transformation is reshaping the upholstered furniture market, allowing direct-to-consumer brands to scale without relying on traditional showrooms. Tools such as AR visualizers, 3D visualization, and room planners provide buyers with realistic views of proportions, colors, and layouts, boosting purchase confidence and reducing the need for multiple store visits. Faster delivery is achieved through vertically integrated inventories and regional fulfillment centers, appealing to new movers and time-sensitive buyers who value speed, selection, and price. Although online return rates for upholstery remain higher than in-store, brands are developing robust reverse logistics and resale or refurbishment channels to protect margins. Regulatory compliance, including data handling, product traceability, and labeling requirements in Europe, has become standard for online upholstery operations. Across regions, the momentum of online sales remains strong, as digital tools and configurators are now mainstream in the consumer’s furniture-buying journey. Retailers report 65% growth in online sales, 78% use digital tools to enhance customer experience, and 72% of executives expect digital channels to drive future revenue[2]ZipDo Education Reports, “Digital Transformation in the Furniture Industry Statistics,” ZipDo.co.
Surge in hospitality and commercial construction projects
Hotel investment and renovation cycles continue to refresh lounge and guestroom seating, which supports steady order flow for contract-grade sofas and chairs in the upholstered furniture market. Commercial buyers prioritize high abrasion resistance, reinforced joinery, and codified fire safety compliance so upholstery performs under heavier use and stricter operating standards in hospitality spaces. The design language skews warmer and more residential but must meet commercial durability, a combination that has raised demand for premium performance fabrics and advanced leather finishing. While input costs for foam and textiles have risen, suppliers are mitigating risk by diversifying sources, aligning specs with cost-stable alternatives, and improving forecasting to support renovation calendars. Asia-based production hubs remain central to scaling large orders quickly for global chains executing phased property upgrades. The compliance layer remains active across shipments, with documentation for materials, finishes, and safety performance embedded in supplier scorecards used in hospitality procurement.
Rising preference for sustainable and eco-certified textiles among millennials
Younger buyers and many institutional procurement teams now screen for environmental credentials, which directly boosts demand for eco-certified textiles and low-emission cushioning in the upholstered furniture market. Uptake includes organic cotton, linen, hemp, and Tencel, as well as recycled polyester fabrics that meet recognized testing and labeling standards for safe use in homes and public spaces. Performance fabrics have aligned with this shift, offering durability and stain resistance while moving toward PFAS-free chemistries to meet new corporate and regional policies. Foams with bio-based content reduce reliance on petroleum feedstocks and support compliance with indoor air quality targets when paired with low-VOC adhesives and finishes. European markets continue to set the pace for circularity expectations, with EPR mandates and product data transparency pushing brands to publish origin information and to establish take-back pathways for textiles. Given these buyer and policy signals, brands that publish credible traceability data and align materials to recognized standards are seeing clearer differentiation at the point of sale and in contract bids.
Restraints Impact Analysis*
| Restraints | (~) % Impact on CAGR Forecast | Geographic Relevance | Impact Timeline |
|---|---|---|---|
| Volatile foam and leather prices compress margins | -1.2% | Global, strongest in North America and Europe | Short term (≤ 2 years) |
| Rapid disposal of low-cost imports and waste scrutiny | -0.9% | Europe and North America, emerging in Asia-Pacific | Medium term (2-4 years) |
| Increasing regulatory pressure on sustainable sourcing | -0.7% | Europe and North America, gradually affecting Asia-Pacific | Medium term (2-4 years) |
| Rising competition from unorganized local furniture makers | -0.6% | Asia-Pacific and Latin America | Short term (≤ 2 years) |
| Source: Mordor Intelligence | |||
Volatile foam and leather prices compress margins
Polyurethane foam costs remain sensitive to energy prices and petrochemical inputs, which have driven pronounced swings in cushion costs and weighed on margins across the upholstered furniture market. The U.S. Producer Price Index for polyurethane foam formed and slab stock reached 159.343 in September 2025 on a 2005 base, underscoring sustained inflationary pressure that manufacturers have had to manage through sourcing and pricing actions[3]Board of Governors, “Producer Price Index by Commodity: Polyurethane Foam,” Federal Reserve Bank of St. Louis, fred.stlouisfed.org. Leather pricing has also been under strain due to hide availability and finishing constraints, while synthetic leather alternatives mirror petrochemical volatility. Tariff scenarios and origin shifts have added complexity, prompting many suppliers to review nearshoring options, buffer inventories, and hedging strategies to manage total landed costs and lead-time risk. Fire safety standards continue to limit foam substitution in regulated markets and reinforce the need for consistent quality documentation in shipments. The net effect has been higher working capital demands and tighter pricing windows, which have amplified the role of proactive category management in upholstery.
Rapid disposal of low-cost imports and waste scrutiny
Shorter furniture lifecycles, driven in part by low-cost imports and fast style turnover, have led to higher volumes of disposed seating in many markets, which increases regulatory focus on circularity in the upholstered furniture market. The European push to reduce textile and furniture waste is already resulting in new producer obligations for collection, sorting, and material recovery under EPR programs. France’s legal framework has reinforced measures prohibiting the destruction of unsold goods and favoring structured take-back schemes funded by producers and importers. The economics of reverse logistics for upholstery remain challenging due to collection, inspection, and separation costs, which is why the largest brands are piloting scale solutions in a handful of cities before broader rollout. Commercial buyers are embedding circularity criteria into RFPs, raising the threshold for vendors that have not aligned their storage and refurbishment capabilities with regulatory expectations. As these policies mature, disassembly-friendly designs, mono-material parts, and modular components are becoming useful enablers of recovery, repair, and reuse at scale.
*Our forecasts treat driver/restraint impacts as directional, not additive. The impact forecasts reflect baseline growth, mix effects, and variable interactions.
Segment Analysis
By Product: Sofas Anchor Demand, Chairs Propel Growth Through Ergonomic Innovation
Sofas captured 31.37% of the total product market size in 2025, reflecting hybrid living patterns and the growing adoption of convertible and modular designs that integrate storage, bed functions, and quick reconfiguration.
Chairs show the fastest projected growth, with a 7.26% CAGR through 2031, as corporate ergonomic mandates and home-office investments favor adjustable support solutions. Mesh-and-performance-fabric hybrids gained traction for ventilation and durability, aligning with residential and workspace trends. Smart features like posture sensing and app-based adjustments expanded from flagship models to scaled price points as procurement teams incorporated technology into specifications. The market for ergonomic upholstered seating with soft-touch fabrics is set to grow as hybrid work policies stabilize through the decade. Compliance frameworks such as ISO 9001 and OEKO-TEX Standard 100 anchor safety and quality claims, supporting consistent procurement globally.


By Material: Fabric Maintains Dominance, Leather Premiumizes Amid Tanning Innovations
Fabric held a 59.33% market share in 2025, supported by its variety of textures, colors, and performance chemistries that balance cost and durability. Contract and family-use segments prefer performance fabrics that are stain-resistant and bleach-cleanable, reducing maintenance costs in hospitality and workplace settings. Residential demand for velvet and bouclé textures is rising due to comfort and appearance, aligning with durable weave constructions from leading brands. Sustainability trends include recycled polyester, GOTS-certified organic cotton, and cellulosic fibers like Tencel, meeting strict testing and labeling norms. Digital fabric selection tools further support fabric's market share by simplifying customization and colorway decisions without in-person visits.
Leather is projected to grow at a 5.53% CAGR through 2031, driven by its premium appeal, which emphasizes patina, longevity, and status. Supply constraints and evolving finishing standards, including substance restrictions, are encouraging innovations in water-based and vegetable-derived processes while maintaining performance. Contract and high-end residential projects often blend materials, using leather for high-wear panels and performance fabrics for cushions to balance costs and upkeep. Soy-blend foams and low-VOC adhesives are increasingly paired with leather in higher-spec ranges to enhance indoor air quality. The industry aligns material choices with certifications and compliance standards, ensuring consistent signals for buyers and regulators during specification.
By Price Range: Mid-Range Balances Accessibility, Premium Surges On Customization
The mid-range tier held a 51.39% market share in 2025, catering to households seeking durable construction, customization, and competitive pricing.
The premium segment is forecast to grow at a 6.16% CAGR through 2031, driven by bespoke finishes, transparent sourcing, and integrated technology that justify higher prices. AI-enabled configurators, real-time fabric visualization, and live lead-time indicators streamline made-to-order processes, reducing cycle times. Brands adopt circular design principles, including component-level replacement and buy-back programs, to enhance product value and minimize disposal risks. Smart features like wireless charging and voice control expand use cases beyond casual seating, fitting well in premium living rooms and office lounges. The premium tier benefits from affluent residential demand and specification-driven hospitality and workplace projects requiring high performance and sophisticated design.
By End User: Residential Dominates, Commercial Accelerates Through Activity-Based Workspace
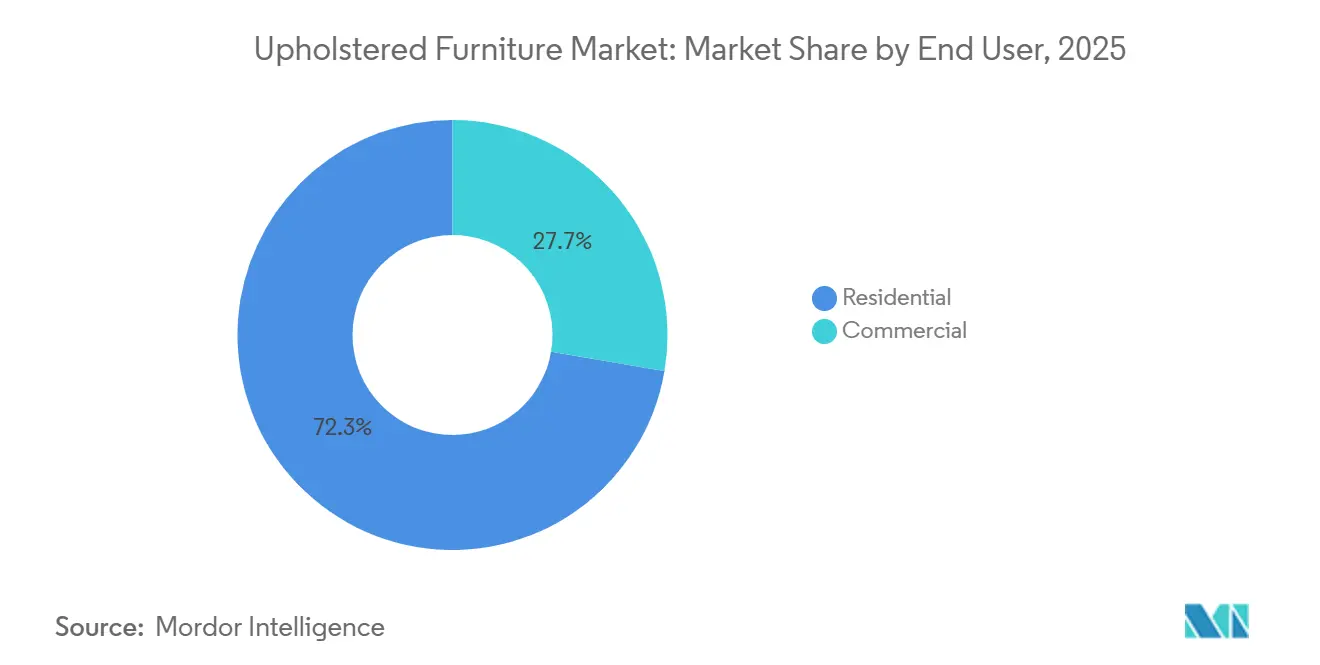
The residential segment accounted for 72.33% of the upholstered furniture market in 2025, driven by household formation and hybrid living that combines work and leisure in shared spaces.
Commercial applications, projected to grow at a CAGR of 5.87% through 2031, are gaining momentum as offices adopt activity-based work zones and the hospitality sector follows defined renovation cycles. Lounge seating, high-back acoustic furniture, and modular benches are central to collaboration zones, while power integration and charging surfaces are standard features. Corporate and institutional buyers prioritize performance fabrics rated for heavy use and compliance with safety and environmental standards. Office layouts are being redesigned to encourage purposeful presence, sustaining demand for soft seating in communal areas over assigned desks. These trends position lounge furniture as a core element of office design, driving growth in the upholstered furniture market.
By Distribution Channel: Specialty Stores Lead, Online Surges On AR-Enabled Conversion
Specialty stores held a 45.84% market share in 2025, offering tactile experiences that let customers assess comfort, fabrics, and colors before purchasing. Showrooms offer design consultations, same-day pickup for select items, and bundled services for higher-value purchases, such as full-room solutions. As omnichannel shopping becomes standard, retailers are investing in AR apps, virtual appointments, and store pickup to streamline selection and fulfillment. Physical retail's higher cost structure compared to online models drives investments in digital tools to improve conversion rates and customer lifetime value. For consumers preferring to test products like sofas or lounge chairs, showrooms remain essential in the upholstered furniture market.
Online channels are projected to grow at a 7.28% CAGR through 2031, supported by AR tools, improved content, and faster delivery, reducing barriers to purchasing upholstery without store visits. DTC brands streamline supply chains by eliminating intermediaries and leveraging regional inventory to deliver faster. As volumes grow, reverse logistics for returns and exchanges improve through consolidated hubs and refurbishment programs, protecting margins. European sellers are preparing for Digital Product Passports, influencing content architecture and labeling. The online upholstered furniture market benefits as visualization and configuration tools become standard in consumer research and corporate procurement.
Geography Analysis
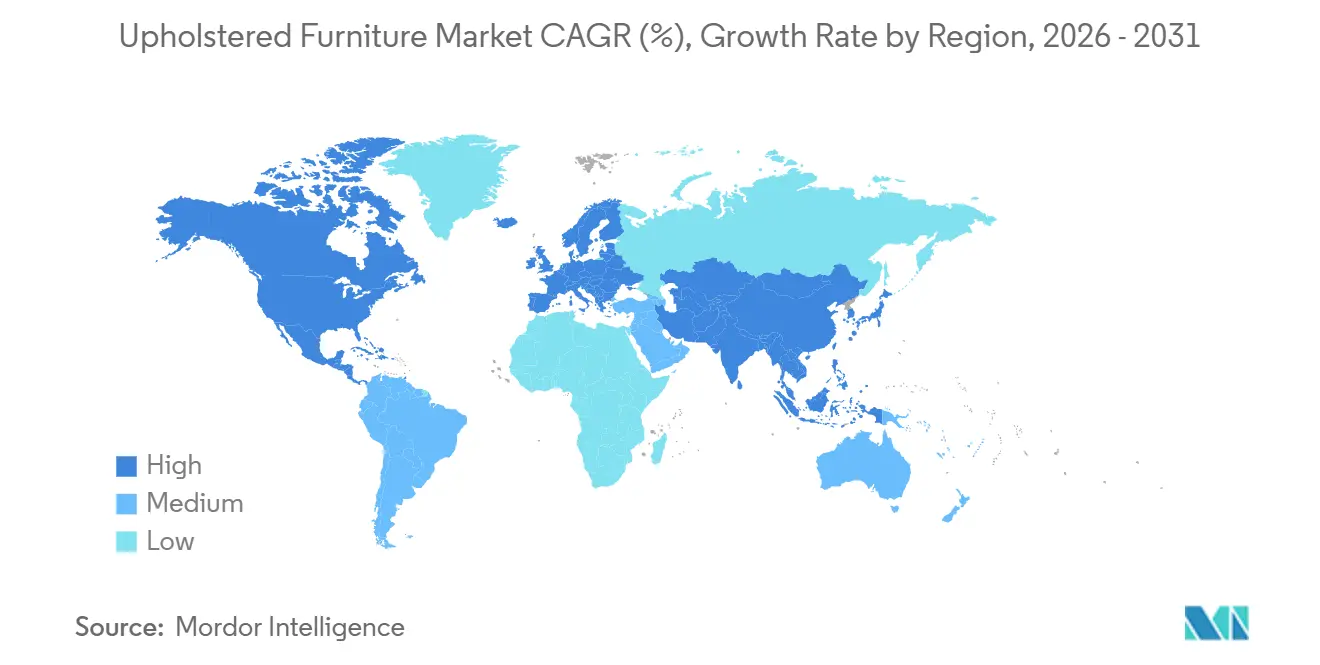
North America held a 38.35% share of the upholstered furniture market size in 2025, driven by higher disposable incomes, robust housing activity in growth corridors, and a well-established network of specialty and direct-to-consumer (DTC) players. Tariff mechanisms prompted suppliers to reassess sourcing strategies and domestic production capacity, complementing existing capabilities in upholstery hubs catering to residential and contract buyers. Labor constraints in upholstery impacted lead times, encouraging selective automation in cutting and sewing processes, while brands expanded apprenticeship programs to increase capacity. Corporate office refresh cycles and hospitality projects supported lounge seating demand as flexible spaces became standard layouts. The market also benefited from brand equity built on performance fabrics and durable finishes designed for family and public-space use cases.
Asia-Pacific is projected to grow at a 7.17% CAGR, supported by urbanization, rising incomes, and manufacturing capabilities in China, India, and Vietnam. Regional suppliers served both export and domestic markets, reducing lead times and offering a broader product range for mid-range and premium consumers. As domestic consumption grew, brands customized fabric and color options to align with local preferences while maintaining international specifications for export. Japan and South Korea experienced higher adoption of technology-integrated seating, while India’s growth was fueled by urban middle-class households creating flexible living spaces. The market catered to both contract and residential buyers as supply chains adapted to dual-track manufacturing for local and international customers.
Europe, South America, and the Middle East and Africa followed varied growth trajectories influenced by regulation, tourism, and construction cycles. Europe’s focus on circularity drove stricter requirements for reducing textile and furniture waste, with producer-funded take-back and recycling programs gaining momentum under Extended Producer Responsibility (EPR) measures. The EU Deforestation Regulation, effective from late 2024, mandated detailed sourcing data for wood and leather inputs, increasing due diligence costs for suppliers. In the Middle East, large-scale hospitality projects boosted demand for high-durability seating and upscale materials for public spaces, supporting contract upholstery orders. South America’s demand remained inconsistent due to currency fluctuations, but urban household formation sustained mid-range seating purchases where value and quality intersected. The market grew as suppliers aligned localized preferences with global compliance and performance standards.

Regulatory Landscape
Regulatory pressure for upholstered furniture is increasingly focused on fire safety performance, chemical management, and product transparency, which raises compliance requirements across major consuming regions. In the United Kingdom, the Office for Product Safety and Standards (OPSS) ran a final public consultation in March 2026 on comprehensive reform of the Furniture and Furnishings (Fire) (Safety) Regulations 1988. The proposals include new smoulder test requirements and removing mandatory open-flame testing. This follows the Furniture and Furnishings (Fire) (Safety) (Amendment) Regulations 2025 (SI 2025/531) made in April 2025, which removed display label requirements and updated enforcement time limits.
In the European Union, sustainability and traceability requirements are expanding through the Ecodesign for Sustainable Products Regulation (ESPR, Regulation 2024/1781). Furniture is designated a priority product category in the European Commission working plan for measures that can include Digital Product Passports and eco-design parameters. In the United States, federal flammability requirements and guidance sit within U.S. Consumer Product Safety Commission (CPSC) frameworks. This affects foam and cover-material choices and the documentation needed for compliance in residential and contract shipments, particularly for manufacturers operating across jurisdictions with different test methods and labeling expectations.
Value Chain Analysis
The upholstered furniture value chain runs from upstream inputs (frames, foam, textiles or leather, adhesives and finishes, and hardware) to midstream operations (cut-and-sew, cushioning, upholstery assembly, testing and QA, and packaging). Downstream demand is served through specialty stores, home centers, online or DTC channels, and B2B project routes. Supplier power is influenced by polyurethane foam costs linked to petrochemicals and by performance textile pricing, alongside compliance-driven specifications such as low-emission materials and fire safety performance for hospitality and workplace seating. Traceability and documentation requirements, especially for EU-bound products, are increasingly reflected in supplier scorecards and in product content used across omnichannel sales.
Trade patterns and sourcing risk also shape manufacturing footprints. Industry sources in the evidence pack cite global upholstered furniture trade at around USD 33 billion, with about 35% of production traded internationally. They also note that Vietnam has overtaken China as the main supplier of upholstered furniture to the United States since 2023, consistent with multi-country sourcing strategies. Manufacturers and suppliers are responding to tariff exposure and logistics variability by qualifying alternate cover-material sources (including Turkey, India, and Vietnam where applicable), holding larger stocks of tariff-free materials for faster turns, and investing in automation such as CNC and automated cutting to reduce labor constraints and improve consistency in made-to-order and smaller-batch production.
Competitive Landscape
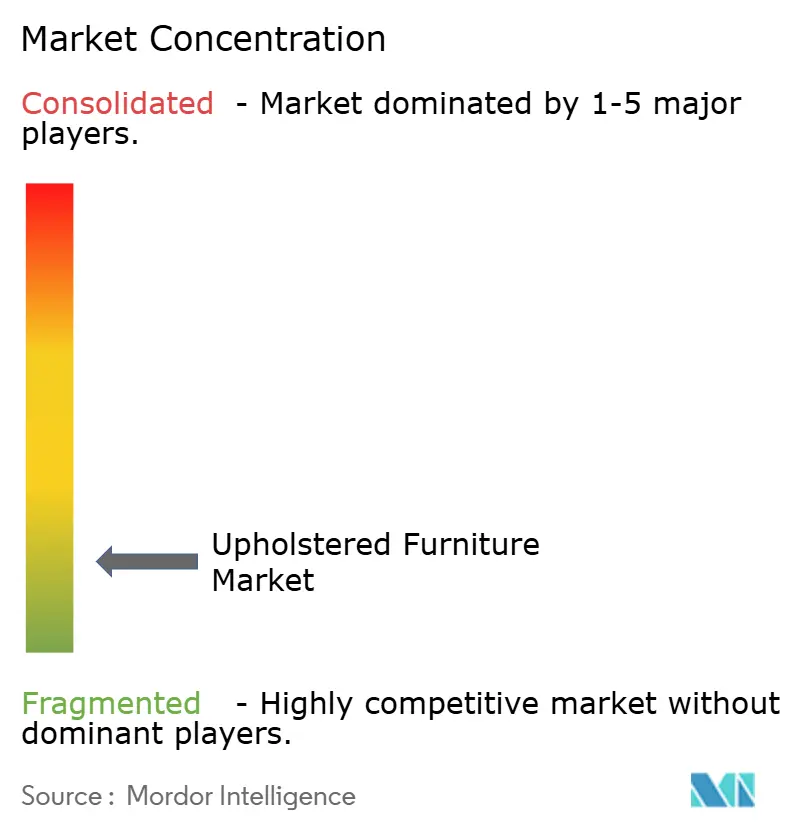
The upholstered furniture market remains fragmented, with no single brand dominating. Competition spans mid-tier, regional, and global players. Larger companies utilize vertical integration, while direct-to-consumer entrants focus on speed, customization, and pricing. Brands are enhancing foam, frames, and fabrics to stabilize supply chains and reduce fulfillment times. Specialty and contract channels support high-touch and project-based sales. Digital tools such as AR visualization and configuration are essential for reducing decision time and minimizing selection errors.
Compliance and sustainability are critical, with circularity and deforestation regulations integrated into sourcing and traceability systems to prevent shipment delays. Performance fabrics that offer stain resistance, cleaning flexibility, and appealing textures are gaining traction across residential and commercial segments. Investments in automated cutting, lean assembly, and digital sales enablement address labor constraints while maintaining craftsmanship in premium upholstery. Corporate workspace refresh programs and modular configurations sustain contract pipelines in North America and Europe. Direct-to-consumer players emphasize rapid delivery and simplified configuration, pressuring traditional distribution channels to improve speed without eroding margins.
Technology, materials, and compliance are key differentiation factors. AR and AI tools streamline design and approval workflows, reducing project timelines in residential and contract applications. Traceability for leather and wood through supplier disclosures and labeling ensures access to regulated markets, particularly in Europe. Low-VOC and high-performance fabrics support indoor air quality priorities while preserving visual appeal across price tiers. Suppliers integrating speed, compliance, and user experience into a unified strategy are positioned to succeed in this evolving market.
Upholstered Furniture Industry Leaders
La-Z-Boy Incorporated
Ashley Furniture Industries
DFS Furniture PLC
Natuzzi S.p.A.
MillerKnoll, Inc.
- *Disclaimer: Major Players sorted in no particular order

Market Opportunities and Future Outlook
Nearshoring and capacity modernization are creating opportunities for faster lead times, smaller production runs, and closer alignment with omnichannel demand for customization. In North America, multiple announced capacity moves support this shift. Universal Furniture is opening a 200,000-square-foot upholstery facility in Burke County, North Carolina (March 2026) with CNC routers and automated cutting. Peachtree Works is starting operations in a 400,000-square-foot facility in Candor, North Carolina (November 2025) to manufacture upholstery for Braxton Culler and Classic Home. These investments align with retailer and brand priorities around rapid fulfillment, fewer selection errors through digital visualization, and more consistent quality and compliance documentation.
Materials and product data transparency are also expanding sustainability-linked upholstery opportunities. This includes low-emission inputs, alternative polymers, and product-level information that can support circularity programs and meet evolving EU requirements. For example, Avantium and Heynen Systems B.V. began a collaboration in May 2026 to integrate renewable PEF polymer (releaf) into bedding and upholstery foam prototypes, and HAY launched a carbon-capturing single-seater sofa in January 2026 with Tencent’s Carbon Quest Manufacturing using industrial CO2 for foam production. On the compliance side, the EU ESPR framework, where furniture is a priority category for potential Digital Product Passport implementation, creates demand for standardized product data architectures that can be used across B2C and contract procurement. That, in turn, reinforces spending on traceability, labeling-ready content, and repair or take-back enablement.
Recent Industry Developments
- June 2026: La-Z-Boy Incorporated expanded its company-owned store footprint to 230 locations across North America, reaching 61% of its total network. The higher owned-store mix strengthens control over merchandising, pricing, and service for upholstered seating, and supports tighter feedback loops from retail to manufacturing and sourcing.
- April 2026: La-Z-Boy Incorporated launched AudioLuxe, a premium audio furniture line developed with Klipsch. The collaboration adds differentiated features to upholstered furniture and supports premiumization through branded partnerships and higher-value living room configurations.
- April 2025: Kuka Home opened a 624,000-square-foot facility in Binh Duong, Vietnam, expanding motion upholstery manufacturing capacity. The investment reinforces Vietnam’s role in global supply for upholstered furniture and provides additional scale for export-oriented production and lead-time management.


Research Methodology Framework and Report Scope
Market Definition and Coverage
This market covers new upholstered furniture sold during the year, focused on factory-made seating and reclining products with padded interiors and textile or leather coverings, valued at ex-factory pricing or import invoice values and expressed in USD.
Scope exclusions: We exclude outdoor-only upholstered items, used or refurbished pieces, and knock-down wooden frames sold without cushions.
Segmentation Overview
- By Product
- Chairs
- Sofas
- Tables
- Beds
- Stools
- Other Products (poufs, ottoman, etc.)
- By Material
- Fabric
- Leather
- Other Materials
- By Price Range
- Economy
- Mid-Range
- Premium
- By End User
- Residential
- Commercial
- By Distribution Channel
- B2C/Retail
- Home Centers
- Specialty Furniture Stores (including exclusive brand outlets)
- Online
- Other Distribution Channels (includes hypermarkets, supermarkets, teleshopping, warehouse clubs, departmental stores, etc.)
- B2B/Projects (directly to businesses)
- B2C/Retail
- By Geography
- North America
- Canada
- United States
- Mexico
- South America
- Brazil
- Peru
- Chile
- Argentina
- Rest of South America
- Europe
- United Kingdom
- Germany
- France
- Spain
- Italy
- BENELUX (Belgium, Netherlands, and Luxembourg)
- NORDICS (Denmark, Finland, Iceland, Norway, and Sweden)
- Rest of Europe
- Asia-Pacific
- India
- China
- Japan
- Australia
- South Korea
- South East Asia (Singapore, Malaysia, Thailand, Indonesia, Vietnam, and Philippines)
- Rest of Asia-Pacific
- Middle East And Africa
- United Arab of Emirates
- Saudi Arabia
- South Africa
- Nigeria
- Rest of Middle East And Africa
- North America
Data Sources, Market Sizing, and Validation
Desk Research
Desk work starts with public production and demand signals that help shape the size and direction of the category. For category context, we use sources such as the US Census Bureau retail and housing series, UN Comtrade trade flows for upholstered seating-related codes, World Bank macro indicators, and International Labour Organization wage and employment context that can influence big-ticket purchases.
To keep the model grounded, we also review company filings, earnings decks, and investor notes where revenue exposure to upholstered furniture is discussed. We then cross-check trade association pages and reputable press that report shipment conditions and pricing commentary. When needed, we use paid subscription access for company financials and news screening, and we reference an import and export shipment-level database for directional checks on upholstered seating trade. These sources are not exhaustive, and we use many other references during data collection and validation to clarify specific assumptions.
Primary Interviews and Surveys
Primary work is used to verify what desk signals cannot fully explain, especially around mix shifts, pricing, and channel behavior. We spoke with a blend of manufacturers, distributors, retailers, material ecosystem participants, and commercial buyers across APAC, EMEA, and the Americas so gaps in production, import reliance, and demand cycles could be cross-checked before finalizing assumptions.
Distribution of primary research fieldwork respondents
| Company type | Respondent position | Region |
|---|---|---|
| Top tier: 29% | CXOs: 14% | APAC: 47% |
| Mid tier: 51% | Functional/Unit leaders: 30% | EMEA: 29% |
| Smaller Players: 20% | Managers: 56% | Americas: 24% |
Market-Sizing & Forecasting
Sizing is built by reconstructing demand from a top-down view that links household formation and housing turnover, furniture store sales momentum, and macro affordability conditions to the upholstered furniture spend pool, which is then split using trade and production patterns by region. Once the demand pool is shaped, we apply market-specific filters such as residential versus commercial buying intensity, renovation cycles, and the shift between offline stores and online ordering.
To keep the totals realistic, we corroborate with selective bottom-up approximations such as sampled average selling price ranges for sofas, chairs, and beds, plus volume sanity checks using shipment and import direction. Where some countries have limited public disclosure, we handle the gap with proxy indicators like similar market structure, import dependence, and income bands, then adjust using interview feedback. Forecasting uses scenario analysis supported by a light multivariate regression view, where variables like housing starts, consumer spending, inflation in fabrics and foam inputs, and cross-border trade strength guide the year-by-year trajectory we publish.
Data Validation & Update Cycle
Validation is done through repeated cross-checks so the final number is not driven by any one data series. We compare the modeled outcome against independent signals such as trade direction, furniture retail performance, and housing-linked demand indicators, and then investigate outliers that do not match regional realities.
Before sign-off, assumptions and calculations go through multi-step analyst reviews, and call-backs are triggered when interview feedback conflicts with the desk view on pricing or volumes. Reports are refreshed annually, and interim updates are made when material events occur such as tariff changes, major demand shocks, or sharp input cost swings. Right before delivery, a fresh pass is completed so clients receive an updated view aligned to the latest available public data.
Mordor Intelligence's Upholstered Furniture Market Sizing Compared With Other Published Estimates
Published market sizes can differ even when they appear to describe the same industry, because the boundaries and measurement points are not always aligned. Differences usually come from what is counted as upholstered furniture, whether values are taken at ex-factory versus retail, and how each publisher treats imports, currency timing, and the base year.
Import invoice trends, factory output direction, and retail furniture spending checks are used to keep Mordor Intelligence tied to fresh unit sales valued at ex-factory or import invoice levels, rather than blending in retail markups or adjacent furniture categories. The spread also reflects how quickly prices are refreshed for fabrics, leather, foam, and freight, since slow updates can understate or overstate the same year depending on the inflation cycle.
Benchmark comparison
| Source | Market Size | Gaps in Research Methodology |
|---|---|---|
| Mordor Intelligence | USD 69.18 B (2026) | |
| Trade Journal A | USD 59.98 B (2024) | Uses an earlier base year and a different measurement point, and it is not clearly anchored to ex-factory or import invoice valuation, which can shift totals when retail markups and channel mix are implicitly blended. |
| Regional Consultancy B | USD 58.05 B (2023) | Relies on a 2023 baseline with a lower growth path and limited clarity on inclusions such as beds and other upholstered items, and currency timing and price refresh cadence can widen differences during periods of input cost inflation. |
The table shows that year choice and valuation point explain much of the range, and the remaining gap is usually driven by scope edges and how pricing is updated through the forecast. By tying the model to observable demand and trade signals and pressure-testing it with interview feedback, our estimate stays traceable to assumptions that can be rechecked when new data comes in.


Key Questions Answered in the Report
What is the value outlook and growth rate for upholstered furniture from 2026 to 2031?
The upholstered furniture market size is estimated USD 69.18 billion in 2026 and is projected to reach USD 89.36 billion by 2031 at a 5.25% CAGR, driven by omnichannel retail, hospitality fit-outs, and hybrid office seating demand.
Which product categories lead growth and why in upholstered seating?
Sofas captured 31.37% share of the total product market size in 2025 due to growing adoption of convertible and modular designs integrating storage, bed functions, and quick reconfiguration.
How are regulations influencing sourcing and design in upholstery?
EU EPR for textiles and the EU Deforestation Regulation push brands to embed traceability, low-emission materials, and disassembly-friendly designs, which affects labels, audits, and after-sales processes.
What are the most important channel trends for selling sofas and chairs?
Specialty stores still lead with 45.84% share for tactile assessment and design advice, while online expected to grow at a 7.28% CAGR through 2031 as AR configurators, faster delivery, and better content reduce purchase friction.
Which regions are the largest and the fastest growing for upholstered seating?
North America holds the largest 2025 share at 38.35%, and Asia-Pacific is the fastest growing at a 7.17% CAGR through 2031 as urbanization, local manufacturing, and rising incomes expand both residential and contract demand.
What materials are gaining traction in upholstery and why?
Fabric retains 59.33% share due to performance finishes, color range, and price, while leather is expected to grows at a 5.53% CAGR through 2031.
Page last updated on:






