
Unmanned Marine Vehicles Market Size and Share
Market Overview
| Study Period | 2020 - 2031 |
|---|---|
| Market Size (2026) | USD 5.57 Billion |
| Market Size (2031) | USD 8.35 Billion |
| Growth Rate (2026 - 2031) | 8.44 % |
| Fastest Growing Market | Asia-Pacific |
| Largest Market | North America |
| Market Concentration | Medium |
Major Players *Disclaimer: Major Players sorted in no particular order Image © Mordor Intelligence. Reuse requires attribution under CC BY 4.0. | |
Unmanned Marine Vehicles Market Analysis by Mordor Intelligence
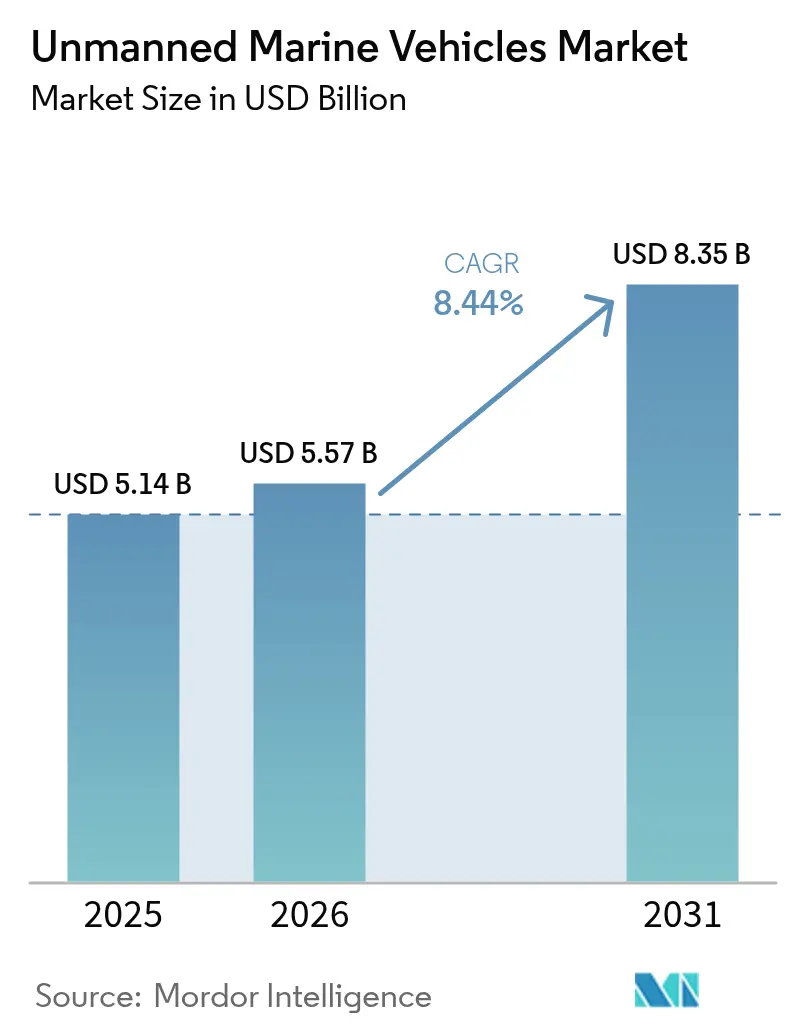
The unmanned marine vehicles market size was valued at USD 5.14 billion in 2025 and estimated to grow from USD 5.57 billion in 2026 to reach USD 8.35 billion by 2031, at a CAGR of 8.44% during the forecast period (2026-2031). Heightened naval modernization programs, an expanding offshore energy footprint, and surging demand for persistent ocean-data collection underpin this growth trajectory. Uncrewed platforms are shifting from experimental tools to indispensable assets that extend the reach of defense forces, lower inspection costs for oil, gas, and wind operators, and widen the scope of long-duration climate missions. Intensifying geopolitical flashpoints spur procurement of stealthy undersea systems, while sustainability mandates accelerate the pivot toward low-emission powertrains. Venture-capital-backed start-ups inject rapid-iteration culture into a field dominated by defense primes, enabling faster prototype cycles and driving double-digit order books for smaller, swarm-capable craft. Ecosystem participants increasingly view software—autonomy algorithms and data-fusion engines as the decisive differentiator for next-generation fleets.
Key Report Takeaways
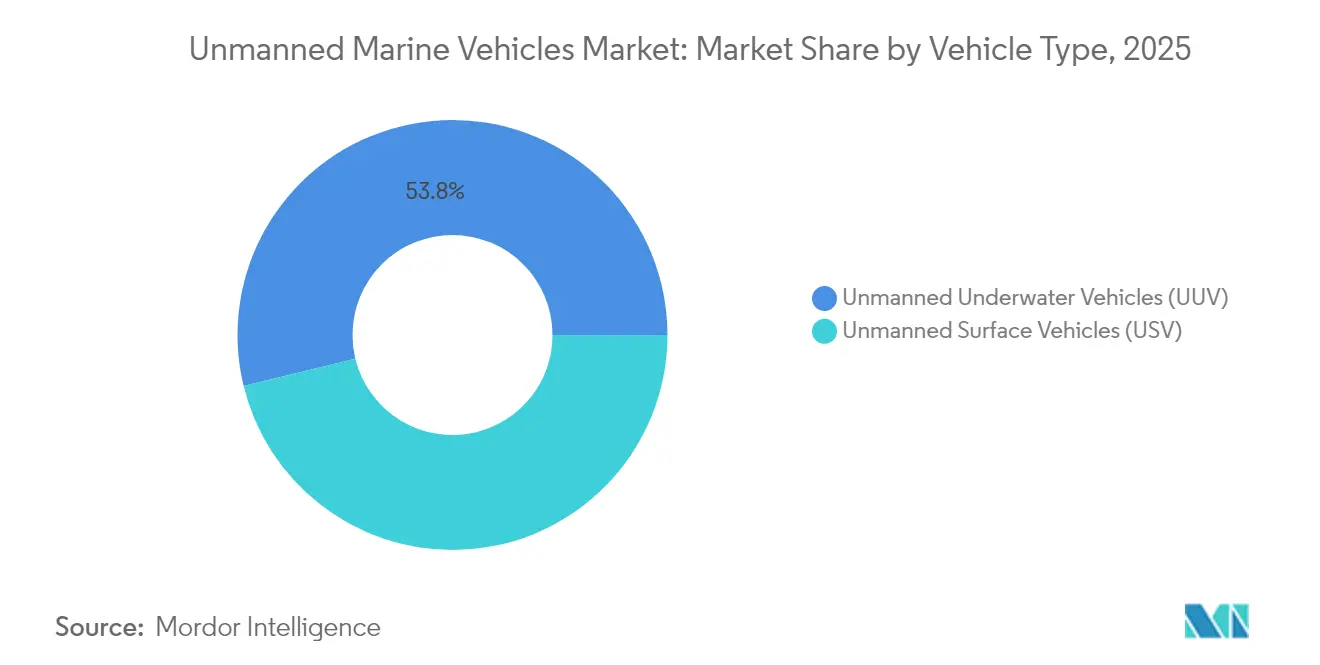
- By vehicle type, unmanned underwater vehicles captured 53.81% of the unmanned marine vehicles market share in 2025; the same segment is forecasted to expand at 11.03% CAGR through 2031.
- By vehicle size, medium craft commanded a 31.02% share of the unmanned marine vehicles market size in 2025, while micro vehicles are expected to hold the highest CAGR at 9.86% during the forecast period.
- By propulsion, electric systems held 31.95% of 2025 revenue; solar propulsion is expected to grow at a 10.65% CAGR to 2031.
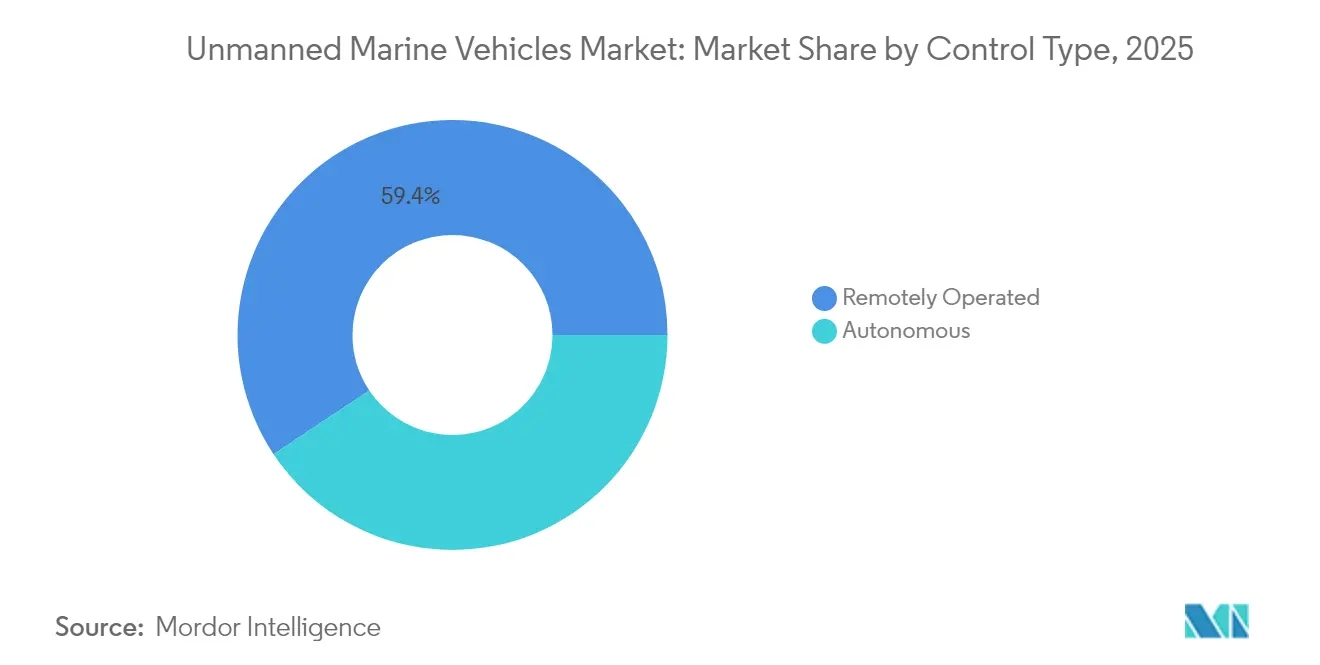
- By control type, remotely operated platforms accounted for 59.35% of 2025 sales, yet autonomous systems are advancing at 11.56% CAGR to 2031.
- By application, defense and security led with 46.10% of 2025 revenue; commercial use cases are poised to rise at 9.31% CAGR over the forecast window.
- By geography, North America led with 32.97% revenue share in 2025; Asia-Pacific is forecasted to post a 10.28% CAGR, the highest regional pace.
Note: Market size and forecast figures in this report are generated using Mordor Intelligence’s proprietary estimation framework, updated with the latest available data and insights as of 2026.
Market Trends and Insights
Drivers Impact Analysis of Unmanned Marine Vehicles Market*
| Driver | (~) % Impact on CAGR Forecast | Geographic Relevance | Impact Timeline |
|---|---|---|---|
| Increased defense investments in ISR and anti-submarine warfare capabilities | +2.1% | North America, Europe, spillover to APAC | Medium term (2-4 years) |
| Growing utilization of UMVs for offshore oil and gas inspection and maintenance | +1.8% | North Sea, Gulf of Mexico, Asia-Pacific | Short term (≤ 2 years) |
| Expanding use of autonomous systems in oceanographic and climate research | +1.2% | Global, polar regions, deep ocean | Long term (≥ 4 years) |
| Emerging role of UMVs in offshore renewable energy operations and maintenance | +1.5% | Europe, North America, expanding to APAC | Medium term (2-4 years) |
| Proliferation of subscription-based ocean data services enabled by UMV fleets | +0.9% | Developed maritime economies | Long term (≥ 4 years) |
| Emergence of ocean data-as-a-service subscription model | +0.7% | Global maritime data hubs | Long term (≥ 4 years) |
| Source: Mordor Intelligence | |||
Increased Defense Investments in ISR and Anti-Submarine Warfare Capabilities
Escalating maritime tensions drive navies to bankroll sophisticated unmanned fleets that plug coverage gaps in contested waters. The US Navy budgeted USD 177.3 million for uncrewed systems in fiscal 2025, with the Replicator initiative targeting mass production of autonomous undersea craft. Anduril’s Rhode Island plant can now roll out more than 200 Dive-LD vehicles annually. Parallel programs such as Australia’s Ghost Shark and India’s XLUUV tender reinforce a multi-regional procurement wave. European alignment is visible in France’s Naval Group drone demonstrators, underpinning future cooperative under-ice operations. Combat success stories from the Black Sea validate operational concepts and compress acquisition timelines, while Taiwan and Norway expand indigenous production to address local threat matrices.
Growing Utilization of UMVs for Offshore Oil and Gas Inspection and Maintenance
Energy majors now deploy autonomous underwater vehicles (AUVs) that slice inspection outlays by up to 55% compared with tethered ROVs.[1] TotalEnergies’ pilot of remotely controlled robots illustrates the shift toward onshore command hubs that cut offshore headcount. AUVs accelerate anomaly detection, shorten dry-dock intervals, and halve environmental footprints, prompting Gulf operators and North Sea contractors to retrofit digital twins for predictive maintenance. Renewable-powered uncrewed surface vessels in the UAE merge decarbonization goals with automation efficiencies. Conceptual studies such as DNV’s Solitude envisage fully unmanned floating LNG units realizing 20% operating-cost savings.
Expanding Use of Autonomous Systems in Oceanographic and Climate Research
Research agencies demand multi-month endurance to capture fine-grained data on carbon fluxes, polar melt rates, and deep-ocean currents. Seaglider platforms transmit live readings over satellite links for seasons at a time.[2] Australia’s IMOS network logs seabed imagery with centimeter precision, feeding data to open portals for global modeling efforts. European operators, led by Cyprus Subsea, maintain large fleets of M1 Seagliders for ecosystem monitoring. MIT’s bio-inspired glider designs promise step-change energy efficiency, which is essential for polar traverses. Emerging swarm deployments, illustrated by Cyprus’s reef-monitoring EONIOS project, democratize high-resolution mapping while trimming vessel charter budgets.
Emerging Role of UMVs in Offshore Renewable Energy Operations and Maintenance
With technician logistics absorbing more than 80% of lifetime costs for distant wind farms, operators are fielding uncrewed platforms for blade-tip scans and cable-lay surveys. The US Bureau of Safety and Environmental Enforcement records 35-80% cost reductions when drones replace rope-access teams. Innovate-UK-funded HydroSurv trials electrical USVs for seagrass baseline surveys that underpin environmental approvals. Australia’s Hydrus AUV cut deep-water exploration spend by 75% by eliminating divers and large support vessels. Machine-learning-powered digital twins improve anomaly forecasting and schedule service runs during fair-weather windows, securing yield targets as turbines migrate into 60-meter-plus depths.
Restraints Impact Analysis of Unmanned Marine Vehicles Market*
| Restraint | (~) % Impact on CAGR Forecast | Geographic Relevance | Impact Timeline |
|---|---|---|---|
| Significant capital expenditure and operational cost burdens | -1.4% | Global, pronounced in developing markets | Short term (≤ 2 years) |
| Lack of harmonized regulatory and classification frameworks | -0.8% | International operators | Medium term (2-4 years) |
| Emerging cybersecurity vulnerabilities in underwater communication networks | -0.6% | Global defense and commercial fleets | Long term (≥ 4 years) |
| Limited endurance and payload constraints in compact UMV platforms | -0.5% | All regions and applications | Medium term (2-4 years) |
| Source: Mordor Intelligence | |||
Significant Capital Expenditure and Operational Cost Burdens
Price tags for large uncrewed surface vehicles reach USD 250 million per hull, while the US Navy’s XLUUV program alone will draw USD 21.5 million in FY 2025. Hydrogen-fuel-cell AUV concepts eliminate emissions but demand bespoke bunkering and inflate upfront budgets. Nauticus Robotics posted a USD 50.7 million loss in 2023, underscoring the protracted payback period for breakthrough subsea morphing platforms. Venture rounds such as Blue Water Autonomy’s USD 14 million seed highlight the steep capital ladder that early-stage innovators must climb before first revenue.
Lack of Harmonized Regulatory and Classification Frameworks
The IMO’s draft MASS Code will not reach adoption before 2030, extending uncertainty for commercial fleet managers. Europe’s AI Act imposes new validation layers for autonomous logic, adding complexity to approval pipelines. Interim class guidance from ABS provides navigation lanes yet forces builders to juggle divergent rulebooks across flag states. The US Coast Guard’s roadmap acknowledges the gap, but timelines remain fluid. Legal ambiguities around liability and salvage rights impede insurance underwriting for transoceanic ventures. Absence of unified test protocols inflates compliance costs and stalls cross-border commercialization.
*Our forecasts treat driver/restraint impacts as directional, not additive. The impact forecasts reflect baseline growth, mix effects, and variable interactions.
Unmanned Marine Vehicles Market Segment Analysis
By Vehicle Type:
Underwater Dominance Drives InnovationUnmanned underwater vehicles (UUVs) retained 53.81% of the unmanned marine vehicles market share in 2025 while also logging the highest 11.03% CAGR through 2031, cementing their role as the sector’s dual growth and revenue engine. Demand springs from anti-submarine warfare upgrades and deep-water infrastructure inspection, with China’s typhoon-proof Blue Whale illustrating 30-day submerged endurance benchmarks.
Surface vehicles absorb the balance of the unmanned marine vehicles market but gain traction for coastal surveillance, mine countermeasures, and logistics. The United States’ hybrid fleet model exploits persistent surface patrols to complement covert undersea assets. Convergence trends show submarine-launched UAVs and joint surface-subsurface tasking that rewrite traditional mission doctrines.

By Vehicle Size:
Micro Platforms Challenge Conventional ScalingMedium craft secured 31.02% of 2025 revenue thanks to balanced payload-endurance profiles, yet micro vehicles sprint ahead at 9.86% CAGR, propelled by swarm robotics and barrier-free launch requirements. Compact nodes enable blanket coverage of littoral zones while minimizing attrition risk.
The modular design allows a scale-agnostic chassis where mission packs swap in at sea, blurring size boundaries. Soft-material thrusters and piezoelectric actuation sharpen maneuverability in confined pipelines and reef crevices. Swarm-based artificial reef monitoring in Cyprus validates month-long untended deployments, expanding biodiversity insights without research-vessel charters.
By Propulsion:
Solar Innovation Disrupts Electric LeadershipElectric drives commanded 31.95% of 2025 sales, anchoring most inspection, research, and patrol profiles. Solar solutions, backed by net-zero mandates, are eyeing a 10.65% growth pace to 2031. Multi-source hybrids knit solar, wave, and battery packs to extend station-keeping into multi-month windows.
Fuel-cell demonstrators from Norway reveal 24-hour submerged endurance with silent signatures prized for ISR, yet supply-chain resilience for membranes and catalysts remains pivotal. Diesel retains relevance for high-power sprint legs, but AI-managed energy-mix controllers quickly become the default architecture across hull sizes.
By Control Type:
Autonomous Systems Reshape Operational ParadigmsRemotely piloted craft formed 59.35% of 2025 deployments; nonetheless, autonomous modes outpace them with an 11.56% forecast CAGR as navies and surveyors cut tether latency and radio-link exposure.
Machine-learning route planners now optimize waypoints on the fly to dodge adverse currents and dense shipping lanes. MIT’s AI-tuned hydrodynamic forms achieve energy savings unattainable through manual hull-form iteration. Classification societies progressively codify fault-tolerant logic, allowing fully crewless vessels to transit restricted straits.
By Application:
Commercial Growth Outpaces Defense DominanceDefense and security captured 46.10% of 2025 turnover, driven by escalating undersea rivalry and mine-clearance imperatives, whereas commercial missions are slated to accelerate at 9.31% through 2031.
Renewable developers tap autonomous inspection to keep capacity factors high amid deeper-water turbine rollouts, and oil majors leverage big-data fusion to shrink downtime during brown-field rejuvenations. Dual-use payload bays facilitate rapid shifts from mine counter-measures to pipeline cathodic-protection surveys, smoothing asset utilization curves across budget cycles.
Geography Analysis
North America Unmanned Marine Vehicles Market
North America held 32.97% of 2025 revenue, underpinned by the Pentagon’s multi-billion-dollar fleet recapitalization and venture-financed scale-ups such as Saronic’s Louisiana shipyard producing 150-foot Marauder drones. Canada’s Arctic programs and Mexico’s deep-water Campeche inspections add incremental demand loops. The region benefits from a mature defense industrial base, AI talent pools, and early-adopter regulatory sandboxing.
APAC and Europe Unmanned Marine Vehicles Market
Asia-Pacific registers the steepest 10.28% CAGR through 2031 thanks to China’s fleet buildup, Australia’s AUKUS-linked Ghost Shark prototypes, and India’s tender for 12 XLUUVs that extend maritime domain awareness. Collaborative projects, including Norway’s decision to co-produce USVs in Ukraine, signal rising technology dispersion throughout the wider Indo-Pacific quadrant.
Europe Unmanned Marine Vehicles Market
Europe leverages integrated shipbuilding clusters and cohesive R&D funding to sustain a robust pipeline of autonomous trials. The EU AI Act sets harmonization precedents that may translate into first-mover regulatory advantages. The United Kingdom evaluates Kongsberg Vanguard motherships for mine-hunting packages, while France’s Naval Group anchors continental expertise in large-diameter hull forms.

Regulatory Landscape
Regulation for unmanned marine vehicles is maturing as international and national rules converge around safety and operating frameworks. The International Maritime Organization (IMO) mass code took effect as a non-mandatory baseline on 1 July 2026, creating a shared reference for autonomous surface ship safety concepts while member states apply local equivalence and exemptions as national frameworks evolve. In the United Kingdom, the Maritime and Coastguard Agency (MCA) implemented Marine Guidance Notice MGN 702 (M) Amendment 2 effective 19 January 2026, clarifying how smaller unmanned craft can operate under existing rules and exemptions as broader regimes continue to develop.
On the defense side, governance and acquisition mechanisms are consolidating around faster unmanned fielding. In July 2026, the US Department of Defense issued a memorandum establishing a Direct Reporting Portfolio Manager for Unmanned Systems, pointing to more centralized prioritization and faster unmanned capability delivery. The US Navy's May 2026 shipbuilding plan also reinforces medium unmanned surface vessels and extra-large unmanned undersea vehicles as core elements of future naval power.
Value Chain Analysis
The unmanned marine vehicles value chain runs from long-lead component suppliers (acoustic sensors, navigation and communications, corrosion-resistant structures, certified marine batteries) to system integrators and prime contractors (hull fabrication, autonomy stacks, mission payload integration), and then to downstream operators including navies, offshore energy companies, survey contractors, and research agencies. Qualification and acceptance testing is a key gating step across the chain, since defense programs require military-grade shock, vibration, and EMI/EMC compliance, while commercial deployments must satisfy class and flag expectations.
Industrial activity is also shifting from prototype builds toward production and teaming models that reduce integration risk. In 2025, HII delivered the first two Lionfish small uncrewed undersea vehicles to the US Navy under a contract that can scale up to 200 vehicles (valued at over USD 347 million), highlighting how established production facilities convert programs into fleetable assets. Partnerships also keep interfaces tighter between platform OEMs and autonomy or assurance specialists, such as the November 2025 memorandum of understanding between BMT and Teledyne Marine targeting UK Ministry of Defence and NATO autonomy needs, and the November 2025 HII and Incat Crowther USV partnership showcased around the modular ROMULUS 190. On the demand and fulfillment side, US Navy program restructuring, including consolidation of LUSV and MUSV into the Modular Attack Surface Craft (MASC) program, supports modular procurement that favors suppliers providing repeatable mission-package integration, cyber-compliant software, and scalable logistics support.
Competitive Landscape
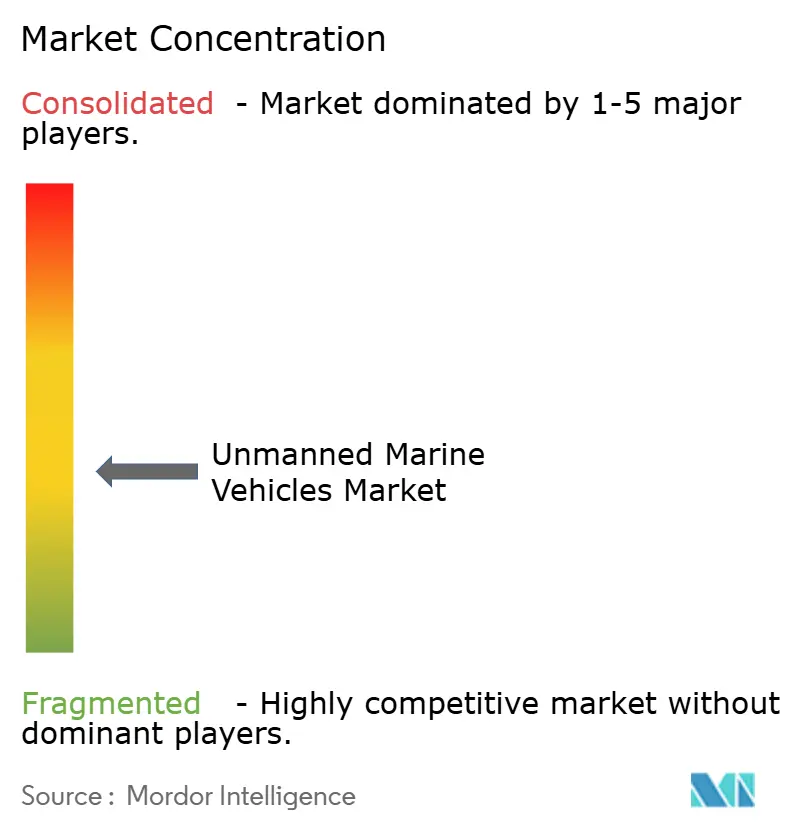
The unmanned marine vehicles market features a moderate fragmentation profile where blue-chip defense primes intersect with venture-backed disruptors. L3Harris Technologies, Inc., Thales Group, and BAE Systems plc wield legacy program-of-record credentials, ensuring steady backlog streams. Anduril Industries deploys agile sprints that compress prototype cycles from years to months. Saronic’s USD 850 million raise at a USD 4 billion valuation epitomizes the capital magnetism surrounding autonomy-first shipyards.
Consolidation remains brisk: BlueHalo absorbed VideoRay to marry micro-ROV know-how with counter-UUV kill chains, and L3Harris Technologies, Inc. integrated ASV Global to broaden surface-hull portfolios.[4] Certification muscle becomes a differentiator as ABS and equivalent bodies harden test matrices, favoring vertically integrated vendors that can shoulder documentation overheads.
White-space revenue models emerge around subscription ocean-data services: Terradepth’s Absolute Ocean platform offers pay-per-gigabyte bathymetry feeds, while Oceaneering signs on as anchor customer to leverage cross-asset benchmarks. Competitive intensity will continue to sharpen around high-density energy systems, containerized command modules, and off-the-shelf AI inference stacks.
Unmanned Marine Vehicles Industry Leaders
-
L3Harris Technologies, Inc.
-
Kongsberg Gruppen ASA
-
Teledyne Technologies Incorporated
-
Thales Group
-
Saab AB
- *Disclaimer: Major Players sorted in no particular order
Unmanned Marine Vehicles Market Companies Covered in this Report
- General Dynamics Mission Systems (General Dynamics Corporation)
- Thales Group
- BAE Systems plc
- Northrop Grumman Corporation
- Textron Inc.
- L3Harris Technologies, Inc.
- Kongsberg Gruppen ASA
- Saab AB
- Teledyne Technologies Incorporated
- ATLAS ELEKTRONIK GmbH
- Exail Technologies SA
- The Boeing Company
- Ocean Aero, Inc.
- SeaRobotics Corporation
- Huntington Ingalls Industries, Inc.
- Fugro N.V.
- Anduril Industries, Inc.
- Cellula Robotics Ltd.
- Sea Machines Robotics Inc.
Market Opportunities and Future Outlook
In the United States, observed procurement activity highlights opportunities for vendors that can industrialize medium and large unmanned platforms and integrate with fleet operations and modular payloads. The US Navy shipbuilding plan published in May 2026 outlines a path to procure 47 MUSVs across the Future Years Defense Program, including USD 171 million in FY 2027 for the first three vessels, and the US Navy selected seven companies in May 2026 for an initial MUSV marketplace prototype testing. These steps keep the focus on repeatable mission-package integration and scalable deployment capabilities.
In Europe, hybrid-fleet initiatives expand the scope for smaller and medium USVs, along with rapidly deployable logistics concepts and domestic supply-chain participation. The UK Ministry of Defence awarded GBP 12.5 million in March 2026 to Kraken Technology Group for 20 K3 Scout uncrewed surface vessels under Project Beehive, and the Royal Navy followed with an airdrop trial of an uncrewed boat from an A400M over the North Sea in July 2026. Across commercial and research applications, demand also favors vendors that bundle vehicles with repeatable survey workflows and data delivery subscriptions, aligning with persistent ocean-data collection and reduced offshore personnel exposure.
Recent Industry Developments in Unmanned Marine Vehicles Market
- July 2026: Kongsberg Gruppen ASA and Oceaneering International joined the Combat Autonomous Maritime Platform CAMP program led by the US Defense Innovation Unit. The engagement advances field testing, integration, and deployment of extra-large uncrewed underwater vehicles. This partnership signals a push to accelerate undersea autonomy in defense programs.
- March 2026: L3Harris Technologies received a Defense Innovation Unit Other Transaction Authority contract to deliver a Torpedo Tube Launch and Recovery system for Iver4 900 autonomous underwater vehicles supporting US Navy submarine operations. The work supports modular launch and recovery hardware that preserves stealth and reduces integration friction. It also strengthens the defense pull-through for compact AUV payloads and mission software that can be deployed from existing undersea platforms.
- February 2024: Kongsberg Discovery was awarded a 24-month contract by the US Defense Innovation Unit to develop HUGIN AUV capabilities aligned to Large Displacement Unmanned Underwater Vehicle prototype efforts. The award supported technology maturation for longer-endurance UUV operations and higher-capability sensor integration. It also contributed to a broader pipeline of DIU-backed prototyping activity that encourages vendors to align product roadmaps to rapid demonstration milestones rather than traditional long-cycle acquisition.
Unmanned Marine Vehicles Market Report Scope and Research Methodology
Market Definition and Coverage
This market covers unmanned marine vehicles used on or under water to perform missions without an onboard crew, where value is captured from the vehicle platform and its mission-ready configuration for defense, commercial, and research use.
Scope exclusions: We exclude crewed vessels, general marine electronics sold outside a UMV program, and stand-alone services that are billed without delivery of a vehicle or mission kit.
Segments Covered in This Report
- By Vehicle Type
- Unmanned Surface Vehicles (USV)
- Unmanned Underwater Vehicles (UUV)
- By Vehicle Size
- Micro
- Small
- Medium
- Large
- By Propulsion
- Diesel
- Electric
- Hybrid
- Solar
- By Control Type
- Remotely Operated
- Autonomous
- By Application
- Defense and Security
- Anti-Submarine Warfare (ASW)
- Intelligence, Surveillance, and Reconnaissance (ISR)
- Mine Counter-Measures
- Commercial
- Offshore Oil and Gas
- Offshore Wind and Renewables
- Port and Infrastructure Inspection
- Scientific Research and Exploration
- Search and Rescue (SAR)
- Defense and Security
- By Geography
- North America
- United States
- Canada
- Mexico
- Europe
- United Kingdom
- France
- Germany
- Italy
- Spain
- Rest of Europe
- Asia-Pacific
- China
- India
- Japan
- South Korea
- Australia
- Rest of Asia-Pacific
- South America
- Brazil
- Rest of South America
- Middle East and Africa
- Middle East
- United Arab Emirates
- Saudi Arabia
- Rest of Middle East
- Africa
- South Africa
- Rest of Africa
- Middle East
- North America
Data Sources, Market Sizing, and Validation
Desk Research
Desk work starts with public demand signals and program context so our assumptions are anchored to real activity. We refer to sources such as defense budget documents and procurement releases, maritime and naval registries, and national statistical portals where marine equipment trade and production context is available.
To avoid over-relying on press headlines, we also check sources such as UN Comtrade for trade patterns, the International Maritime Organization for regulatory and safety context, and peer reviewed ocean engineering and robotics journals for adoption and capability trends. Company annual reports, investor presentations, and contract announcements help us map active product lines and the pace of new platform introductions. For deeper cross checks, we selectively use paid subscriptions for defense contract tracking, import and export shipment-level data, patent databases, and company financials and intelligence. These examples are not exhaustive, and many other public sources and databases were also used for collection, validation, and clarification.
Primary Interviews and Surveys
Primary inputs are gathered through expert interviews and structured surveys with OEM and subsystem participants, operators, integrators, and domain specialists who track procurement, deployment, and retrofit decisions. Feedback is collected across major regions to confirm adoption timing, typical payload fit, price bands, and what is counted as a delivered UMV versus a trial or a research prototype.
Distribution of primary research fieldwork respondents
| Company type | Respondent position | Region |
|---|---|---|
| Top tier: 39% | CXOs: 15% | APAC: 45% |
| Mid tier: 43% | Functional/Unit leaders: 41% | EMEA: 33% |
| Smaller Players: 18% | Managers: 44% | Americas: 22% |
Market-Sizing & Forecasting
Sizing is built using a top-down approach where defense procurement and offshore activity indicators are translated into a realistic demand pool, and then split by platform type and typical mission fit. After that structure is set, we corroborate totals with selective bottom-up checks like a sampled ASP times unit volume view by platform class, and channel inputs that distinguish delivered versus planned units.
Inputs that matter in this market include naval and coast guard unmanned program awards, offshore inspection and survey activity levels, typical payload and endurance requirements that shift platform pricing, unit replacement cycles, and the mix of remotely operated versus higher-autonomy systems. When the data is patchy, we use gap handling rules such as applying comparable program benchmarks from similar navies, and then stress-testing the outputs against known fleet and contract patterns.
For forecasting, scenario analysis is used because procurement timing can move with budgets, mission urgency, and platform qualification cycles. Assumptions are refined with expert views on delivery schedules, autonomy adoption pace, and price progression, followed by a final pass to keep growth paths consistent with observed program pipelines.
Data Validation & Update Cycle
Outputs are checked in multiple steps, first by comparing totals against independent signals like contract flows, visible deployment activity, and trade and patent direction, and then by reviewing any sharp year-to-year jumps. When an anomaly shows up, we re-check the underlying driver, re-contact sources when needed, and confirm that currency timing and inflation assumptions have been applied consistently.
Before publication, the model and its assumptions go through a peer review within the analyst team, followed by a final sign-off after variance checks across regions and platform categories. Reports are refreshed annually, and interim updates are triggered when material events occur such as major contract awards, policy shifts, or a step change in offshore activity, so clients receive an up-to-date view at delivery time.
Mordor Intelligence's Unmanned Marine Vehicles Market Size Versus Other Published Estimates
Published market sizes for unmanned marine vehicles can differ even when the topic label is similar, since each publisher sets its own inclusion rules and timing for what counts as market value. Variations also come from how defense programs are treated, how commercial demand is tied to offshore and survey activity, and how pricing is carried forward year by year.
The main gap comes from counting mission kits, payload packages, and autonomy upgrades as full market value even when they are sold as add-ons, where Mordor Intelligence counts them only when they are part of a delivered vehicle or a clearly scoped vehicle upgrade program.
Benchmark comparison
| Source | Market Size | Gaps in Research Methodology |
|---|---|---|
| Mordor Intelligence | USD 5.57 B (2026) | |
| Global Consultancy A | USD 5.46 B (2026) | Uses a broader platform definition where adjacent unmanned sea-system spending can be blended into UMVs, and it can apply faster price escalation across autonomy packages without a separate delivered-versus-prototype screen. |
| Industry Publisher B | USD 5.10 B (2025) | Anchors the value to a different base year and may mix research prototypes and trials into the addressable pool, which can shift the level when currency timing and procurement-delivery lags are not normalized. |
Taken together, the spread is mostly explained by what gets counted as a completed UMV sale, and by how base-year timing is handled. Our approach keeps the total traceable to procurement signals, offshore activity, and realistic unit and price logic, which makes the result easier to reproduce and update.
Key Questions Answered in the Report
What is the projected value of the unmanned marine vehicles market in 2031?
The unmanned marine vehicles market size is forecasted to reach USD 8.35 billion by 2031.
Which segment leads revenue and growth simultaneously?
Unmanned underwater vehicles hold 53.81% revenue share and are expanding at 11.03% CAGR through 2031.
How fast is the Asia-Pacific region growing?
Asia-Pacific is set to record a 10.28% CAGR, the fastest among all regions.
Which propulsion technology shows the highest growth potential?
Solar based propulsion technology are projected to grow at 10.65% CAGR to 2031.
What recent milestone demonstrates submarine-launched drone capability?
In June 2025 the US Navy completed the first launch and recovery of a UUV from a nuclear submarine, proving covert deployment feasibility.
Which new business model is gaining traction in this sector?
Subscription-based ocean-data services, where operators lease fleets and sell data rather than hardware, are rapidly emerging.