
Market Overview
| Study Period | 2020 - 2031 |
|---|---|
| Forecast Data Period | 2026 - 2031 |
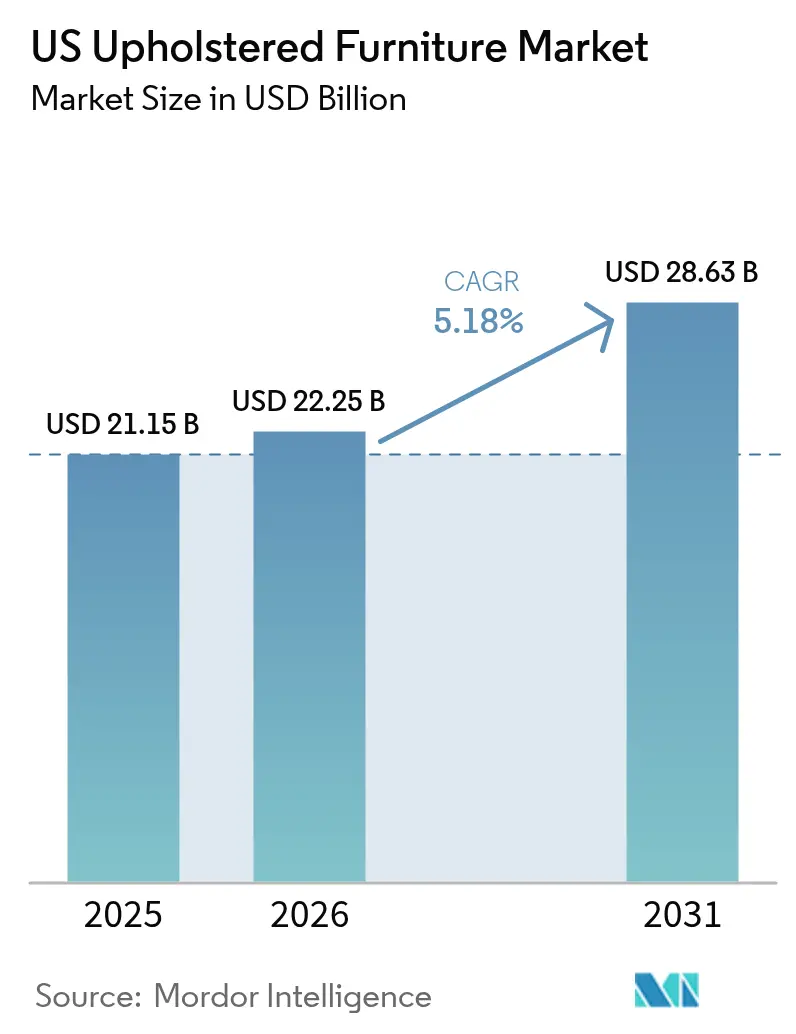
| Base Year Market Size (2025) | USD 21.15 Billion |
| Market Size (2026) | USD 22.25 Billion |
| Market Size (2031) | USD 28.63 Billion |
| Growth Rate (2026 - 2031) | 5.18% CAGR |
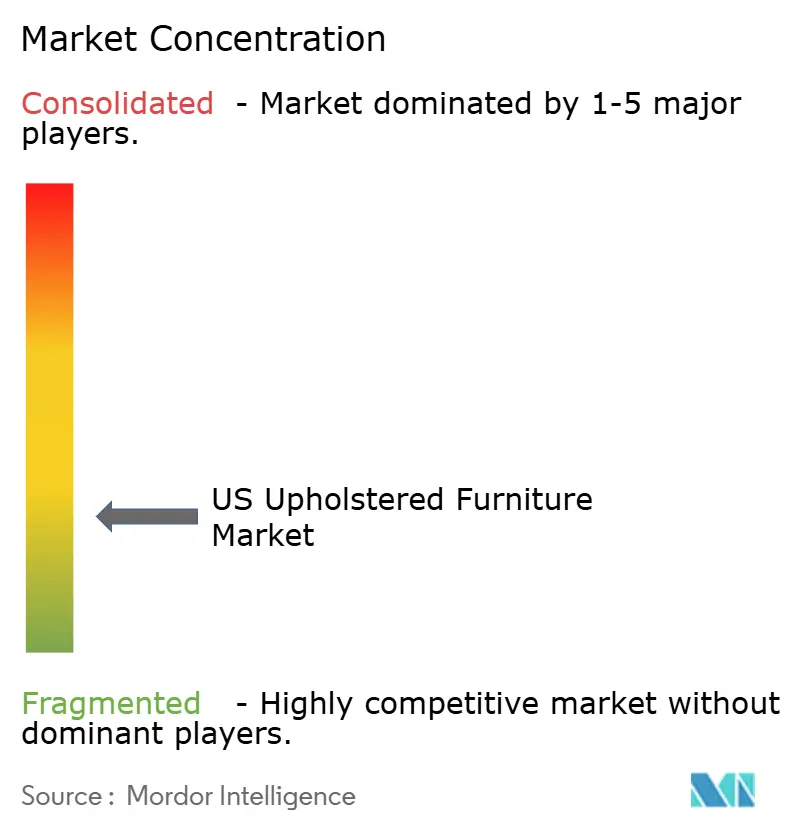
| Market Concentration | Low |
Major Players *Disclaimer: Major Players sorted in no particular order Image © Mordor Intelligence. Reuse requires attribution under CC BY 4.0. | |
US Upholstered Furniture Market Analysis by Mordor Intelligence
United States upholstered furniture market size in 2026 is estimated at USD 22.25 billion, growing from 2025 value of USD 21.15 billion with 2031 projections showing USD 28.63 billion, growing at 5.18% CAGR over 2026-2031. The rebound reflects stable consumer spending, reshoring that narrows the landed-cost gap on imports, and e-commerce penetration that lowers distribution friction. Tariffs introduced in early 2025—10% on all imported furniture and 145% on Chinese shipments—have reduced price advantages enjoyed by Asian suppliers, encouraging domestic production while preserving choice for value-oriented buyers. Demand also benefits from Sun Belt migration, quick-ship programs that appeal to millennials, and higher outlays on premium pieces that align with sustainability and wellness values. Competitive intensity remains low, leaving room for niche entrants and digital natives to gain visibility through direct-to-consumer models.
Key Report Takeaways
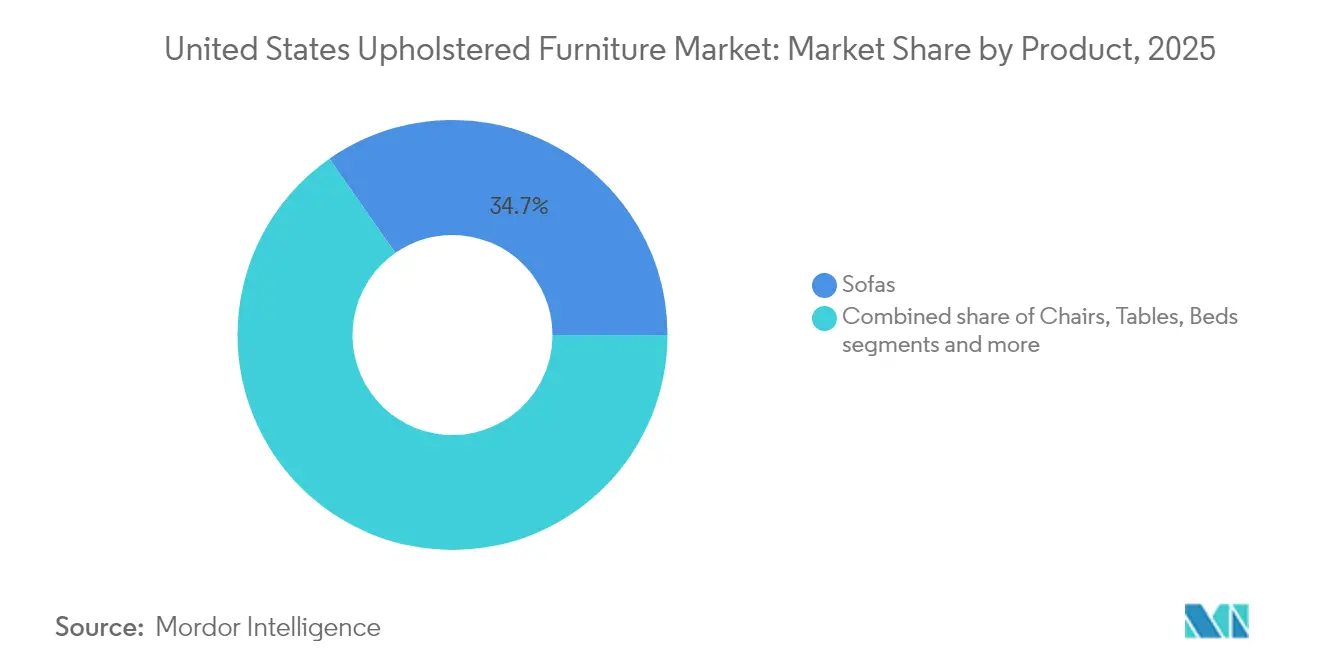
- By product, sofas led with 34.70% revenue share in 2025, while chairs are projected to grow the fastest at a 6.23% CAGR through 2031.
- By material, fabric commanded a 54.60% share in 2025; leather is set to expand at a 5.78% CAGR to 2031.
- By price range, the mid-range bracket accounted for 49.30% of the US upholstered furniture market size in 2025; the premium bracket is projected to advance at a 5.55% CAGR.
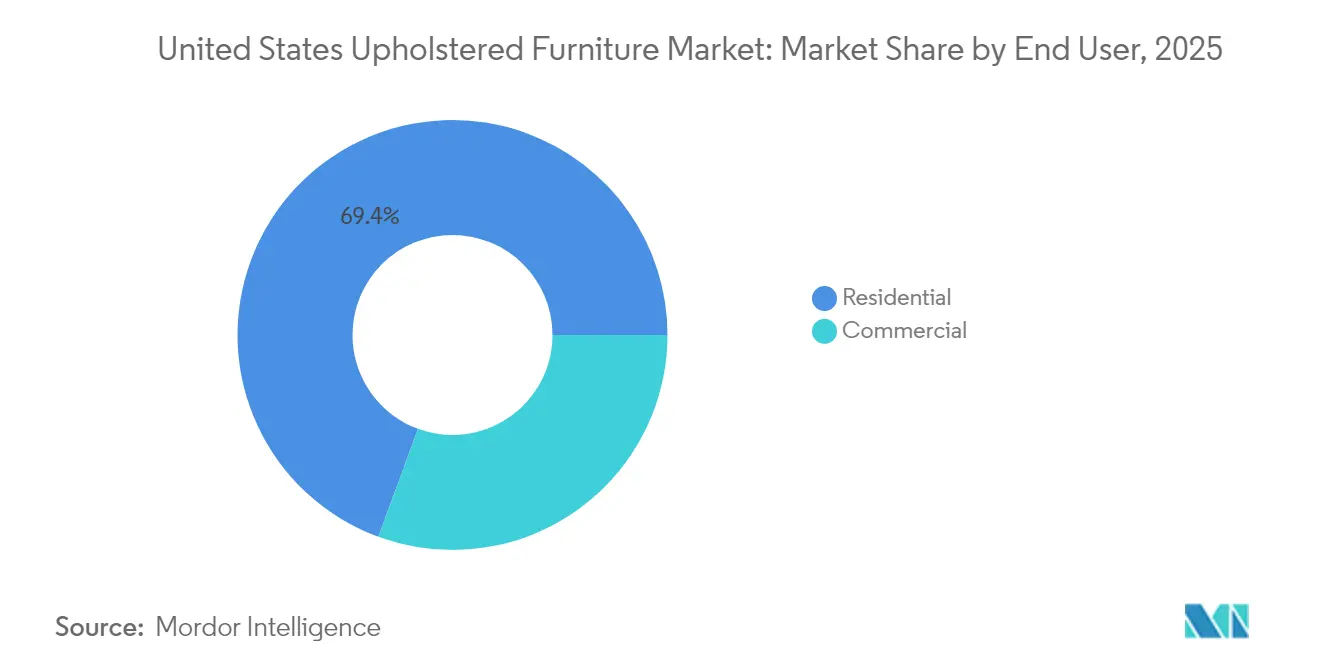
- By end user, residential captured 69.40% of the US upholstered furniture market share in 2025; commercial applications are expected to grow at a 6.05% CAGR.
- By distribution channel, specialty furniture stores held a 39.20% share in 2025, whereas online sales are forecast to rise at a 6.38% CAGR.
- By region, the South contributed 39.60% of sales in 2025, while the West is on track for the highest regional CAGR of 5.95%.
Note: Market size and forecast figures in this report are generated using Mordor Intelligence’s proprietary estimation framework, updated with the latest available data and insights as of 2026.
US Upholstered Furniture Market Trends and Insights
Drivers Impact Analysis*
| Driver | ( ~ ) % Impact on CAGR Forecast | Geographic Relevance | Impact Timeline |
|---|---|---|---|
| E-commerce-led direct-to-consumer penetration | +1.2% | National, early gains in urban centers | Medium term (2-4 years) |
| Mass-customization & quick-ship programs | +0.8% | National, millennial hubs | Medium term (2-4 years) |
| Housing starts & renovation boom in Sun Belt | +1.5% | South and West | Long term (≥ 4 years) |
| ‘Made-in-USA’ reshoring initiatives | +1.0% | National, manufacturing clusters | Long term (≥ 4 years) |
| Rising spend on luxury furnishing | +0.7% | Northeast and West Coast | Medium term (2-4 years) |
| Source: Mordor Intelligence | |||
E-commerce-led Direct-to-Consumer Penetration Accelerating Upholstery Sales
Online home-furnishing revenue is reshaping the US upholstered furniture market as millennials gravitate toward digital channels. Younger shoppers favor sectionals, driving online sofa searches, while 3D visualization and AI recommendations address the tactile gap that once hindered large-ticket e-commerce. Fragmented brand concentration encourages digitally native labels to build direct relationships that bypass costly showrooms. Although personalization options remain available, many shoppers now prioritize faster delivery over bespoke features, prompting suppliers to refine configurable SKUs rather than fully customized builds.
Mass-Customization & Quick-Ship Programs Attracting Millennial Buyers
Domestic factories exploit proximity to offer two-week ship windows, an advantage amplified by tariff-related import delays. While customization tools allow fabric and finish choices, uptake has eased as consumers trade breadth for delivery speed. Vertical integration and lean production help manufacturers keep promise dates without heavy inventory. Sustainability expectations also shape preferences, with Generation Z rewarding brands that disclose material provenance and carbon use. Suppliers that combine modest customization with clear eco-attributes are positioned to expand share.
‘Made-in-USA’ Reshoring Initiatives Shortening Lead Times & Boosting Domestic Orders
A decline in imports from Asian low-cost nations signaled momentum toward local sourcing. Tariffs imposed in 2025 further reduced the cost delta, and marquee investments such as a USD 80 million Ashley Furniture expansion in Mississippi underline confidence in the US upholstered furniture market. Challenges persist: upholstery shops still face skilled-labor gaps that may slow capacity ramp-ups, and infrastructure upgrades will be essential if reshoring continues.
Increasing Spending on Luxury Furnishing Is Driving the Market
Premium pieces are forecast to outpace the broader US upholstered furniture market, advancing at a 5.8% CAGR. Consumers, having revalued home comfort during the pandemic, now seek heirloom durability and articulation of personal style. Design forecasts for 2025–2026 highlight craft aesthetics, quiet minimalism, and blended digital-physical spaces, motivating buyers to accept higher tickets for ethically sourced hides and hand-finished frames. Brands with vertical control over fabric mills, leather tanneries, or cushioning inputs protect margins while offering transparency that luxury shoppers reward.
Restraints Impact Analysis*
| Restraints | ( ~ ) % Impact on CAGR Forecast | Geographic Relevance | Impact Timeline |
|---|---|---|---|
| Skilled upholsterer shortage | -1.8% | National, acute in legacy hubs | Long term (≥ 4 years) |
| Volatile raw-material prices are compressing margins | -1.2% | National | Short term (≤ 2 years) |
| Low-cost imports from Vietnam & China | -0.9% | National, price-sensitive niches | Medium term (2-4 years) |
| Source: Mordor Intelligence | |||
Volatile Raw Material Prices Compressing Margins
Commodity swings in cotton, steel, and polyurethane foam continue to unsettle input budgets. While lumber prices stabilized, steel and cotton remain above pre-2020 averages, and the CPI for household furnishings rose 0.4% in February 2025[1]U.S. Bureau of Labor Statistics, “Consumer Price Index: Household Furnishings and Operations,” bls.gov. Retailers mitigate exposure through surcharge line items or flash promotions. Some global brands have enacted three price cuts within 12 months to hold traffic, accepting thinner margins in the near term. Manufacturers respond with multi-sourcing strategies and R&D on bio-based foams that lower dependence on petrochemicals.
Low-Cost Imports from Vietnam & China Eroding Domestic Share
Vietnam’s share of US furniture imports climbed as suppliers shifted capacity from China. Even with new tariffs, discount channels still favor import programs to defend entry-level price points. Domestic plants must improve automation and scale to match cost expectations, especially in the economic tier. Continued vigilance on anti-dumping actions and evolving trade policy will shape the final balance between imported and local stock.
*Our forecasts treat driver/restraint impacts as directional, not additive. The impact forecasts reflect baseline growth, mix effects, and variable interactions.
Segment Analysis
By Product: Sofas Lead Market Share, While Chairs Drive Growth Acceleration
Sofas generated 34.70% of 2025 sales, making them the anchor category in the US upholstered furniture market. Fabric options dominate sofa purchases; shoppers choose comfort and variety. Chairs, including recliners and accent seats, are forecast to expand at a 6.23% CAGR as hybrid work normalizes secondary seating in home offices. The US upholstered furniture market size for chairs is projected to widen in absolute dollar terms as consumers buy task-oriented pieces alongside living-room ensembles.
Millennial demand for sectionals now drives sofa category traffic and supports modular designs that scale from apartments to single-family homes. At the same time, niche formats such as poufs and ottomans grow as space-saving add-ons. Commercial applications also contribute to chair momentum, with hospitality brands refreshing lounge areas to encourage longer stays. The diversified product mix dilutes reliance on a single category and allows manufacturers to balance high-ticket sofas with volume-driven accent lines.


By Material: Fabric Dominance Faces Leather’s Premium Growth Trajectory
Fabric maintained a 54.60% share in 2025 on the strength of stain-resistant finishes and upgradeable color palettes. Synthetic linen and recycled polyester blends help suppliers address sustainability claims without premium pricing. Leather is projected to outpace overall market growth with a 5.78% CAGR, benefiting from consumer perception of longevity and luxury aesthetics. Full-grain hides combined with high-resilience foam satisfy premium buyers who equate heft with durability.
The US upholstered furniture market share of fabric remains steady, yet leather’s upswing lifts average selling prices and margin dollars. Eco-leather and plant-based alternatives serve shoppers who want leather visuals without animal content, reflecting broader green priorities. Suppliers that maintain dual material strategies can hedge commodity risk and serve both cost-sensitive and premium segments.
By Price Range: Mid-Range Stability Contrasts with Premium Acceleration
Mid-range pieces captured 49.30% of the US upholstered furniture market size in 2025, underscoring the pull of balanced value and quality. Efficient domestic production and containerized imports meet this price ceiling, keeping the average spent window attractive to millennials. Promotions around holiday events stabilize throughput and clear seasonal inventory.
Premium items are tracking a 5.55% CAGR through 2031 as buyers reward craftsmanship, heritage branding, and sustainable sourcing. Vertical integration—owning tanneries, fabric mills, or foam plants—helps luxury labels control costs despite volatile inputs. Economy products remain essential for first-time buyers yet face the greatest tariff exposure, pressing suppliers to engineer lower-material-content SKUs while preserving perceived quality.
By End User: Residential Dominance Meets Commercial Growth Potential
Residential purchases yielded 69.40% of 2025 revenue and continue to anchor the US upholstered furniture market. Existing-home transactions historically trigger new-furnishing demand; a forecast 3.7% rise in resales through 2025 supports steady sofa and sectional throughput. Renovation activity, buoyed by remote work and multigenerational living, extends the replacement cycle and encourages upgrades to higher quality.
Commercial demand is projected to climb to 6.05% CAGR, fueled by hospitality refurbishments and office reconfigurations that emphasize collaborative zones. Code compliance, notably CAL 133 flammability, drives material choices and costs in public-use pieces. Restaurant lounge concepts and co-working venues also favor plush seating, broadening the specification base beyond traditional corporate settings.
By Distribution Channel: Specialty Stores Face Digital Disruption
Specialty furniture retailers held a 39.20% share in 2025 through curated showrooms, white-glove delivery, and financing offers that simplify big-ticket decisions. The model remains central for high-involvement purchases, yet web-influenced research means many shoppers visit showrooms only after forming a preference set online. Omnichannel investments now include augmented-reality apps that overlay fabrics on in-home photos, merging physical validation with digital convenience. Retail sales at furniture and home-furnishings stores reached USD 11.0 billion in March 2024, up from USD 10.3 billion in February, signalling a rebound in brick-and-mortar traffic even as e-commerce penetration rises .
Online sales are forecast to grow at 6.38% CAGR and already generate double-digit gains for hybrid brands. Improved last-mile logistics and free returns ease risk perceptions. The US upholstered furniture market benefits from this dual-channel model: brands capture margin uplift online and use stores for service-heavy interactions. Big-box home centers and department stores maintain relevance in suburban corridors but compete on traffic rather than depth, pressuring assortments to remain price competitive.
Geography Analysis
The South accounted for 39.60% of 2025 revenue, underpinned by 4.3% GDP growth from 2020 to 2024 and sustained in-migration that lifted residential permit volume above half the national total. Lower median home prices leave households with greater discretionary funds, translating into higher ticket averages for living-room seating. Southern states accounted for 52% of all new residential building permits issued nationwide in 2024, underscoring why the South remains the largest regional demand engine for living-room seating and other upholstered pieces
The West is projected to post the fastest regional CAGR at 5.95% through 2031, owing to tech-center payroll expansion and consumer affinity for premium, eco-labeled furnishings. High housing costs compress entry-level spending but elevate demand for sectional versatility and multi-functional pieces among affluent cohorts. The region’s early adoption of e-commerce tools further accelerates online furniture sales, positioning digital natives to test innovations before scaling nationwide.
The Midwest and Northeast remain mature yet stable contributors. Heritage factories, skilled craft clusters, and established corporate campuses sustain baseline demand for both residential and commercial seating. Population aging tempers volume growth, but higher disposable incomes in the Northeast support above-average unit prices. Institutional orders from education and health-care complexes offset softer household formation, ensuring a balanced but slower growth curve across these regions.
Value Chain Analysis
The US upholstered furniture value chain begins with upstream materials and components, including polyurethane foam producers and textile mills, alongside frames, springs, fasteners, adhesives, and packaging. Trade actions have narrowed the import cost advantage, which has led manufacturers and importers to rebalance sourcing across domestic suppliers and alternative offshore locations, while prioritizing faster replenishment for quick-ship assortments.
Midstream manufacturing covers cutting and sewing, frame fabrication, foam shaping, upholstery, and final assembly. Domestic production clusters are concentrated in the Southeast, particularly North Carolina and Mississippi. Downstream, products move through a mix of company-owned and independent retail, specialty furniture stores, e-commerce/direct-to-consumer, and B2B/project channels, with regional distribution centers, white-glove delivery, and reverse-logistics capabilities supporting returns and damage claims. Skilled upholsterer shortages and raw material price volatility are key bottlenecks, which is pushing manufacturers toward more standardized configurable SKUs, multi-sourcing of fabrics and foam, and greater automation and digital production planning to protect lead times and yields.
Competitive Landscape
The US upholstered furniture market remains fragmented. This dispersion indicates limited switching costs and fosters opportunity for entrants capable of brand storytelling and rapid fulfillment. Direct-to-consumer startups leverage social media engagement and transparent pricing to gain traction without the capital burden of large showrooms.
Established brands pursue vertical integration to defend margins and consistency. American Leather maintains internal control over frame cutting and foam molding to guarantee quality across premium SKUs. Expansion strategies center on store rollouts in growth corridors and R&D hubs that prototype modular frames and recycled-fabric lines. La-Z-Boy recently added ten stores in Arizona and Massachusetts and opened an innovation center to accelerate product launches.
Technology adoption serves as the new battleground. AI-driven demand forecasting, 3D commerce platforms, and chat-based room planners enhance customer engagement while trimming inventory risk. Brands integrating these tools report higher conversion and fewer returns. Market fragmentation implies that digital competence, sustainability claims, and agile supply chains are the decisive levers for share gains over the next five years.
US Upholstered Furniture Industry Leaders
Ashley Furniture Industries
La-Z-Boy Incorporated
Bassett Furniture Industries
Flexsteel Industries
Hooker Furnishings Corporation
- *Disclaimer: Major Players sorted in no particular order

Market Opportunities and Future Outlook
Reshoring and domestic capacity additions are creating room for suppliers that can deliver faster lead times without sacrificing quality, especially in made-to-order and quick-ship upholstery where import lead times and tariff-driven cost resets have made proximity more valuable. Facility moves and expansions in North Carolina and Mississippi point to active efforts to secure domestic output, including Universal Furniture opening a 200,000-square-foot upholstery plant in Burke County, NC (March 2026) and Sit, Sleep, Supply (parent of Simmons Living) acquiring JCooper USA and its Vardaman, MS plant (April 2026). In the contract segment, Revival American Contract Furniture operates a 170,000-square-foot plant in High Point, NC (May 2026), which supports opportunities linked to hospitality and other project-driven demand that favors repeatability and scale.
Technology enablement is another practical opportunity as manufacturers invest in automated cutting, CNC routing, and centralized production platforms to improve material efficiency and reduce exposure to labor constraints. The adoption of platforms such as Lectra Valia Furniture (implemented by Edgecombe Furniture, July 2025) shows how traceability, planning, and workflow digitization are being used to improve flexibility across fabric-intensive programs. Retail-side opportunities center on omnichannel execution, where digital visualization, room planning, and improved last-mile delivery can lift conversion for high-consideration categories such as sofas and sectionals, even as store networks continue to anchor discovery and service-heavy transactions.
Recent Industry Developments
- June 2026: The Lovesac Company announced it is on track to begin domestic manufacturing of its Sactionals line in summer 2026, moving core, revenue-driving SKUs away from overseas production. The step reinforces tariff and freight risk mitigation while shortening replenishment cycles for modular upholstery programs.
- November 2025: Universal Furniture transitioned upholstery operations from a leased facility in Conover, North Carolina, to company-owned facilities in Hildebran, North Carolina. Consolidating into owned capacity supports tighter control of throughput, process capability upgrades, and lead-time reliability for domestic-order programs.
- April 2024: Prepac Manufacturing announced the closure of its Delta, British Columbia plant and the relocation of production to North Carolina. The shift reflects a broader push to place upholstered and casegoods-adjacent production closer to US demand to reduce cross-border logistics friction and better manage landed costs.


Research Methodology Framework and Report Scope
Market Definition and Coverage
For this methodology, the market covers sales of new upholstered furniture in the United States, meaning seating and bed-related frames that have integrated cushioning and a finished outer upholstery layer (such as fabric or leather) and are sold through retail or contract routes.
Scope exclusions: We exclude patio-only outdoor seating, standalone mattresses, and any reupholstery or refurbishment services.
Segmentation Overview
- By Product
- Chairs
- Sofas
- Tables
- Beds
- Stools
- Other Products (poufs, ottoman, etc.)
- By Material
- Fabric
- Leather
- Other Materials
- By Price Range
- Economy
- Mid-Range
- Premium
- By End User
- Residential
- Commercial
- By Distribution Channel
- B2C/Retail
- Home Centers
- Specialty Furniture Stores (including exclusive brand outlets)
- Online
- Other Distribution Channels (includes hypermarkets, supermarkets, teleshopping, warehouse clubs, departmental stores, etc.)
- B2B/Projects (directly to businesses)
- B2C/Retail
- By Geography
- South
- Midwest
- West
- Northeast
Data Sources, Market Sizing, and Validation
Desk Research
Desk work started by mapping demand and supply signals that can be checked in public datasets, then translating them into a simple, repeatable market model. We reviewed sources such as the US Census Bureau (manufacturing and retail trade series), Bureau of Labor Statistics inflation and household spending indicators, and USITC trade statistics for relevant furniture categories.
To keep the market story tied to observable industry behavior, we also looked at information from groups such as the American Home Furnishings Alliance and the International Housewares Association where relevant context was available, along with peer-reviewed papers on durable goods purchasing and housing-linked demand. Company filings, investor presentations, and reputable press were used to understand pricing pressure, promotional cadence, and channel mix shifts, and we used a paid subscription for company financials and shipment-level trade checks where needed for consistency. These examples are not exhaustive, and we also relied on other public sources to collect data, validate assumptions, and clarify definitions.
Primary Interviews and Surveys
Primary work focused on validating what is included as upholstered furniture, how prices move by category, and what share of demand is tied to housing turnover versus replacement cycles. We spoke with a mix of manufacturers, distributors, retailers, and contract-focused participants, then used the inputs to pressure-test assumptions on import share, lead times, and promotional intensity across the United States.
Distribution of primary research fieldwork respondents
| Company type | Respondent position | Region |
|---|---|---|
| Top tier: 32% | CXOs: 13% | APAC: 45% |
| Mid tier: 54% | Functional/Unit leaders: 31% | EMEA: 37% |
| Smaller Players: 14% | Managers: 56% | Americas: 18% |
Market-Sizing & Forecasting
The sizing begins with a top-down build where production, trade flows, and category-level consumption signals are used to reconstruct the total upholstered furniture demand pool inside the United States. Once that total is formed, we corroborate it with selective bottom-up approximations, such as sampled average selling price (ASP) ranges times estimated unit volumes for common items like sofas and chairs, followed by channel checks to adjust for promotional effects.
Key inputs used in the model include housing starts and existing home sales as a proxy for move-related purchases, CPI movement for furniture and for key materials to track price changes, import penetration trends, and shifts in retail channel mix between store-based and online. Because a single ASP assumption can swing results, ASP progression is handled by combining inflation series with interview-based checks on discounting and mix changes. For forecasting, scenario analysis is used, where housing activity and real disposable income outlook guide the base case, and assumptions are then tuned using what we heard on lead times, demand softness, and planned assortment changes.
Data Validation & Update Cycle
Outputs are checked against independent signals, including trade totals, broad furniture spending trends, and implied per-household consumption ranges, and then large variances are reworked before sign-off. When a category shows unusual movement, we re-check definitions, rerun price and volume splits, and re-contact selected experts to confirm whether the shift is real or a data timing issue.
Each report is refreshed annually, with interim updates triggered by material events such as sudden tariff changes, sharp inflation swings, or major shifts in housing demand. Before delivery, a final analyst pass is completed to ensure assumptions, currency timing, and market values reflect the latest available information.
Mordor Intelligence's Unitedstates Upholstered Furniture Market Size Measured Against Other Published Estimates
Published market sizes can vary a lot, even when they describe the same industry, because the scope lines and valuation points are not always aligned. Differences usually come from what product set is counted, whether values are reported at retail versus first sale, how imports are treated, and how quickly pricing assumptions are refreshed.
The benchmark table shows a spread that is largely explained by scope and pricing treatment rather than simple math mistakes. In Mordor Intelligence's model, the value is tied to new upholstered furniture at first domestic sale or import entry, and adjacent items like standalone mattresses and reupholstery services are kept out, which can pull the total away from estimates that blend in broader home furnishing spend.
Benchmark comparison
| Source | Market Size | Gaps in Research Methodology |
|---|---|---|
| Mordor Intelligence | USD 21.15 B (2025) | |
| Industry Association A | USD 24.80 B (2025) | Often reported closer to retail spend and may blend upholstered frames with bedding and broader furnishings, which lifts totals during high-promotion periods. |
| Trade Journal B | USD 19.60 B (2025) | Typically built from a narrower tracked set of import and factory shipment categories, which can undercount contract demand and miss parts of mixed-material upholstered items. |
Looking across the three figures, the practical takeaway is that scope discipline and the valuation point drive most of the difference. By keeping the model anchored to clear product inclusions, import treatment, and repeatable price and volume checks, we end up with a number that is easier to reconcile with real-world demand signals year after year.


Key Questions Answered in the Report
What is the current size of the US upholstered furniture market?
The US upholstered furniture market was valued at USD 22.25 billion in 2026.
How fast is the market expected to grow?
The market is forecast to expand at a 5.18% CAGR, reaching USD 28.63 billion by 2031.
Which product category holds the largest share?
Sofas lead with 34.70% of 2025 sales, while chairs are the fastest-growing segment at 6.23% CAGR.
Why is reshoring important for US producers?
Tariffs and higher freight costs have narrowed the import cost advantage, making domestic manufacturing more competitive and reducing delivery times.
Which sales channel is expanding the quickest?
Online channels are set to grow at a 6.38% CAGR, supported by 3D commerce and direct-to-consumer strategies.
Page last updated on:






