
Market Overview
| Study Period | 2020 - 2031 |
|---|---|
| Forecast Data Period | 2026 - 2031 |
| Base Year Market Size (2025) | USD 1.91 Billion |
| Market Size (2026) | USD 1.99 Billion |
| Market Size (2031) | USD 2.43 Billion |
| Growth Rate (2026 - 2031) | 4.12 % |
| Market Concentration | Medium |
Major Players *Disclaimer: Major Players sorted in no particular order Image © Mordor Intelligence. Reuse requires attribution under CC BY 4.0. | |
United States Floor Coatings Market Analysis by Mordor Intelligence
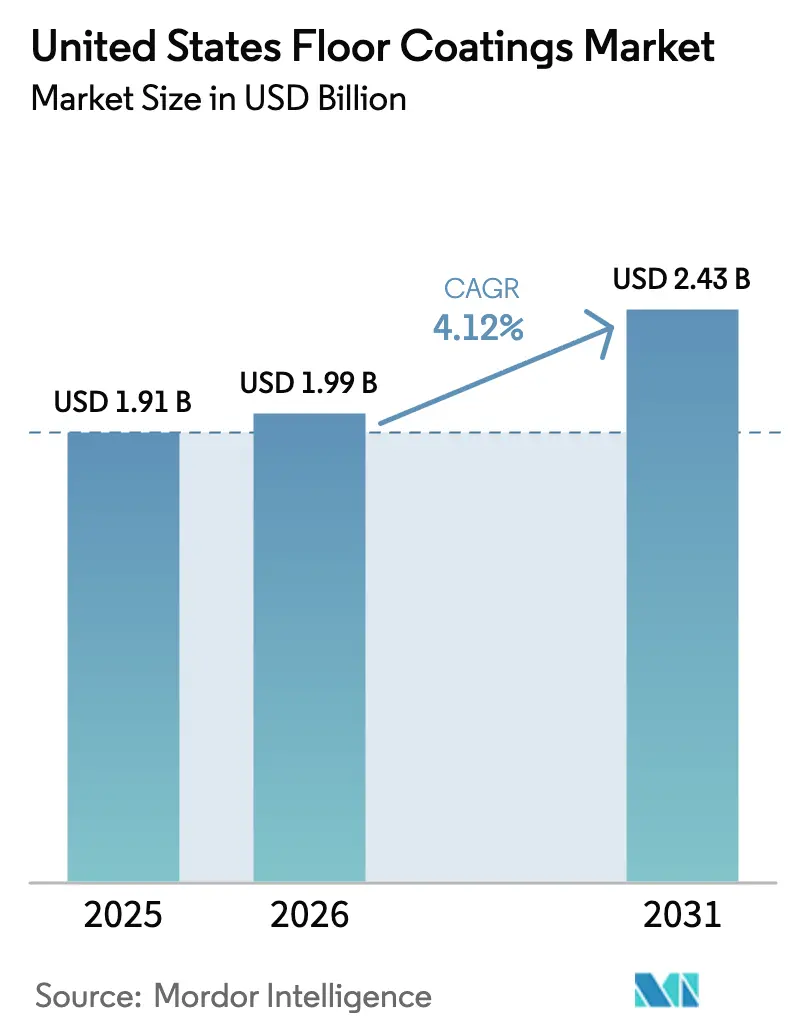
United States Floor Coatings Market size in 2026 is estimated at USD 1.99 billion, growing from 2025 value of USD 1.91 billion with 2031 projections showing USD 2.43 billion, growing at 4.12% CAGR over 2026-2031. This outlook is underpinned by an 8.6% jump in total construction starts expected in 2025, buoyed by lower borrowing costs and robust spending on data centers, healthcare facilities, and electric-vehicle (EV) plants. Demand centers on high-performance resinous systems that satisfy electrostatic-discharge (ESD) and antimicrobial standards while complying with increasingly stringent volatile-organic-compound (VOC) rules. Epoxy retains its foothold because of proven durability, but polyaspartic technologies are gaining from faster cure times that shorten facility shutdowns. Concrete remains the dominant substrate, yet engineered-wood adoption in sustainable designs is lifting specialist coating requirements.
Key Report Takeaways
- By product type, epoxy commanded 41.70% of the United States Floor Coatings market share in 2025, while polyaspartic systems are projected to grow at a 5.52% CAGR through 2031.
- By floor material, concrete accounted for 68.20% of the United States Floor Coatings market size in 2025, with wood substrates advancing at a 5.18% CAGR between 2026-2031.
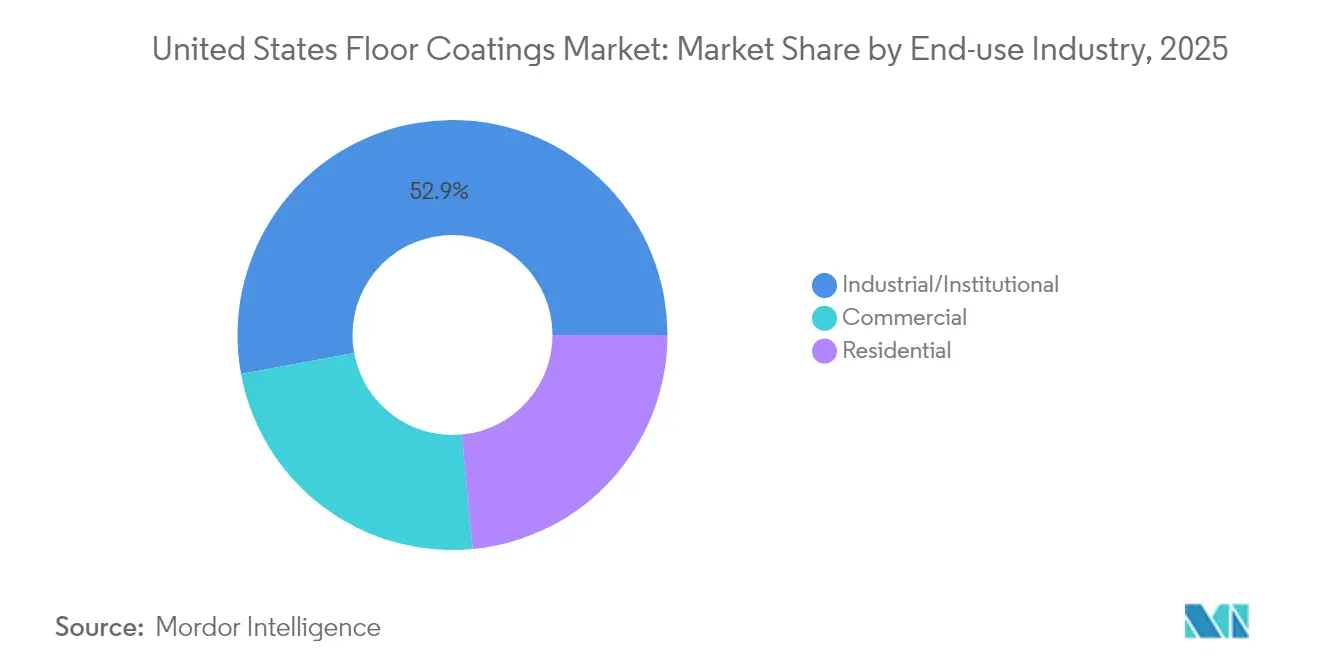
- By end-use industry, the industrial/institutional segment held 52.90% share of the United States Floor Coatings market size in 2025 and is set to expand at a 4.42% CAGR over the same period.
Note: Market size and forecast figures in this report are generated using Mordor Intelligence’s proprietary estimation framework, updated with the latest available data and insights as of 2026.
United States Floor Coatings Market Trends and Insights
Drivers Impact Analysis*
| Driver | (~) % Impact on CAGR Forecast | Geographic Relevance | Impact Timeline |
|---|---|---|---|
| Robust Growth in Commercial and Industrial Construction | +1.2% | National, concentrated in Texas, Southeast | Medium term (2-4 years) |
| Rising Adoption of Epoxy Systems for Durability | +0.8% | National, stronger in industrial corridors | Long term (≥ 4 years) |
| Demand for Aesthetic Decorative Coatings in Remodeling | +0.6% | National, urban centers leading | Short term (≤ 2 years) |
| Shift Toward Low-VOC, High-solids Formulations | +0.4% | California, Northeast states | Medium term (2-4 years) |
| EV Gigafactory and Data-center Builds Need ESD Flooring | +0.5% | Texas, Southeast, Midwest | Long term (≥ 4 years) |
| Source: Mordor Intelligence | |||
Robust Growth in Commercial and Industrial Construction
The United States' commercial construction's projected 8.6% growth in 2025 creates a multiplier effect for floor coatings demand, particularly in sectors requiring specialized performance characteristics. The Texas construction industry maintains nearly USD 40 Billion in ongoing and upcoming projects through TxDOT, including a USD 3 Billion expansion at Dallas-Fort Worth International Airport. This infrastructure surge extends beyond traditional applications, as the U.S. Bureau of Labor Statistics identifies power generation and electrical contractor segments as key employment growth areas, directly correlating with increased demand for conductive and dissipative floor coatings in energy infrastructure projects[1]. The construction industry's 4.7% employment growth projection through 2033 indicates sustained demand for flooring installations, though labor constraints may shift preferences toward faster-curing polyaspartic systems. Healthcare construction's 27% share of anticipated projects benefits antimicrobial coating segments, as post-pandemic facility design prioritizes infection control surfaces.
Rising Adoption of Epoxy Systems for Durability
Epoxy’s 42.35% share in 2024 reflects its chemical resistance and lifecycle performance, qualities prized in advanced manufacturing where thermal cycling and heavy loads are routine. Domestic output is growing as anti-dumping actions redirect sourcing toward U.S. plants, trimming lead times but lifting input costs. Innovations such as bio-based resins align with sustainability goals without sacrificing film integrity. Clean-room settings in automotive battery and aerospace assembly continue to specify epoxy floors for their ability to meet both Electrostatic Discharge (ESD) and sanitary standards.
Demand for Aesthetic Decorative Coatings in Remodeling
The residential remodeling market's recovery from interest rate pressures creates demand for decorative floor coatings that combine aesthetic appeal with functional performance. Industry leaders from Mohawk, Shaw, and Mannington emphasized the importance of preparing for demand recovery as secondary home sales improve, with 90% of transactions involving existing homes that typically require flooring updates. Decorative concrete coatings benefit from homeowners' preference for low-maintenance surfaces replicating natural materials while offering superior durability and stain resistance. The Surfaces 2024 expo highlighted innovations in digital printing technology for flooring, enabling realistic wood and stone textures that expand decorative coating applications beyond traditional industrial uses. Consumer preferences increasingly favor sustainable options, with waterborne formulations gaining traction due to reduced environmental impact and improved indoor air quality. Integrating antimicrobial properties into decorative systems addresses health-conscious consumers' concerns while maintaining aesthetic appeal, creating differentiation opportunities for manufacturers targeting the residential remodeling segment.
Shift Toward Low-VOC, High-solids Formulations
Regulatory pressure from state-level VOC limits drives formulation innovation toward high-solids systems that maintain performance while meeting environmental compliance requirements. California's floor coating VOC limit of 100 grams per liter, effective since 2017, established the benchmark that other states increasingly adopt, with Michigan and Colorado implementing similar restrictions in 2024. The South Coast Air Quality Management District's Rule 1113 sets even stricter limits at 50 grams per liter, forcing manufacturers to develop waterborne and high-solids technologies that deliver comparable performance to traditional solvent-based systems. Sherwin-Williams' emphasis on producing coatings that meet stringent VOC standards while collaborating with industry stakeholders to refine regulations demonstrates how leading manufacturers are positioning for regulatory compliance as a competitive advantage. The transition to low-VOC formulations creates technical challenges in maintaining film formation, adhesion, and durability properties, requiring significant R&D investment that favors larger manufacturers with extensive technical resources.
Restraints Impact Analysis*
| Restraint | (~) % Impact on CAGR Forecast | Geographic Relevance | Impact Timeline |
|---|---|---|---|
| Volatile Epoxy and Raw-material Prices | -0.7% | National, import-dependent regions | Short term (≤ 2 years) |
| Stricter State VOC Limits Raise Compliance Costs | -0.4% | California, Northeast states | Medium term (2-4 years) |
| Shortage of Certified Resinous-flooring Applicators | -0.3% | National, acute in growth regions | Long term (≥ 4 years) |
| Source: Mordor Intelligence | |||
Volatile Epoxy and Raw-material Prices
Raw material price volatility creates margin pressure and project cost uncertainty that constrains market growth, particularly as anti-dumping investigations reshape epoxy resin supply chains. The U.S. International Trade Commission's determination that the domestic industry suffers material injury from subsidized imports from South Korea, Taiwan, and Thailand resulted in potential duties that could increase input costs for floor coating manufacturers. The concentration of epoxy production in Asia creates supply chain vulnerabilities that manifest as price volatility during geopolitical tensions or logistics disruptions. Smaller coating manufacturers face particular challenges in managing input cost fluctuations, as they lack larger competitors' purchasing power and supply chain diversification. The shift toward domestic epoxy production, while reducing import dependence, may result in structurally higher costs due to smaller production scales and higher labor costs compared to Asian facilities.
Stricter State VOC Limits Raise Compliance Costs
Evolving VOC regulations create compliance costs that disproportionately impact smaller manufacturers while driving industry consolidation toward companies with extensive R&D capabilities. California's leadership in establishing stringent VOC limits forces national manufacturers to develop dual product lines or reformulate entire portfolios to meet the most restrictive requirements, increasing development costs and inventory complexity[2]. The patchwork of state regulations creates compliance challenges for contractors operating across multiple jurisdictions, with products approved in one state potentially violating limits in another. Reformulation costs to achieve low-VOC performance often require premium raw materials and advanced manufacturing processes, creating price premiums that can reduce market penetration in price-sensitive applications. The technical challenges of maintaining film formation, adhesion, and durability properties in low-VOC formulations require significant R&D investment that favors larger manufacturers with extensive technical resources.
*Our forecasts treat driver/restraint impacts as directional, not additive. The impact forecasts reflect baseline growth, mix effects, and variable interactions.
Segment Analysis
By Product Type: Polyaspartic Growth Challenges Epoxy Dominance
Epoxy retained a 41.70% United States floor coatings market share in 2025 thanks to its entrenched performance record in factories, warehouses, and aviation hangars. Polyaspartic systems, however, are projected to expand at a 5.52% CAGR, propelled by overnight-curing capability that limits facility downtime, low to zero VOC profiles, and elasticity that tolerates substrate movement. The United States floor coatings market size for epoxy remains healthy, yet its expansion is moderating as users weigh lifecycle savings against longer application windows. Polyurethane coatings straddle cost and performance, especially where chemical resistance outstrips acrylics but budgets preclude premium solutions. Graphene-enhanced and bio-based chemistries in the “Others” segment promise niche traction in ESD-sensitive and Leadership in Energy and Environmental Design (LEED)-driven projects, respectively.
Sustained industrial upgrades, notably at EV battery plants and chemical processing hubs, keep epoxy relevant, while retail chains and stadium operators gravitate to polyaspartic overlays that can reopen floors within a single shift. Manufacturers able to supply both chemistries offer contractors the flexibility to choose system packages based on project timelines and environmental constraints. Supply-chain security, particularly for amine hardeners derived from imported feedstocks, remains a strategic concern shared across all resin systems.


By Floor Material: Wood Substrates Drive Innovation
Concrete retained 68.20% of 2025 demand, reflecting its ubiquity in slabs-on-grade and elevated decks where protective coatings extend service life. That said, the United States floor coatings market size for wood substrates is on a 5.18% CAGR track as architects adopt engineered lumber for carbon-reduction targets. Engineered-wood flooring captured 74% of hardwood sales in 2024, underscoring the appetite for coatings that manage moisture ingress while showcasing natural grain. United States floor coatings market share gains in this segment reward suppliers offering breathable yet durable waterborne urethanes.
Wood-friendly chemistries must allow vapor diffusion to avoid cupping and gaps, forcing formulators to balance permeability with abrasion resistance. Commercial spaces such as boutique retail and hospitality venues represent the vanguard of this shift, as operators value both the aesthetic warmth of timber and the maintainability of resinous finishes. Metal, ceramic, and composite substrates remain specialized niches that nonetheless demand primers tailored to high-energy surfaces.
By End-use Industry: Industrial Facilities Lead Demand
Industrial and institutional buildings captured 52.90% of total 2025 sales, and their 4.42% CAGR through 2031 indicates that specification sophistication is rising faster than in other sectors. Clean-process manufacturing lines in electronics, aerospace, and biopharma insist on coatings that fuse ESD control, chemical resistance, and antimicrobial functionality. The United States floor coatings market size tied to data-center corridors in Texas and the Midwest is accelerating as operators roll out hyperscale campuses requiring conductive raised floors.
Commercial venues benefit from the 8.6% construction-start surge, with healthcare and office retrofits motivating antimicrobial and decorative overlays. Residential remodeling lags yet holds latent upside once mortgage rates normalize, particularly for garages and basements retrofitted with waterborne epoxies or flake-broadcast polyaspartic systems. Institutional budgets for schools and municipal buildings remain sensitive to capital-outlay cycles; nonetheless, deferred maintenance translates into resurfacing projects that favor turnkey resin packages compatible with rapid project schedules.
Regulatory Landscape
Floor coatings sold in the United States operate under a layered air-emissions regime that combines federal VOC product standards with tighter state and local limits. Under the US Environmental Protection Agency (EPA) Architectural Coatings Rule (40 CFR Part 59, Subpart D), VOC limits are set by product category definitions (measured using EPA Method 24) rather than marketing names, with floor coatings capped at 400 g/L and industrial maintenance coatings at 450 g/L. California and local districts such as the South Coast Air Quality Management District (SCAQMD) then apply tighter limits, including Rule 1113 at 50 g/L for certain categories. This patchwork pushes national suppliers toward high-solids and waterborne chemistries so a single SKU can meet the most restrictive jurisdictions.
Manufacturing and installation also face operational compliance requirements. Coating producers can fall under EPA National Emission Standards for Hazardous Air Pollutants (NESHAP) for Miscellaneous Coating Manufacturing (40 CFR Part 63), reinforcing controls around hazardous air pollutants at plant level. OSHA workplace requirements further drive Safety Data Sheets, ventilation, and PPE practices during mixing and application. Together, these rules raise the value of compliant system packages, documented application procedures, and contractor training, particularly for industrial and institutional sites that specify ESD and antimicrobial performance alongside low-VOC credentials.
Value Chain Analysis
The value chain begins with upstream petrochemical and specialty chemical inputs, including epoxy resins, polyols and isocyanates for urethanes and polyaspartics, plus additives, pigments, and fillers that tune cure speed, slip resistance, and chemical durability. These inputs flow into formulation and compounding at integrated multinationals and specialist resinous-flooring formulators, where compliance constraints (EPA architectural coatings categories and tighter state VOC caps) increasingly shape solvent choice, solids content, and packaging formats.
Downstream, go-to-market generally combines direct specification selling to industrial and institutional owners, distribution through paint and construction channels, and partnerships that place resinous systems in front of flooring specifiers. Jobsite execution is service-led, with certified installers handling substrate testing, surface preparation (including moisture mitigation), multi-layer application, and commissioning to meet performance requirements such as ESD control and antimicrobial or chemical resistance. Contractor availability and certification programs create a practical bottleneck, influencing installation quality, project cycle time, and warranty outcomes.
Competitive Landscape
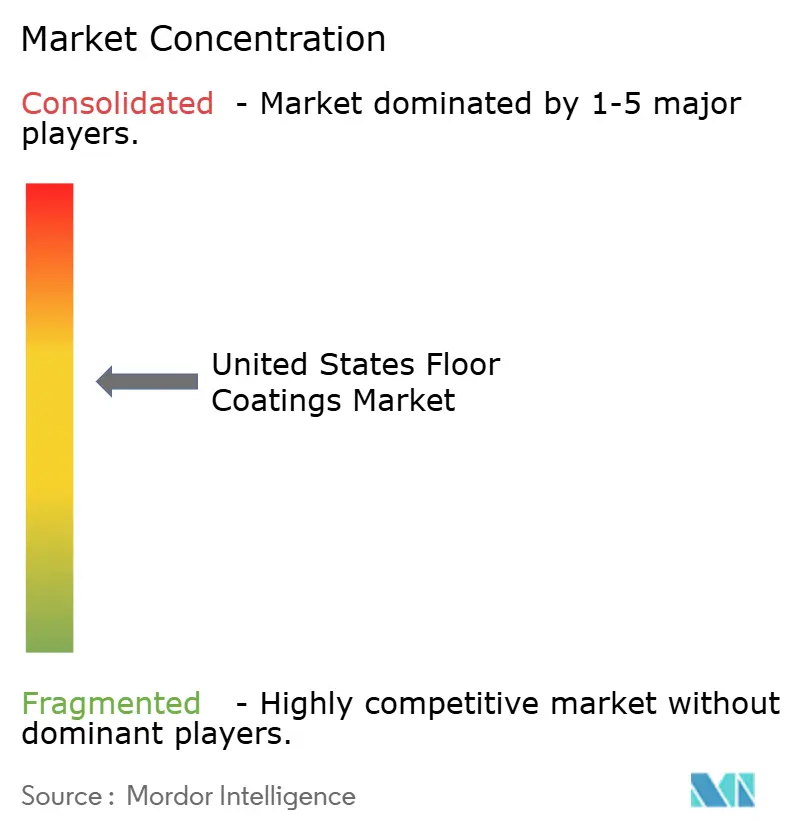
The United States Floor Coatings market is moderately consolidated with the presence of major players, such as the Sherwin-Williams Company, BASF, PPG Industries Inc., Sika AG, and RPM International Inc. Sherwin-Williams posted USD 18.44 Billion in global coatings revenue for 2023 and further solidified its resinous-flooring portfolio by acquiring Dur-A-Flex. PPG pursued a channel strategy, partnering with Shaw Industries’ Patcraft brand to tap established commercial-flooring specifiers. RPM International, via its Carboline and Stonhard units, leverages differentiated chemistries to serve industrial niches. Price competition intensifies during resin cost spikes, yet large players hedge with multi-year supply accords. Installer capability is an increasingly strategic lever. All three leading suppliers run certification academies that teach surface prep, moisture mitigation, and multi-layer installation, thereby locking in brand loyalty among contractors.
United States Floor Coatings Industry Leaders
-
The Sherwin-Williams Company
-
Sika AG
-
BASF
-
PPG Industries Inc.
-
RPM International Inc.
- *Disclaimer: Major Players sorted in no particular order
Market Opportunities and Future Outlook
Low-VOC reformulation continues to be a key whitespace, since federal EPA category limits and tighter local programs (notably SCAQMD Rule 1113 at 50 g/L) narrow the viable solvent-based design space while industrial users still demand chemical and abrasion performance. That dynamic creates room for suppliers that can standardize high-solids and waterborne resinous systems across multi-state contractor footprints, reducing SKU complexity for distributors and cutting compliance friction for applicators working in California and across Northeast-style VOC regimes.
Industrial and institutional end uses keep expanding the technical specification envelope, which improves the payoff for fast return-to-service systems and application support. Sherwin-Williams is also commercializing dedicated solutions for clean and dry rooms in EV battery manufacturing facilities, reinforcing demand for coatings that combine ESD properties with resistance to harsh process chemicals. On the supply side, Sika cited 2026 facility investments in the United States, including new mortar and admixture facilities in New Jersey and Florida, which supports adjacent construction-chemistry ecosystems that share contractor networks and project channels with resinous flooring, reinforcing the conditions for bundled system selling and field technical service in high-growth construction corridors.
Recent Industry Developments
- April 2026: SIKA AG announced its Q1 2026 media release and strategic update. The release signals ongoing performance review and market expansion plans affecting supply chain and capacity decisions. The update indicates a continued focus on expanding coatings and adhesives footprint across regions.
- February 2026: SIKA expands its global manufacturing footprint with new plants. The company is adding manufacturing capacity for coatings/adhesives to support regional demand and production planning. The expansion strengthens its global production footprint to support regional demand and pricing power.
- February 2026: Sika AG - Opened a new state-of-the-art concrete admixture facility in Haines City, Florida, utilizing high-level automation to produce concrete performance technologies. The expansion strengthens regional production capacity for specialty admixtures and supports faster delivery to construction projects. The development enhances Sika's ability to meet rising demand for performance concrete solutions.
Research Methodology Framework and Report Scope
Market Definition and Coverage
For this study, the market covers the value of floor coating materials sold and applied in the United States for protecting and finishing floors across residential, commercial, and industrial or institutional buildings.
Scope exclusions: It excludes floor coverings (tiles, carpet, wood planks) and adhesives or underlayment products that are not sold as floor coating systems.
Segmentation Overview
- By Product Type
- Epoxy
- Polyurethane
- Polyaspartic
- Acrylic
- Others
- By Floor Material
- Concrete
- Wood
- Others
- By End-use Industry
- Industrial/Institutional
- Commercial
- Residential
Data Sources, Market Sizing, and Validation
Desk Research
Desk research was used to set the demand context and build a clean starting structure for the sizing model before interviews. We reviewed construction and refurbishment indicators, coatings and chemical production signals, and trade movement where relevant, so the demand side and supply side were not treated separately.
Public and official sources such as the U.S. Census Bureau construction spending and building permits, Bureau of Labor Statistics producer price indexes, U.S. International Trade Commission trade statistics, Environmental Protection Agency (EPA) VOC guidance, and the National Institute of Standards and Technology (NIST) publications were used to anchor key assumptions. We also checked company annual reports, investor presentations, and reputable industry press, and then used paid subscriptions for company financial intelligence, patent lookups, and shipment level import-export checks when a data gap needed confirmation. The desk sources listed here are illustrative, and additional public and paid references were used for cross-checks and clarification.
Primary Interviews and Surveys
We interview manufacturers, resin suppliers, distributors, flooring contractors, specifiers, facility managers, and other informed participants in the United States. Their input helps test secondary demand signals and clarify product mix, pricing, channel flows, and application rates. These discussions also help narrow assumptions before the final analysis.
Distribution of primary research fieldwork respondents
| Company type | Respondent position |
|---|---|
| Top tier: 29% | CXOs: 22% |
| Mid tier: 46% | Functional/Unit leaders: 31% |
| Smaller Players: 25% | Managers: 47% |
Market-Sizing & Forecasting
Market sizing started with a top-down build where U.S. construction and refurbishment activity was translated into a coatings demand pool, then filtered by the share of floors that typically receive protective or decorative coating systems. We corroborated the results with selective bottom-up checks, including sampled price per square foot by system type and channel checks on volumes moving through major routes to market, which helped adjust totals when early outputs looked too high or too low.
Key inputs we tracked included nonresidential construction starts and spending, industrial and commercial floor area added or renovated, maintenance and recoat cycles by facility type, observed mix shifts across epoxy, polyurethane, polyaspartic, and acrylic systems, and average selling price movement linked to resin and additive cost direction. Where bottom-up cuts were incomplete for smaller contractors or local distributors, we used coverage ratios validated in interviews, then tested them against realistic application rates and project frequency.
For forecasting, we used scenario analysis tied to construction outlook, renovation intensity, and resin system substitution trends, and reviewed the variable paths with industry practitioners to keep the forward view workable. The final forecast was kept in value terms, with price and volume effects separated so changes in project count were not confused with inflation driven price lift.
Data Validation & Update Cycle
Validation was done through triangulation across demand indicators, supply signals, and interview based reality checks, and then reviewed again for outliers before sign-off. If the model implied a sudden jump in value without a matching change in construction activity, coating mix, or pricing, we revisited the assumptions and re-checked the inputs.
We follow a multi-step internal review so calculations, units, and year alignment stay consistent across the model. Reports are refreshed annually, and interim updates are made when material events occur, such as major regulatory changes affecting VOC formulations or sharp raw material cost swings. Before delivery, a final analyst pass is completed so clients get the most current view available at that time.
Mordor Intelligence's Unitedstates Floor Coatings Market Size Versus Other Published Estimates
Published estimates for U.S. floor coatings can vary because the boundary is not always consistent, and because firms use different base years, price assumptions, and update timings. Differences also show up when one estimate is closer to coatings material sales, while another implicitly mixes in installation or adjacent flooring chemicals.
By tracking system-level mix and refreshing price assumptions against U.S. construction signals, Mordor Intelligence keeps the total aligned to coating materials used on concrete and other floor substrates, before installer margin or non-coating floor products are added.
Benchmark comparison
| Source | Market Size | Gaps in Research Methodology |
|---|---|---|
| Mordor Intelligence | USD 1.91 B (2025) | |
| Industry Publisher A | USD 4.80 B (2026) | Uses a broader boundary that can blend multiple flooring chemical categories and may capture installed system value, which expands the total beyond coating materials only. |
| Regional Publisher B | USD 4.50 B (2024) | Defines a wider construction flooring chemicals pool and applies a higher value base that likely includes non-coating components, creating a larger headline number versus a coatings-only scope. |
The spread across the table is mainly explained by what gets counted and how pricing is treated in the base year. When the scope is held to coating materials and checked against realistic application and recoat behavior, the market size becomes easier to reproduce and to track over time.
Key Questions Answered in the Report
What is the estimated value of the United States Floor Coating sales in 2026?
Sales are pegged at USD 1.99 Billion, with expansion projected through 2031.
What compound annual growth rate is forecast between 2026 and 2031?
Total sales are projected to advance at a 4.12% CAGR over the five-year period.
Which resin type shows the fastest growth momentum?
Polyaspartic formulations lead with a 5.52% CAGR, driven by rapid cure times and low-VOC profiles.
What makes polyaspartic systems attractive for commercial projects?
These coatings cure and accept traffic within hours, minimizing facility downtime while meeting stringent environmental limits.
How do state VOC limits affect formulation strategies?
States such as California cap VOC content at 100 g/L or 50 g/L under South Coast Rule 1113, forcing suppliers to invest in high-solids and waterborne chemistries.