
Market Overview
| Study Period | 2021 - 2031 |
|---|---|
| Forecast Data Period | 2026 - 2031 |
| Historical Data Period | 2021 - 2024 |
| Market Size (2026) | USD 12.87 Billion |
| Market Size (2031) | USD 16.08 Billion |
| Growth Rate (2026 - 2031) | 4.55 % |
| Market Concentration | Medium |
Major Players *Disclaimer: Major Players sorted in no particular order Image © Mordor Intelligence. Reuse requires attribution under CC BY 4.0. | |
United States Yogurt Market Analysis by Mordor Intelligence
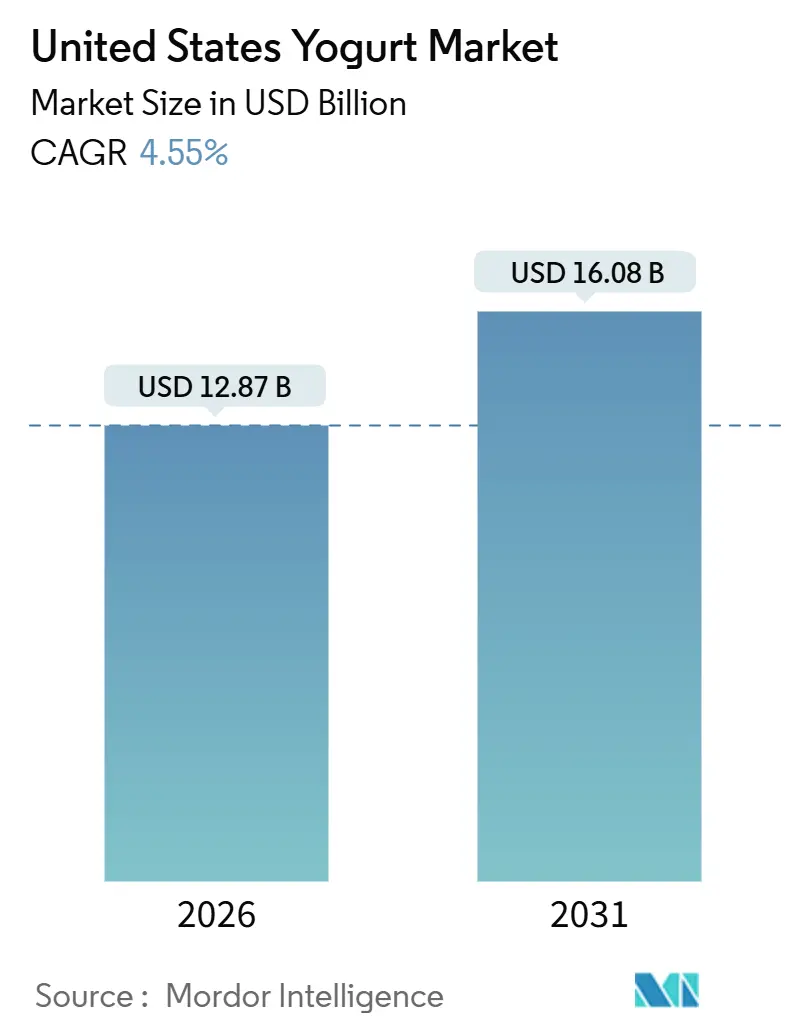
The United States yogurt market size is estimated to be valued at USD 12.87 billion in 2026 and is projected to reach USD 16.08 billion by 2031, advancing at a 4.55% CAGR during the forecast period. Growth is supported by consumers shifting breakfast and snacking habits toward higher-protein formats, an accelerating pivot into plant-based alternatives, and distribution gains for shelf-stable drinkable products. Price-tier segmentation is also widening, with premium Greek, Icelandic, and oat-based SKUs co-existing alongside value multipacks. Leading companies are expanding portfolios through vertical integration, aseptic processing, and proprietary probiotic strains, while regional dairies protect share by emphasizing local sourcing. Regulatory pressure around added sugar disclosures and volatile milk input costs continues to rationalize low-margin flavored lines, yet the strongest brands leverage reformulation agility to maintain shelf space.
Key Report Takeaways
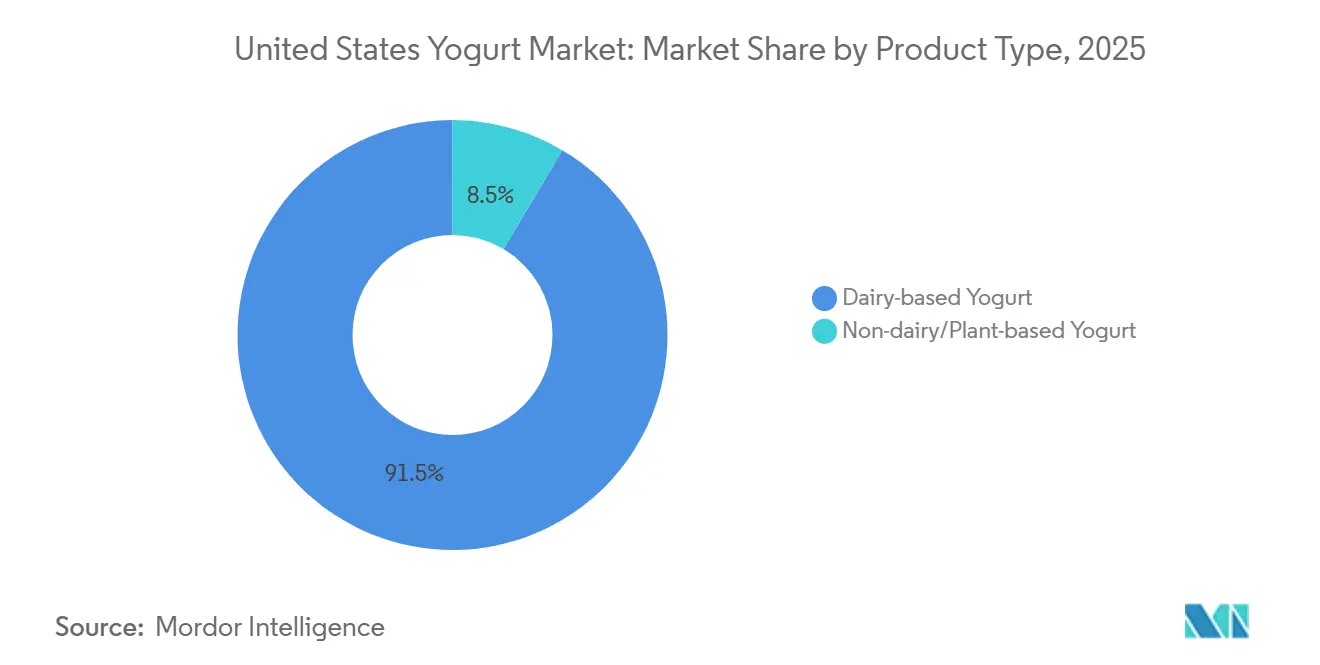
- By product type, dairy-based yogurt accounted for 91.47% of the United States yogurt market share in 2025, whereas non-dairy alternatives are expected to expand at a 6.63% CAGR through 2031.
- By product form, spoonable yogurt retained 80.72% revenue share in 2025, while drinkable formats are forecast to grow at a 5.56% CAGR through 2031.
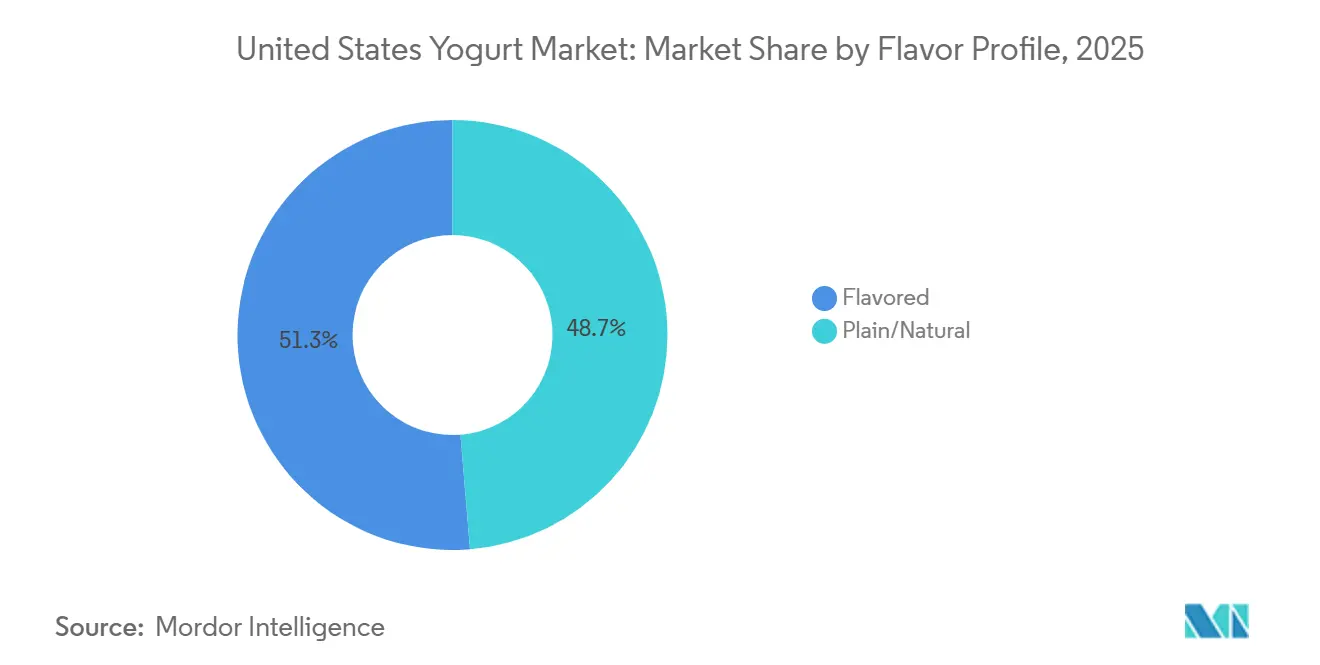
- By flavor profile, flavored varieties led with 51.29% share in 2025; plain and natural yogurt is advancing at a 4.81% CAGR through 2031.
- By packaging type, cups, containers, and tubs held a 65.13% share in 2025; tetra packs and pouches exhibit the fastest growth at a 6.48% CAGR through 2031.
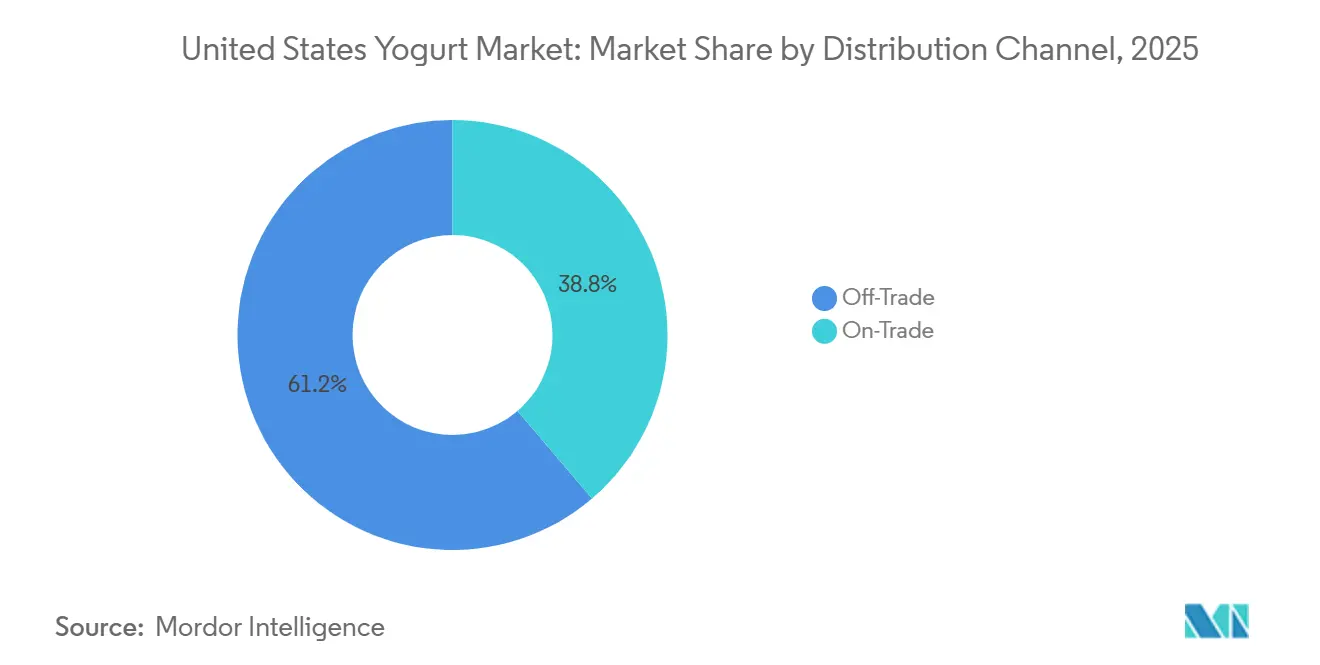
- By distribution channel, off-trade accounted for 61.24% of 2025 sales, but on-trade outlets are anticipated to post a 6.46% CAGR through 2031.
- By geography, the South captured 31.38% of nationwide volume in 2025, while the Northeast is the fastest-growing region at a 4.75% CAGR through 2031.
Note: Market size and forecast figures in this report are generated using Mordor Intelligence’s proprietary estimation framework, updated with the latest available data and insights as of January 2026.
United States Yogurt Market Trends and Insights
Drivers Impact Analysis*
| Driver | (~) % Impact on CAGR Forecast | Geographic Relevance | Impact Timeline |
|---|---|---|---|
| Growing market demand for high-protein Greek yogurt among millennials | +1.0% | National, with concentration in Northeast and West Coast urban centers (New York, Boston, San Francisco, Los Angeles) | Medium term (2-4 years) |
| Leveraging local fruit-based flavor innovations to drive yogurt sales | +0.6% | Regional focus in West (California, Oregon, Washington) and Northeast (New York, Vermont, Massachusetts), with spillover to Midwest berry-growing states | Medium term (2-4 years) |
| On-the-go breakfast trends supporting growth in drinkable yogurt products | +0.9% | National, strongest in metropolitan areas with average commute times exceeding 30 minutes; concentrated in Northeast corridor and West Coast | Short term (≤ 2 years) |
| Increased consumer interest in lactose-free and digestive health claims driving non-dairy yogurt alternatives | +1.4% | West Coast leadership (California 14% non-dairy share), expanding to Northeast urban markets and progressive Midwest cities | Long term (≥ 4 years) |
| Focus on clean-label and locally sourced ingredients to meet sustainability goals | +0.7% | National, with premium positioning in Northeast and West Coast; strongest in organic-certified retail channels | Long term (≥ 4 years) |
| Probiotic and immunity-focused fortification leading new product development | +0.8% | National, with premium positioning in Northeast and California; accelerated by post-pandemic health consciousness | Medium term (2-4 years) |
| Source: Mordor Intelligence | |||
Growing market demand for high-protein Greek yogurt among millennials
Millennials are a significant driver of growth for high-protein Greek yogurt, combining strong health and protein-seeking behaviors with a preference for convenient, flavorful, and ethically positioned products. Brands are actively innovating and tailoring their messaging to appeal to this demographic. According to the United States Census Bureau and related demographic estimates, Millennials were the largest generational group in the United States in 2024, accounting for approximately 21.81% of the population [1]. This demographic influence positions Millennials as a primary target for Greek yogurt, which is increasingly marketed as an everyday high-protein snack rather than a niche fitness product. The rising adoption of high-protein diets and interest in satiety and muscle recovery have shifted consumer preferences toward products with higher protein content. Greek yogurt, with its naturally higher protein density compared to regular yogurt, aligns well with these wellness priorities. Brands like Chobani have normalized Greek yogurt as a mainstream, lower-sugar, high-protein option in breakfast and snacking routines, reinforcing its perception as a functional and convenient nutritional choice. To maintain engagement, brands focus on flavor innovation and textural variety, as seen in Danone’s Oikos line, which has refreshed recipes, textures, and packaging to enhance its appeal. Digital-first, omnichannel marketing strategies, such as Oikos’ campaigns across social media, influencer partnerships, and online video platforms, effectively reach Millennials, strengthening the association between Greek yogurt and aspirational, lifestyle-driven branding. Sustainability and quality cues, such as non-GMO ingredients and "cleaner" ingredient narratives, further resonate with Millennials' values-based consumption patterns, positioning Greek yogurt as a premium yet accessible choice and a key driver of growth in the United States yogurt market.
Leveraging local fruit-based flavor innovations to drive yogurt sales
Local fruit-based flavor innovations are a significant driver of yogurt sales, aligning health-focused attributes with taste-driven, regionally relevant experiences that encourage both trial and repeat purchases. Incorporating locally familiar and seasonal fruits enables brands to differentiate in a competitive chilled aisle. Traditional flavors such as strawberry, blueberry, and peach remain central to the segment while creating opportunities for localized or creative variations that cater to regional tastes. As taste is a critical factor for health-conscious consumers, developing fruit-forward recipes using recognizable United States fruit crops positions yogurt as a permissible indulgence, combining nutrition with authentic fruit flavors. For example, Chobani has expanded its offerings with fruit-centric and dessert-inspired flavors like strawberry, peach, mocha tiramisu, and apple pie a la mode variants, demonstrating how American fruit cues can be integrated into Greek and traditional yogurt formats to maintain category dynamism. This focus on local fruits also supports premiumization, as recipes featuring "real fruit" and carefully crafted pairings justify higher price points while signaling quality and freshness to consumers. Similarly, Noosa emphasizes fruit-rich profiles such as raspberry and strawberry-rhubarb, combining thick whole-milk yogurt with generous fruit preparations to reinforce an artisanal, farm-style positioning that appeals to consumers seeking both comfort and novelty in familiar fruit flavors. By introducing limited-time or regionally inspired fruit flavors, brands create urgency and discovery, encouraging consumers to explore different options within a portfolio rather than remaining loyal to a single SKU. These innovations enhance consumer engagement, strengthen brand identity, and drive volume and value growth by aligning yogurt consumption with everyday American fruit preferences and evolving flavor trends.
Increased consumer interest in lactose-free and digestive health claims driving non-dairy yogurt alternatives
Consumer interest in lactose-free and digestive health claims is driving the growth of non-dairy yogurt alternatives, as these products address lactose intolerance challenges and cater to the increasing focus on gut health through plant-based, probiotic-rich formulations. With digestive sensitivities on the rise, highlighted by the Centers for Disease Control and Prevention (CDC) estimates that 2.4 to 3.1 million Americans will be living with inflammatory bowel disease (Crohn’s disease and ulcerative colitis) in 2024, there is a growing need for accessible options that support gut health without dairy-related discomfort [2]. Lactose-free positioning eliminates a key barrier for consumers who value yogurt’s probiotic benefits but experience issues with traditional dairy, while non-dairy bases such as cashew, coconut, and almond provide the creamy texture and live cultures essential for digestive health. Forager Project exemplifies this trend with its organic, dairy-free cashew-coconut yogurts fermented with six strains of live active probiotics, including L. Plantarum and Bifidus, specifically designed to promote gut health. Prebiotic and probiotic fortifications further enhance the appeal, as consumers increasingly associate these attributes with improved gut microbiome balance, immunity, and regular digestion. Silk’s almond milk dairy-free yogurt alternative also supports this trend by offering a smooth, lactose-free option that integrates seamlessly into health-focused routines, appealing to those prioritizing allergen avoidance and digestive comfort. Clean label and plant-based attributes, including vegan, gluten-free, and additive-free claims, strengthen consumer trust, enabling non-dairy yogurts to compete directly with traditional dairy products. The convergence of rising digestive health concerns, lactose intolerance needs, and demand for bioavailable probiotics positions non-dairy yogurt alternatives as a high-growth segment, expanding access to gut health solutions for a broader consumer base.
Focus on clean-label and locally sourced ingredients to meet sustainability goals
Clean-label and locally sourced ingredients are increasingly aligning with sustainability objectives by promoting transparency and reducing environmental impact. This approach leverages minimal, recognizable components and shorter supply chains to appeal to label-conscious consumers. According to the National Science Foundation, in 2024, 83% of American consumers read food labels before making purchase decisions, with 64% paying more attention to labels compared to five years ago. Among these consumers, 79% prioritize the ingredients list, 78% look for health claims, and 77% check the allergen warnings [3]. This growing scrutiny positions clean-label yogurts with simple, locally sourced ingredients as a trusted choice over additive-heavy alternatives. Locally sourced milk, fruits, and cultures reduce carbon emissions associated with transportation while signaling freshness and ethical farming practices, creating a narrative of environmental responsibility that resonates with eco-conscious shoppers. Siggi’s exemplifies this approach with its low-fat Skyr yogurts, made using real fruit, simple ingredients, no preservatives or artificial sweeteners, and milk sourced from regional United States farms, emphasizing clean composition alongside lower-impact sourcing. Local sourcing also enhances clean-label appeal by enabling "made nearby" narratives, reducing packaging needs, supporting community agriculture, and positioning yogurt as a sustainable, everyday product. These ingredients further improve allergen transparency and provide non-GMO assurances, linking label readability with broader wellness and environmental goals, which drives interest among families and premium buyers. Stonyfield Organic reinforces this trend by using USDA organic, grass-fed milk from United States family farms without unnecessary additives, connecting clean-label simplicity with regenerative farming practices that improve soil health and biodiversity. The synergy of heightened label attention, clean formulations, and local sourcing positions yogurt brands as sustainability leaders, fostering growth through consumer-aligned values.
Restraints Impact Analysis*
| Restraint | (~) % Impact on CAGR Forecast | Geographic Relevance | Impact Timeline |
|---|---|---|---|
| United States milk price volatility exerting margin pressure on dairy yogurt producers | -0.7% | National, most acute in Midwest and Northeast dairy-producing regions (Wisconsin, Minnesota, New York, Pennsylvania); affects regional dairies disproportionately | Short term (≤ 2 years) |
| Rising input costs for SMEs driven by import tariffs on probiotic cultures | -0.4% | National impact on small and medium enterprises lacking domestic fermentation capacity; concentrated among brands sourcing cultures from Europe and Asia | Medium term (2-4 years) |
| Elevated cold-chain logistics expenses constraining e-commerce profitability | -0.3% | National, with highest impact in rural and low-density markets; affects direct-to-consumer brands and online-exclusive SKUs disproportionately | Short term (≤ 2 years) |
| FDA added-sugar labeling regulations restricting formulation options for flavored yogurt SKUs | -0.5% | National enforcement; compliance costs concentrated among smaller manufacturers with limited research and development budgets; institutional channel (schools, hospitals) most affected | Medium term (2-4 years) |
| Source: Mordor Intelligence | |||
United States milk price volatility exerting margin pressure on dairy yogurt producers
Milk price volatility has created significant challenges for dairy yogurt producers, disrupting pricing strategies and profitability. Between 2024 and 2025, milk prices paid to farmers fluctuated between USD 18.50 and USD 24.20 per hundredweight, a 31% variation driven by feed-cost inflation, drought in the Southwest, and export demand volatility, according to the USDA National Agricultural Statistics Service. These fluctuations directly impact producers, who face difficulties in passing on cost increases without risking consumer resistance or losing market share to plant-based competitors. Feed-cost inflation further compounds the issue by increasing overall production expenses, forcing manufacturers to either absorb losses or reformulate products with more expensive alternatives, which strains relationships with cooperatives and suppliers already managing herd-related challenges under volatile conditions. Companies like Chobani, heavily reliant on domestic dairy sourcing, encounter amplified difficulties as milk price swings erode the cost advantages of scale, prompting tighter inventory controls and hedging strategies that fail to fully offset financial pressures during peak drought periods. Drought conditions in the Southwest further restrict regional milk supplies, intensifying competition for high-quality fluid milk and raising logistics costs for cross-country transportation. Export demand volatility adds complexity, as milk is diverted to international markets during high-price periods, leaving domestic processors to contend with shortages or elevated spot market prices, undermining long-term margin stability. Smaller producers, lacking the bargaining power to secure fixed-price contracts, are particularly vulnerable, limiting their ability to invest in innovation within a category already under pressure from non-dairy alternatives. These interconnected factors constrain producers’ agility, limit growth potential, and drive a shift toward more resilient product formulations.
Rising input costs for SMEs driven by import tariffs on probiotic cultures
Import tariffs on probiotic cultures have significantly increased input costs for small and medium-sized enterprises (SMEs), creating substantial challenges in the yogurt industry. These tariffs disproportionately impact smaller producers, who lack the scale to absorb or negotiate the higher costs of essential live culture imports. The increased tariffs raise the price of specialized probiotic strains, often sourced from Europe or Asia, leading to higher formulation expenses. SMEs are frequently compelled to either increase retail prices, risking shelf-space loss to larger competitors, or compromise product quality by opting for cheaper domestic alternatives with lower efficacy. This cost pressure is compounded by supply chain vulnerabilities, as smaller producers rely on consistent culture availability to ensure fermentation consistency. Tariff-induced delays or shortages disrupt production schedules and batch reliability, further straining operations. For instance, Maple Hill Creamery, a smaller producer specializing in 100% grass-fed organic dairy yogurt, faces rising probiotic sourcing costs that erode its premium clean-label margins, forcing tighter cost controls amid competition from larger, tariff-resilient players. Without the ability to leverage bulk purchasing or hedging strategies, SMEs struggle to maintain the probiotic potency claims that differentiate their products in a health-conscious market, widening the competitive gap with larger brands benefiting from favorable import terms. Tariff volatility also discourages innovation in functional probiotic blends, as SMEs hesitate to invest in research and development for advanced strains due to unpredictable costs, slowing advancements in the category. These challenges, combined with margin pressures from other inputs like milk, push smaller producers toward consolidation or niche strategies, while larger players strengthen their dominance through diversified supply networks that mitigate tariff impacts.
*Our forecasts treat driver/restraint impacts as directional, not additive. The impact forecasts reflect baseline growth, mix effects, and variable interactions.
Segment Analysis
By Product Type: Dairy Dominance Masks Plant-Based Velocity
Dairy-based yogurt maintains a dominant position in the yogurt market and accounted for 91.47% of the market share in 2025. This dominance is attributed to established consumer preferences, a mature cold-chain infrastructure, and cost advantages over non-dairy alternatives. In 2025, dairy yogurt was expected to average USD 0.85 per pound, significantly lower than the USD 2.10 per pound for plant-based options. These cost efficiencies enable dairy brands to adopt competitive pricing strategies and sustain high household penetration. Additionally, milk’s natural compatibility with probiotic fermentation supports the growth of cultures like Lactobacillus without extensive fortification, reinforcing its digestive health benefits at a lower production cost. Greek yogurt leads the dairy segment, offering a thick, strained texture and high protein content that aligns with consumer preferences for satiety and fitness-oriented diets. Icelandic skyr further enhances the premium dairy segment, with brands like Siggi’s and Icelandic Provisions emphasizing higher protein density and lower sugar content, appealing to health-conscious consumers. Together, these subcategories, regular, Greek, and skyr, create a competitive hierarchy within the dairy segment.
Non-dairy yogurt, while representing a smaller share, is expanding rapidly with a projected CAGR of 6.63% through 2031. Growth is driven by oat, almond, and coconut-based formulations targeting lactose-intolerant consumers, vegans, and flexitarian shoppers. Plant-based matrices require fortification with Lactobacillus strains and stabilizers to achieve comparable texture and colony-forming unit (CFU) levels, contributing to higher production costs. However, advancements in oat and almond processing are narrowing the cost gap, enabling more competitive pricing. Brands such as Silk and Forager Project exemplify this growth, offering plant-based yogurts with added live cultures to replicate dairy’s probiotic benefits while addressing allergen and ethical concerns. Although non-dairy yogurt has not displaced dairy’s dominance, it is reshaping shelf space allocation as retailers dedicate more facings to plant-based lines to meet rising demand. The market reflects a stable dairy foundation alongside the rapid growth of non-dairy alternatives, positioning both segments to coexist and compete for health-conscious and sustainability-focused consumers.
By Product Form: Drinkable Formats Capture Convenience Premium
Spoonable yogurt accounted for 80.72% of the yogurt market share in 2025, supported by its role in established breakfast and snack routines. Its adaptable texture makes it suitable for mixing with toppings or consuming on its own. Single-serve cups, typically sized between 5.3 and 6 ounces, dominate this category due to their portion control and convenience, appealing to consumers with busy lifestyles who prefer mess-free options. Multi-serve tubs, ranging from 24 to 32 ounces, cater to households that incorporate yogurt into cooking or daily meals, offering bulk value for meal preparation and versatile use. However, family-size containers exceeding 48 ounces are declining in popularity, reflecting the trend of smaller household sizes and the rise of single-person homes, which favor smaller formats to minimize waste and align with reduced consumption needs. Brands such as Chobani maintain their leadership in this segment by offering single-serve Greek yogurt cups that emphasize protein-rich convenience, while larger tubs support home-based consumption with clean-label attributes. This segmentation ensures a balanced portfolio that sustains market stability despite competition from alternative formats.
Drinkable yogurt formats are projected to grow at a 5.56% CAGR through 2031, driven by their portability and suitability for on-the-go consumption. Single-serve bottles, typically sized between 8 and 12 ounces, are designed to fit into vehicle cup holders and remain stable for 2-3 hours without refrigeration after opening, making them ideal for commuters and gym-goers. Although packaging costs for bottles (12-15 cents per unit) are higher compared to cups (6-8 cents per unit), brands offset these costs through 20-30% price premiums. This allows drinkable yogurt to be marketed as a functional beverage, emphasizing added nutritional benefits such as probiotics, and competing with smoothies and protein shakes. Danone’s Oikos drinkable line exemplifies this trend by offering high-protein shakes in portable bottles, targeting active consumers and blending the familiarity of yogurt with the convenience of a shake. Drinkable yogurt formats are gradually capturing market share by addressing unmet convenience needs, fostering a dual-format ecosystem where both spoonable and drinkable options coexist to expand overall yogurt consumption occasions.
By Flavor Profile: Plain Gains as Culinary Use Expands
Flavored yogurt accounted for 51.29% of the market share in 2025, driven by enduring consumer preferences for flavors such as strawberry, blueberry, and vanilla. These options appeal to everyday snacking habits with their familiar and indulgent taste profiles. Blended formats dominate this segment due to their convenience and consistent flavor distribution, eliminating the need for stirring and aligning with fast-paced lifestyles. However, fruit-on-the-bottom varieties have experienced a decline in popularity following the FDA's January 2025 added-sugar labeling rules, which reclassified fruit compote sugars as "added," highlighting higher sugar content that deters health-conscious consumers. Mix-in formats, while offering customization and interactive appeal, remain smaller in scale compared to blended options. Brands like Noosa exemplify success in this category with their thick, fruit-rich blended yogurts, such as raspberry and strawberry-rhubarb, which combine real fruit layers with the convenience that consumers prioritize. Despite its leadership, the flavored yogurt segment faces increasing scrutiny over sugar content.
Plain and natural yogurt is projected to grow at a compound annual growth rate (CAGR) of 4.81% through 2031, driven by its versatility in culinary applications such as marinades, sauces, and baking. It also offers customization opportunities when paired with fresh fruit or granola, catering to consumers seeking tailored nutrition. The shift toward clean-label products has further accelerated plain yogurt's growth, particularly following the FDA's January 2025 labeling rules, which revealed that a 6-ounce flavored yogurt cup often contains 12-18 grams of added sugar. This transparency has prompted many consumers to switch to unsweetened options. Plain yogurt’s neutral profile enhances its versatility in cooking and supports at-home personalization, avoiding the added sweetness flagged on labels. Siggi’s has capitalized on this trend with its high-protein skyr in natural form, appealing to consumers prioritizing lower-sugar, clean-ingredient options. This growth trajectory is gradually reshaping market dynamics, shifting focus toward functional, unsweetened products that empower consumers to make informed dietary choices.
By Packaging Type: Shelf-Stable Formats Unlock New Channels
Cups, containers, and tubs accounted for 65.13% of the packaging share in 2025, driven by their established role in household storage and spoonable consumption. These formats benefit from mature filling lines and strong consumer familiarity, making them a reliable choice for daily breakfast and snack routines. Single-serve cups provide portioned convenience, while larger tubs cater to family meal preparation and ingredient use, ensuring versatility and retail stability. Bottles, primarily used for drinkable yogurt, maintain a notable share through 8-12 ounce single-serve PET designs that offer resealability and portability for on-the-go consumption. Sustainability efforts are also shaping the market, with Chobani committing to 100% recyclable cups and Stonyfield transitioning to plant-based Polylactic Acid (PLA) cups, which reduce carbon footprints while maintaining the structural integrity required for chilled dairy transport. However, multi-material designs, such as foil lids on plastic cups, continue to hinder recycling efforts, with yogurt packaging recycling rates remaining low in 2025 despite technical recyclability.
Tetra packs and pouches are gaining traction, with a projected CAGR of 6.48% through 2031, supported by shelf-stable innovations that expand distribution beyond cold-chain limitations. Tetra Pak's aseptic processing technology enables yogurt to remain unrefrigerated for 6-9 months, reducing logistics costs and facilitating broader distribution in e-commerce, dollar stores, and gas stations. Pouches are particularly popular in the children's snack segment, with products like Go-Gurt and Stonyfield YoKids offering squeezable, spoon-free formats that prioritize convenience for parents and mess-free fun for children. Tetra packs also achieve higher recycling rates, up to 70% in municipalities equipped for paperboard recycling, outpacing multi-material cups. By combining portability with extended shelf life, these formats allow brands to explore new consumption occasions without cannibalizing core refrigerated sales, driving market growth, and aligning with sustainability trends.
By Distribution Channel: On-Trade Recovery Accelerates
Off-trade channels accounted for 61.24% of yogurt sales in 2025, with supermarkets and hypermarkets leading due to high purchase frequency. On average, households purchase yogurt 18 times annually, supported by promotional efforts, where 38% of volume is sold on deals. These factors enable a wide product assortment and strategic endcap displays, positioning yogurt as a staple item. Convenience stores complement this by capturing impulse and on-the-go purchases, with drinkable yogurt formats driving sales among commuters seeking quick protein options. Online retail contributes to volume growth through subscription models like Thrive Market and Amazon Subscribe and Save, favoring multi-packs of 12-24 units to address cold-chain shipping challenges. Shelf-stable tetra packs also capture a share of e-commerce demand. Specialty stores and direct-to-consumer channels hold a smaller market share, but premium brands such as Arethusa Farm and La Fermière command higher price points, ranging from USD 3-4 per cup, through local delivery and artisanal appeal.
On-trade channels are anticipated to grow at a CAGR of 6.46% through 2031, driven by increased yogurt integration in hotels, cafés, and quick-service restaurants. Hotels have resumed breakfast services featuring yogurt stations with customizable toppings, while cafés offer layered parfaits that combine convenience with perceived freshness. Quick-service restaurants, such as Panera, include yogurt in health-focused menus, catering to consumers seeking portable, nutritious alternatives to carbohydrate-heavy options. Brands like Oikos support this growth by providing portioned, high-protein yogurt cups for grab-and-go consumption, aligning with retail protein trends. This expansion broadens yogurt consumption occasions beyond home use, balancing off-trade saturation and enhancing the overall market footprint.
Geography Analysis
The South region accounted for 31.38% of the yogurt market share in 2025, driven by a well-established dairy infrastructure in states such as Texas, Georgia, and North Carolina. Cooperatives like Dairy Farmers of America operate large-scale processing plants in the region, supplying major retailers including Walmart and Kroger. These facilities ensure a consistent supply of family-size formats and flavored yogurt varieties, which align with the region's strong breakfast and snack traditions. The focus remains on value-oriented multipacks rather than premium single-serve options. However, the region's heat and humidity increase cold-chain logistics costs by 8-12% compared to northern areas, impacting margins and slowing the adoption of temperature-sensitive probiotic-enhanced yogurts that require precise refrigeration. This logistical challenge reinforces the popularity of durable, flavored yogurt staples that withstand distribution demands while maintaining consumer loyalty. Brands like Fage utilize Southern production facilities to efficiently distribute Greek yogurt, which aligns with regional snacking preferences without the challenges associated with probiotics.
The West region, led by California, is recognized for its leadership in plant-based yogurt, driven by an early adoption of alternative proteins and a sustainability-focused consumer base favoring oat and almond-based products. The region's ethnic diversity fosters flavor innovation, with options like mango, coconut, and matcha gaining popularity in states such as California and Washington. These flavors expand beyond traditional fruit profiles, catering to multicultural tastes. However, rural cold-chain gaps and high labor costs challenge local dairies, prompting a reliance on scalable plant-based innovations that mitigate milk price volatility. This combination of cultural diversity and cost pressures accelerates the growth of non-dairy yogurt, linking consumer preferences to resilient supply chains. Forager Project exemplifies this trend with its cashew-coconut yogurts tailored to West Coast tastes, reflecting the region's momentum in plant-based products and flavor experimentation.
The Midwest sustains steady growth, supported by its strong dairy heritage in states like Wisconsin, Minnesota, and Michigan. Cooperatives such as Tillamook and regional brands like Anderson Erickson achieve high household penetration through trusted, locally rooted production. This foundation supports consistent demand for spoonable and family-size yogurt formats, which align with the region's traditional routines. The focus remains on whole-milk and low-fat staples rather than trend-driven innovations. The scale of cooperatives enables competitive pricing and widespread distribution, fostering consumer loyalty in a region less influenced by coastal trends like plant-based alternatives. Heritage branding, combined with everyday practicality, sustains volume without relying on fleeting fads. Tillamook exemplifies this approach with its creamery-fresh yogurts that emphasize Midwest milk quality, appealing to families who prioritize authenticity over novelty.
Regulatory Landscape
Yogurt sold in the United States is governed by FDA standards of identity and labeling rules that shape formulation choices, claims, and SKU economics. Under 21 CFR 131.200, yogurt must meet compositional and acidity requirements, including pH of 4.6 or lower measured within 24 hours of filling. The FDA final rule amending the yogurt standard of identity became effective in 2023, with a uniform compliance date of January 1, 2024. This modernization expanded manufacturing flexibilities for ingredients categorized as safe and suitable (including certain sweeteners and stabilizers), supporting reformulation work focused on sugar disclosure pressure and texture stability in both spoonable and drinkable formats.
On the dairy economics side, USDA programs shape the operating environment for processors that depend on domestic milk sourcing. In February 2026, USDA Agricultural Marketing Service (AMS) issued an Advance Notice of Proposed Rulemaking (ANPR) seeking input on implementing mandatory dairy manufacturing cost and yield surveys, as directed by the One Big Beautiful Bill Act of 2025 (Pub. L. 119-21). Mandatory cost and yield reporting increases administrative requirements for yogurt manufacturers and can influence how processors document yields across high-protein lines that use ultra-filtration and strain-based processes.
Value Chain Analysis
The United States yogurt value chain begins with raw milk procurement from farms and cooperatives, then moves to ingredients and cultures sourcing, including probiotic strains. Processing follows, with standardization, pasteurization, and fermentation, and for Greek and skyr styles, straining or ultra-filtration to concentrate protein. Finished products are then packaged in cold-chain formats such as cups, tubs, and bottles, or in aseptic, shelf-stable formats like tetra packs that reduce refrigerated handling needs. Because yogurt is time and temperature sensitive, many producers use a regionalized model that emphasizes proximity to milk sheds and dense retail corridors, with refrigerated distribution into supermarkets, convenience stores, and foodservice, while e-commerce remains constrained by cold-chain shipping costs and packaging durability.
Processing and filling capacity is a key constraint, particularly for protein-dense lines that require specialized equipment and tight fermentation control. Capacity additions show that investment is concentrated at the processing node, with major manufacturers expanding production lines. In August 2025, Danone announced an expansion and upgrade at its Minster, Ohio, yogurt facility that includes a new production line. In January 2026, it began a USD 4 million expansion at its Fort Worth, Texas, facility to increase production capabilities. Chobani has also emphasized scaling domestic processing, including the April 2025 groundbreaking for a USD 1.2 billion dairy processing plant in Rome, New York (designed for up to 28 production lines and large daily milk intake) and a 2025-announced Twin Falls, Idaho expansion that lifts output, reinforcing that manufacturing footprint and regional logistics underpin shelf availability and assortment breadth.
Competitive Landscape
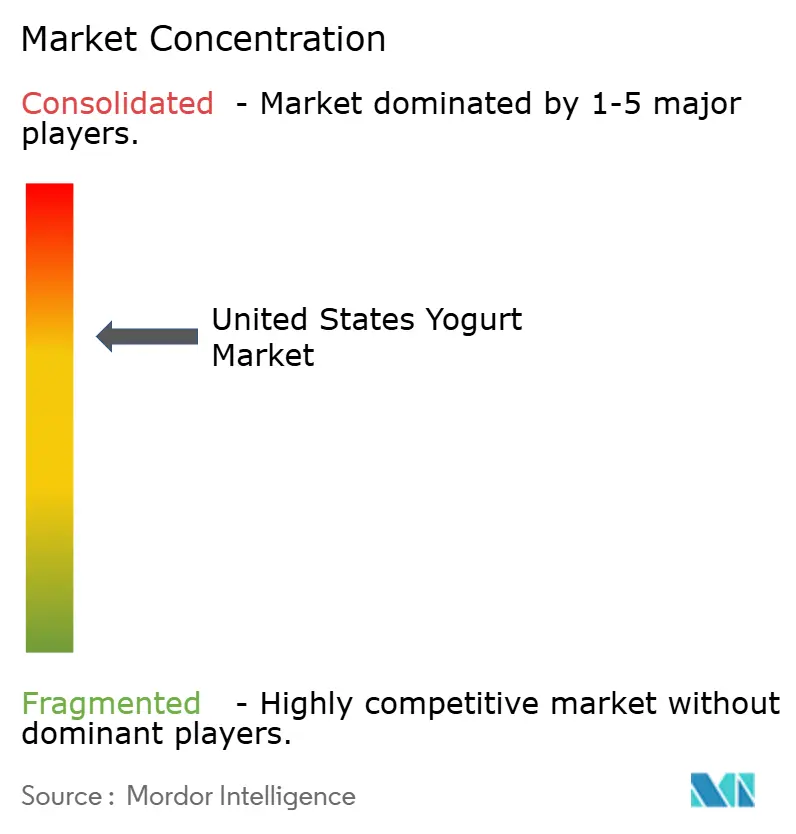
The yogurt market in the United States demonstrates moderate consolidation, with the top five companies, Danone, Chobani, Lactalis, FAGE, and Dairy Farmers of America, accounting for a major share of the market. This structure enables major players to leverage scale efficiencies and broad distribution networks to shape category trends. At the same time, smaller entities focus on niche segments with tailored offerings to avoid direct price competition. Danone employs a multi-brand strategy, including mass-market Dannon, premium Greek Oikos, and digestive health-focused Activia, to address diverse consumer needs while optimizing shared manufacturing infrastructure. Chobani capitalizes on vertical integration at its New York and Idaho facilities, achieving cost advantages and accelerating product launches, such as limited-edition flavors introduced within 90 days. Smaller brands like Siggi's differentiate themselves by targeting sugar-conscious consumers with products containing just 4-9 grams of total sugar per serving, contributing to a dynamic market environment.
Regional dairies and plant-based entrants sustain competitiveness by targeting niche markets and prioritizing premium pricing over high-volume strategies. Forager Project, for instance, caters to organic-certified plant-based consumers with cashew-coconut blends, addressing vegan and lactose-free demand without competing in mass-market channels. Similarly, La Fermière appeals to luxury-oriented consumers with French-style ceramic packaging and whole-milk indulgence, commanding a price of USD 3.50 per cup. These disruptors complement category growth by expanding plant-based and high-end indulgence segments, while avoiding direct competition with larger players. Siggi's sharpens its focus on low-sugar skyr, aligning with clean-label trends and drawing market share from traditional flavored yogurt lines, ensuring that specialization coexists with the dominance of top-tier players.
Technological advancements are a key differentiator among competitors. Leading companies utilize ultra-filtration to enhance protein concentration without heat damage, preserving nutritional integrity in dairy and blended formats. Aseptic processing facilitates shelf-stable tetra packs, reducing cold-chain dependency and expanding distribution opportunities for products like Danone's Activia drinks. Fermentation-control systems ensure consistent probiotic CFU counts, supporting health claims that justify premium pricing amid rising interest in digestive wellness. These technologies work synergistically; ultra-filtration improves spoonable yogurt, aseptic processing enhances drinkable formats, and fermentation controls stabilize probiotics, creating a robust foundation for competitive advantage. Chobani integrates these systems to maintain consistent Greek yogurt thickness and accelerate flavor innovation, reinforcing its market position. Investments in technology solidify the competitive hierarchy, driving efficiency and credibility in a market where formulation precision is essential.
United States Yogurt Industry Leaders
-
Chobani LLC
-
Danone S.A
-
Lactalis Groupe
-
FAGE International S.A.
-
Dairy Farmers of America Inc.
- *Disclaimer: Major Players sorted in no particular order
Market Opportunities and Future Outlook
Reformulation and segmentation are key areas where brands can differentiate as they respond to label scrutiny and price-tier polarization. The FDA yogurt standard-of-identity modernization, with a uniform compliance date of January 1, 2024, provides manufacturers more formulation flexibility within FDA-defined safe-and-suitable parameters. That supports efforts to rebalance sweetness, stabilize textures, and expand drinkable and kid-focused offerings without leaving the yogurt identity framework. This regulatory flexibility also aligns with growth in higher-protein formats such as Greek, skyr, and protein-forward drinkables, creating room for differentiated claims and sensory profiles that compete with protein shakes while remaining within the cultured dairy and plant-based yogurt definitions used across the category.
Manufacturing capacity additions and portfolio expansion actions indicate opportunity tied to domestic production scaling and distribution continuity. Danone’s plant investments, including the Minster, Ohio expansion announced in August 2025 and the Fort Worth, Texas expansion initiated in January 2026, along with Schreiber Foods’ March 2026 announcement of a USD 132.9 million expansion at its Shippensburg, Pennsylvania dairy facility to increase yogurt production, point to efforts to ease high-protein and high-velocity bottlenecks. Chobani’s large-scale buildout plans (Rome, New York) and expansion in Twin Falls, Idaho also reinforce that incremental production lines, fermentation control, and packaging throughput are central levers for growing high-protein, clean-label, and on-the-go formats in both off-trade and on-trade channels.
Recent Industry Developments
- June 2026: Danone and Chobani faced heightened competitive tension around protein positioning in U.S. yogurt, as highlighted by reporting on the intensifying battle for high-protein consumers. The attention around protein-related differentiation underscores how functional nutrition claims and product performance are central to share gains in Greek and drinkable subsegments.
- July 2025: Lactalis USA completed the acquisition of General Mills U.S. yogurt business, bringing brands such as Yoplait, Go-Gurt, Oui, and Ratio under Lactalis and forming a dedicated Midwest Yogurt division based in Minneapolis. The deal materially reshaped the branded competitive landscape and strengthened Lactalis distribution and portfolio breadth across mainstream and on-the-go kids formats.
- October 2024: Chobani launched a high-protein Greek yogurt lineup spanning cups and drink options, with cup formats positioned at 20 grams of protein and drinkable variants offered at multiple protein levels. This launch expanded protein-forward shelf presence and raised competitive intensity in the premium, functional segment where brands use protein density and portability to win breakfast and snacking occasions.
Research Methodology Framework and Report Scope
Market Definition and Coverage
This market covers the value of yogurt sold in the United States across retail and food-service, counted at the invoice price to first-level distributors. It includes spoonable, drinkable, frozen, and plant-based yogurts that are positioned and sold as yogurt.
Scope exclusions: We exclude mixed products where yogurt is less than 50% of the final formulation, such as many parfait-style items and yogurt-based dips.
Segmentation Overview
- By Product Type
- Dairy-based Yogurt
- Non-dairy/Plant-based Yogurt
- By Product Form
- Spoonable/Set Yogurt
- Drinkable Yogurt
- By Flavor Profile
- Plain/Natural
- Flavored
- By Packaging Type
- Cups, Containers and Tubs
- Bottles
- Tetra Packs and Pouches
- Others
- By Distribution Channel
- Off-Trade
- Supermarkets/Hypermarkets
- Convenience Stores
- Online Retail Stores
- Other Distribution Channels
- On-Trade
- Off-Trade
- By Geography
- Northeast
- Midwest
- South
- West
Data Sources, Market Sizing, and Validation
Desk Research
Desk work started with mapping the yogurt category boundary used in US labeling and trade reporting, and then lining it up with how products actually move through retail and food-service. We leaned on public sources such as USDA dairy and food availability data, FDA labeling and standards guidance, USITC tariff and trade statistics, and Bureau of Labor Statistics CPI series for dairy and related foods to understand category structure, pricing direction, and demand signals. Supporting context was added using Customs and Border Protection import documentation concepts, peer-reviewed nutrition and dairy-science journals, and state agriculture department publications where they clarified production and processing patterns.
Next, market context was sharpened using company annual filings and investor presentations, retailer and association publications, and credible press coverage on product claims like high-protein and low-sugar. Where needed, a paid subscription for company financials and intelligence and an import-export shipment-level database were used to cross-check supplier scale and trade flows. These sources are illustrative, and many additional public documents were also reviewed to fill gaps and confirm assumptions.
Primary Interviews and Surveys
Primary work focused on interviews and structured surveys with yogurt manufacturers, ingredient and packaging participants, distributors, and channel specialists across US grocery, club, convenience, and food-service. We used these inputs to validate price realization, mix shifts between spoonable and drinkable formats, and how plant-based yogurt is counted in practice when it is merchandised as yogurt.
Distribution of primary research fieldwork respondents
| Company type | Respondent position |
|---|---|
| Top tier: 26% | CXOs: 20% |
| Mid tier: 53% | Functional/Unit leaders: 36% |
| Smaller Players: 21% | Managers: 44% |
Market-Sizing & Forecasting
Sizing was built using a top-down and bottom-up approach where consumption direction, production cues, and trade signals were used to reconstruct the yearly value pool, and then adjusted by channel mix and pricing to match how yogurt is invoiced in the market. To keep the totals realistic, we also ran selective bottom-up checks using sampled brand and private-label price points, approximate volumes by format, and channel checks on distribution intensity, which helped flag overcounts when adjacent fermented products were blended in.
Key inputs that shaped the model included yogurt price inflation patterns from consumer price series, imported versus domestically supplied share, household purchase frequency signals where available in public releases, mix changes between spoonable and drinkable, and observed premiumization tied to protein-forward and low-sugar positioning. For forecasting, scenario analysis was used around price progression and mix shift, and the scenarios were tuned using consensus ranges heard in interviews so the growth path stays explainable and testable. When a sub-segment had limited visibility, we filled gaps using proxy variables like shelf-space direction and format-level growth cues, before being rechecked through expert follow-ups.
Data Validation & Update Cycle
Validation was done through triangulation across independent signals, including whether implied per-capita consumption and price trends stayed consistent with public indicators and interview feedback. Outliers were investigated with variance checks by format and channel, and then reviewed in more than one analyst pass before sign-off.
The report is refreshed annually, and interim updates are triggered when material events occur, such as labeling shifts, major pricing resets, or meaningful demand swings. Before delivery, a final data pass is completed so clients receive an up-to-date view with any late-breaking changes reflected in the model.
Mordor Intelligence's United States Yogurt Market Size Compared Against Other Published Estimates
Published market sizes for US yogurt can differ even when they look like they cover the same space, because the category boundary and the pricing level being counted are not always aligned. Differences also come from the base year chosen, how plant-based yogurt is treated, and whether food-service is counted the same way as retail.
By checking invoice-level pricing, channel coverage, and annual refresh timing, Mordor Intelligence keeps the 2026 value tied to spoonable, drinkable, frozen, and plant-based items sold as yogurt, which prevents adjacent fermented products and mixed snack kits from being counted in the same total.
Benchmark comparison
| Source | Market Size | Gaps in Research Methodology |
|---|---|---|
| Mordor Intelligence | USD 12.87 B (2026) | |
| Industry Data Publisher A | USD 10.60 B (2026) | Uses a narrower yogurt definition in parts of the model and does not clearly state alignment to invoice-to-distributor pricing across channels, which can compress the value total for the same year. |
| Trade Analytics Source B | USD 7.40 B (2024) | Anchors the market on producer and importer revenues at nominal wholesale prices, and it is reported for an earlier year, so it is not directly comparable without adjusting for price inflation and recent mix shifts. |
The spread is mainly explained by what gets counted as yogurt, which price layer is used, and whether the year is aligned to the same point in the pricing cycle. Our method stays repeatable because the assumptions are tied to observable price and demand signals, and then cross-checked with channel and format checks before being finalized.
Key Questions Answered in the Report
How large is the United States yogurt market in 2026?
The United States yogurt market size stands at USD 12.87 billion in 2026 and is projected to reach USD 16.08 billion by 2031.
Which segment is growing fastest within U.S. yogurt?
Non-dairy yogurt leads growth, registering a 6.63% CAGR through 2031, driven primarily by oat-based and almond-based launches.
What drives the popularity of drinkable yogurt in the United States?
Rising on-the-go breakfast occasions and convenience-store placement underpin the 5.56% CAGR forecast for drinkable formats.
Which U.S. region purchases the most yogurt?
The South holds the largest volume share at 31.38%, though the Northeast is currently the fastest-expanding region.