
Market Overview
| Study Period | 2020 - 2031 |
|---|---|
| Forecast Data Period | 2026 - 2031 |
| Base Year Market Size (2025) | USD 1.06 Billion |
| Market Size (2026) | USD 1.12 Billion |
| Market Size (2031) | USD 1.46 Billion |
| Growth Rate (2026 - 2031) | 5.47 % |
| Market Concentration | Low |
Major Players *Disclaimer: Major Players sorted in no particular order Image © Mordor Intelligence. Reuse requires attribution under CC BY 4.0. | |
United States Wine Packaging Market Analysis by Mordor Intelligence
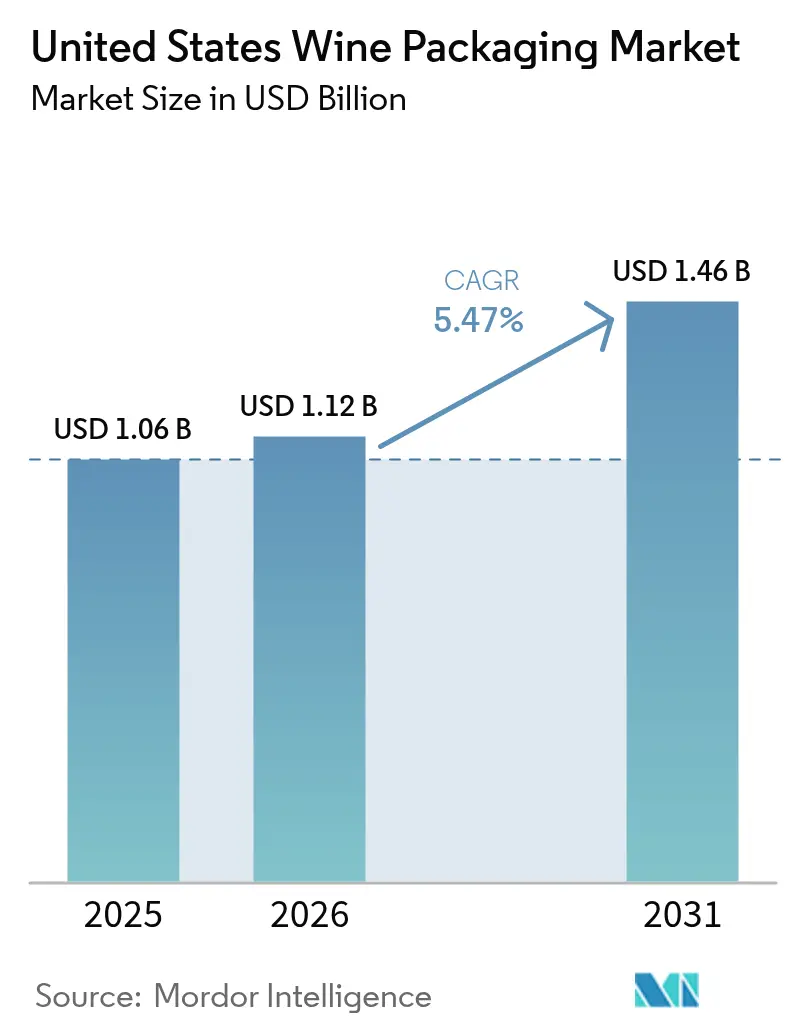
The United States wine packaging market size was valued at USD 1.06 billion in 2025 and estimated to grow from USD 1.12 billion in 2026 to reach USD 1.46 billion by 2031, at a CAGR of 5.47% during the forecast period (2026-2031). Regulatory expansion, stricter sustainability mandates, and omnichannel purchasing habits are reshaping material choices, forcing suppliers to balance premium cues with carbon-reduction goals. Deposit-return rules in California and Oregon, along with direct-to-consumer (DtC) shipping access in 47 states, are accelerating demand for lighter, more easily recycled containers that travel safely through parcel networks. Labor shortages in major wine regions are also nudging producers toward bulk-friendly formats that reduce manual handling requirements. Meanwhile, competitive dynamics are shifting as aluminum, paper, and refillable-glass specialists gain visibility at the expense of traditional heavy-glass suppliers that face margin pressure from volatile energy costs.
Key Report Takeaways
- By material type, glass held 66.65% of United States wine packaging market share in 2025, while metal is on track for the fastest 8.31% CAGR to 2031.
- By product type, glass bottles led with 56.12% revenue share in 2025; cans are projected to expand at a 7.74% CAGR through 2031.
- By closure type, natural cork accounted for 43.95% share in 2025 as screw caps record the top 7.98% CAGR to 2031.
- By wine type, still-wine formats commanded 67.55% of United States wine packaging market size in 2025, yet low and no-alcohol packaging is advancing at a 9.02% CAGR to 2031.
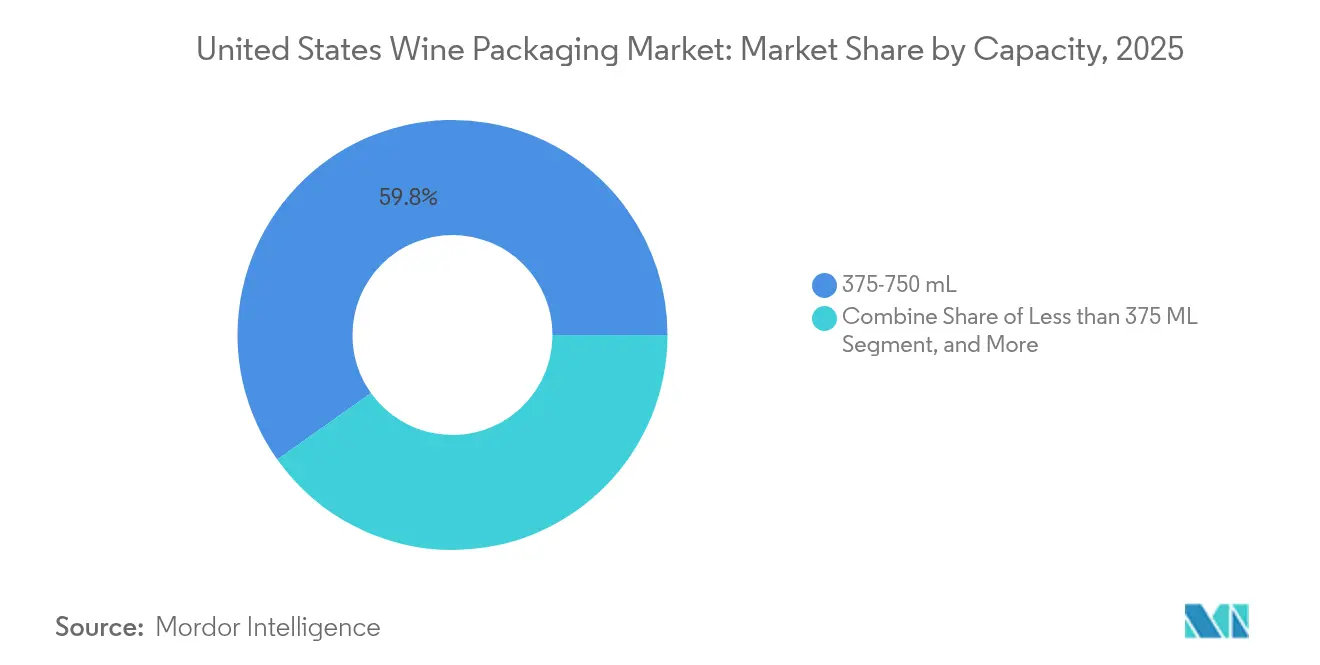
- By capacity, 375-750 mL units controlled 59.84% share in 2025; containers below 375 mL are expected to rise at a 7.41% CAGR to 2031.
- By distribution channel, direct sales represented 57.92% share in 2025, whereas indirect retail outlets are forecast to post a 6.33% CAGR through 2031.
Note: Market size and forecast figures in this report are generated using Mordor Intelligence’s proprietary estimation framework, updated with the latest available data and insights as of 2026.
United States Wine Packaging Market Trends and Insights
Drivers Impact Analysis*
| Driver | (~) % Impact on CAGR Forecast | Geographic Relevance | Impact Timeline |
|---|---|---|---|
| Rising demand for lightweight eco-glass | +1.2% | National, concentrated in California, Oregon, Washington | Medium term (2-4 years) |
| Booming canned-wine sales in off-premise channels | +1.8% | National, strongest in urban markets and venues with glass restrictions | Short term (≤ 2 years) |
| DtC shipping liberalisation across 47 states spurring e-commerce-ready packs | +0.9% | National, excluding Delaware, Mississippi, Utah with restrictions | Medium term (2-4 years) |
| Bottle-deposit laws (OR, MI) increasing recycled-content requirements | +0.7% | Oregon, Michigan, with potential expansion to other states | Long term (≥ 4 years) |
| Vineyard labour shortages shifting bulk formats toward bag-in-box | +0.6% | California Central Coast, Willamette Valley, other labor-intensive regions | Short term (≤ 2 years) |
| Private-label retailers scaling cost-efficient PET/BIB volumes | +0.5% | National, concentrated in major retail chains | Medium term (2-4 years) |
| Source: Mordor Intelligence | |||
Rising Demand for Lightweight Eco-Glass
Glass suppliers are cutting bottle weight to curb freight emissions and control surging input costs. O-I’s Estampe bottle dropped to 390 g while pushing recycled content to 82%, lowering its carbon impact by 25% relative to legacy 500 g designs. [1] Napa and Sonoma wineries saw glass-container price indexes jump 16% in 2024, reinforcing the economic case for lighter stock. Verallia’s new all-electric furnace cut process CO₂ by 60%, signaling long-term commitment to decarbonized glass supply. As freight makes up roughly 35% of delivered glass-package emissions, each 10% weight reduction can trim shipping emissions by nearly 3%, a compelling trade-off for premium wineries that must now publish Scope 3 footprints.
Booming Canned-Wine Sales in Off-Premise Channels
Aluminum’s 100% recyclability, low mass, and venue acceptance have lifted the format from novelty to mainstream. Ball shipped 48 billion aluminum beverage containers across North America in 2024, crossing the 30% penetration mark for the first time. Consumer trials show younger drinkers value portability over tradition, and venues from stadiums to beaches prefer non-breakable packages. Quality hurdles linked to hydrogen-sulfide formation are being mitigated by improved liners that vary by manufacturer. Brands such as Bogle’s Element[AL] have launched 90 g aluminum bottles that ship at one-fifth the mass of glass while retailing at premium price points.
DtC Shipping Liberalisation Across 47 States
Mississippi’s 2025 decision to allow DtC shipments leaves only three states with full bans, expanding the addressable e-commerce base and intensifying the need for parcel-resilient packs. Brands are investing in shock-absorbing cartons and gift-ready designs that elevate the unboxing moment. Frugalpac’s 83 g paper bottle, made from 94% recycled board, debuted at Target, highlighting how feather-weight formats reduce freight and damage risk. Premium houses such as Ruinart rolled out 99% paper “Second Skin” gift cases that are nine times lighter than previous boxes, improving carbon scores by 60%.
Bottle-Deposit Laws Increasing Recycled-Content Requirements
Oregon’s Senate Bill 1520 added canned wine to the state’s 10-cent redemption program in July 2025, compelling wineries to register with the Oregon Beverage Recycling Cooperative and adjust labels. [2] California’s CRV expansion similarly applies fees up to 25 cents for boxed formats, aiming to lift recycling from under 30% toward 75%. For glass makers, every additional 10% of cullet can save 2-3% energy and trim CO₂ by as much as 10%, a decisive edge in the face of volatile utility costs. [3]
Restraints Impact Analysis*
| Restraint | (~) % Impact on CAGR Forecast | Geographic Relevance | Impact Timeline |
|---|---|---|---|
| Volatile natural-gas costs inflating domestic glass production | -1.4% | National, concentrated in glass manufacturing regions | Short term (≤ 2 years) |
| Community resistance to new glass plants on emissions grounds | -0.6% | Regional, particularly in environmentally sensitive areas | Medium term (2-4 years) |
| Premium-segment scepticism toward PET quality perception | -0.8% | National, strongest in premium wine regions like Napa, Sonoma | Long term (≥ 4 years) |
| Plateauing food-grade RPET supply bottlenecks | -0.5% | National, with supply chain concentration in recycling hubs | Medium term (2-4 years) |
| Source: Mordor Intelligence | |||
Volatile Natural-Gas Costs Inflating Domestic Glass Production
Energy expenses account for roughly 20% of glass plant overhead, and spikes in natural-gas prices have prompted closures such as Ardagh’s Houston facility, which idled 220 workers in 2024. O-I disclosed a 4.5% drop in 2024 sales volume as buyers shifted toward cheaper or lighter alternatives. While companies are retrofitting furnaces with oxy-fuel or electric systems, capital requirements slow fleet turnover, keeping price volatility in play for the near term.
Premium-Segment Scepticism Toward PET Quality Perception
Barrier advances have improved PET wine-bottle oxygen performance, yet many premium wineries fear negative consumer cues. University of Florida researchers note oxygen ingress can shorten shelf life unless multilayer structures are used. ALPLA’s 30%-recycled PET format yields a 42% smaller carbon footprint, but adoption remains limited to entry or casual wines. Overcoming entrenched perceptions requires gradual exposure and education, tempering near-term PET growth among high-priced labels.
*Our forecasts treat driver/restraint impacts as directional, not additive. The impact forecasts reflect baseline growth, mix effects, and variable interactions.
Segment Analysis
By Material Type: Aluminum’s Rise Challenges Glass Leadership
Glass accounted for 66.65% of the United States wine packaging market share in 2025, equal to about USD 706.5 million within the United States wine packaging market size. Metal, led by aluminum, is projected to post an 8.31% CAGR through 2031 as brands prioritize lighter weights and closed-loop recycling credentials. Glass suppliers are countering with 390 g eco-bottle launches and higher cullet ratios that lower furnace energy use while preserving premium shelf presence. Paper composites and refillable-glass systems remain niche but signal the next wave of low-carbon formats that could erode glass share if supply chains scale.
Aluminum’s ascent hinges on reduced freight cost, 100% recyclability, and venue acceptance where breakage is a concern, while glass retains an authenticity advantage for premium cues. Ball’s plan to reach 85% recycled content by 2030 exemplifies the aggressive sustainability targets that drive material substitution. Glass makers are investing in electric furnaces and oxy-fuel burners to shield margins from natural-gas volatility, yet capital intensity slows fleet turnover. Ultimately, wineries are weighing carbon disclosures against brand heritage, prompting a gradual mix shift rather than an abrupt material handoff.


By Product Type: Cans Accelerate Amid Bottle Dominance
Glass bottles captured 56.12% of the 2025 value, but cans are expanding at a 7.74% CAGR as portability, recyclability, and event-venue policies favor unbreakable formats. Hydrogen-sulfide risks linked to can liner chemistry are being mitigated through improved internal coatings, opening the door for broader varietal adoption. Bag-in-box remains entrenched for bulk and value wines because vineyard labor shortages push producers toward formats that minimize handling. Plastic bottles and pouches serve price-sensitive or single-serve occasions but face premium-image headwinds.
Canned presentations align with younger demographics that prioritize environmental responsibility over tradition, evidenced by Bogle’s 90 g aluminum bottle introduction at USD 16.99 retail. Bottlers are also experimenting with resealable ends and secondary paper wraps to upgrade shelf visibility. For glass, lightweighting and emboss-free silhouettes are helping retain relevance by trimming freight emissions without compromising perceived quality. The result is a diversified product mix that lets wineries match pack type to channel, price tier, and consumption occasion.
By Closure Type: Screw Caps, Chip Away at Cork Tradition
Natural cork maintained 43.95% share in 2025, yet screw caps are advancing 7.98% annually as consumers favor convenience and wineries seek consistent oxygen ingress. Studies show screw caps can foster reductive conditions, but liner options now allow tuned permeability that protects aromatics for wines designed for near-term drinking. Technical cork and synthetics fill middle-price niches, blending cork aesthetics with lower cost and taint risk. Specialty closures such as crown caps and T-stoppers meet sparkling or fortified requirements but remain small in volume.
Cork suppliers are marketing forest-stewardship credentials and carbon sequestration claims, while aluminum-cap makers tout 35% emission cuts via recycled stock in launches like Amcor’s STELVIN Goes Greener. Premium estates are gradually adopting screw caps for white and rosé labels aimed at immediate consumption, reserving cork for cellar-worthy reds. As sensory studies continue to narrow performance gaps, closure choice is becoming a deliberate branding lever rather than a default tradition.
By Wine Type: Low-Alcohol Surge Within Still-Wine Stronghold
Still-wine formats represented 67.55% of United States wine packaging market size in 2025, translating to roughly USD 716 million of spend. Low and no-alcohol wines, though less than 5% of volume, are forecast to grow 9.02% per year through 2031 on wellness and moderation trends. These products demand barrier properties that preserve volatile aroma compounds despite lowered ethanol, prompting interest in multilayer bottles and cans with specialized liners. Sparkling and fortified wines maintain niche status, each with rigid closure and pressure-tolerance needs.
Dealcoholized offerings often target socially active consumers who seek premium cues without alcohol, driving brands to replicate traditional bottle shapes and label aesthetics. Packaging must also navigate differing labelling regulations on alcohol content, sugar, and nutritional disclosures. As producers diversify SKUs, suppliers see opportunities for custom portion sizes and interactive labels that guide pairing and serving tips. The segment’s rapid rise is pressuring legacy pack lines to handle lower fill temperatures and varying carbonation levels.
By Capacity: Single-Serve Growth Pressures Standard Bottles
Standard 375-750 mL bottles delivered 59.84% of 2025 revenue, yet sub-375 mL formats are climbing 7.41% yearly as portion control and convenience drive trial. Smaller sizes support premium pricing per ounce, enable sampler flights, and reduce waste for moderate drinkers. They also fit into stadium and airline settings where volume caps exist, favoring aluminum or PET to save weight. Large 1.5 L and 3 L sizes persist in family and food-service channels but face weaker growth.
Shrink-sleeve decoration and augmented-reality label initiatives help compact bottles retain shelf impact despite reduced billboard space. For wineries, higher bottling line changeover costs are offset by diversified revenue streams and inventory agility. Supply-chain planners note that small formats improve pallet utilization and lower DtC shipping costs, vital as carriers enforce stricter dimensional weight rules. Consequently, capacity choice is evolving from a passive tradition to a strategic marketing lever tied to channel economics.
By Distribution Channel: Retail Momentum Challenges Direct Sales Supremacy
Direct sales delivered 57.92% of 2025 volume as tasting-room and wine-club programs preserve high margins and data access. However, retail and on-premise outlets are set to expand at a 6.33% CAGR, boosted by private-label pushes from grocers and convenience chains. Retailers demand cost-efficient packs that maximize shelf density often cans, bag-in-box, or lightweight glass while DtC shipments prioritize protective secondary packaging and gift-ready aesthetics.
Mississippi’s 2025 D2C legalization widened e-commerce reach, yet varied state laws force pack differentiation to accommodate tax stamps and volume caps. Rising freight surcharges make feather-weight bottles and recycled-paper shippers attractive for subscription clubs. In stores, eye-catching sustainability claims and NFC tags that unlock provenance data are increasingly influential. The evolving channel mix compels wineries to adopt a portfolio approach, aligning packaging SKUs with margin structure, shopper journey, and regulatory overhead.
Geography Analysis
California generates the bulk of United States wine packaging market demand but grapples with a 20-year-low red-grape crop and a new CRV fee structure that increases compliance costs for small wineries. Oregon serves as a circular-economy testbed, where roughly 60 wineries are expected to refill 720,000 Revino bottles in 2024, cutting lifecycle emissions by 85%. Washington benefits from nearby aluminum smelters and tech-savvy consumers who reward sustainable packaging.
The Pacific Northwest’s weather-related labour tightness has accelerated bag-in-box usage to ease handling, especially along California’s Central Coast where 2024 grape tonnage fell 35%. Eastern states, though smaller wine producers, are leveraging proximity to dense population centres to build DtC programs that rely on damage-resistant parcel packs. State-by-state shipping restrictions continue to demand nuanced labelling and fulfilment strategies, creating service niches for specialised contract packagers.
Regulatory Landscape
Wine packaging sold in interstate commerce is shaped by federal labeling and container rules administered by the Alcohol and Tobacco Tax and Trade Bureau (TTB) under 27 CFR Part 4, including the requirement to secure a Certificate of Label Approval (COLA) (or an exemption, where applicable). This framework also sets out mandatory information to appear on labels, such as brand, class/type, net contents, and producer/bottler or importer details, along with the health warning statement. Standards of fill (authorized container volumes) under 27 CFR 4.72 further constrain format choices, particularly for alternative packs and non-traditional sizes used for direct-to-consumer shipments and single-serve offerings.
Packaging materials and components that contact wine must also meet US Food and Drug Administration (FDA) food-contact substance requirements, which can affect timelines for new liners, barrier layers, inks, and adhesives used in cans, pouches, or paper-based bottles. Rulemaking also adds compliance complexity around label real estate and SKU management, including TTBs Notice No. 238 on major food allergen labeling for alcohol beverages (comment period deadline in August 2025), which can shift label design and print-change cadence across suppliers and wineries.
Competitive Landscape
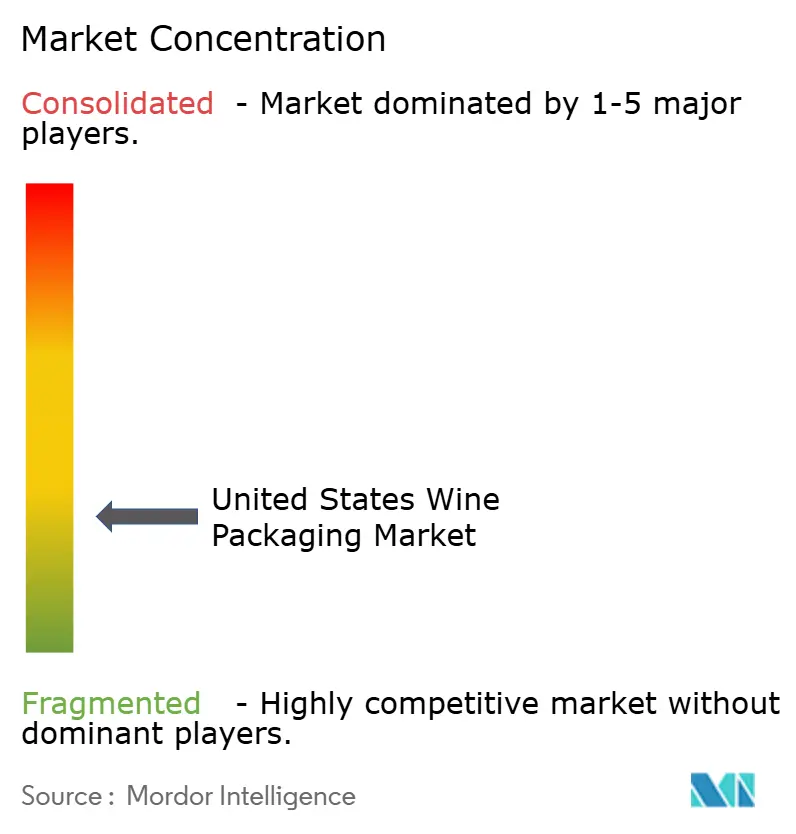
The United States wine packaging market is moderately fragmented. Owens-Illinois leads in glass but saw volumes dip after natural-gas spikes raised furnace costs, prompting a strategic pivot toward leaner furnaces and recycled-content targets. Ardagh’s 2024 Houston shutdown illustrates exposure to demand swings in adjacent beer glass, handing share to nimble rivals.
Aluminum specialist Ball is scaling capacity with a new Oregon plant to harness fast-growing canned-wine demand while advancing toward 85% recycled content. Paper-bottle pioneer Frugalpac struck US production deals that could exceed 2.5 million units annually, signalling competitive threats from disruptive substrates.
Amcor closed a USD 650 million merger with Berry Global, blending film, cap, and closure expertise and signalling aggressive synergy extraction goals. Patent filings around self-aerating glass further show how incumbents chase differentiation beyond raw material battles. Across the United States cost structures, M&A ambitions, and technology races are redefining supplier hierarchies.
United States Wine Packaging Industry Leaders
-
AMCOR PLC
-
Ball Corporation
-
Owens–Illinois Inc.
-
Ardagh Group
-
Silgan Holdings Inc.
- *Disclaimer: Major Players sorted in no particular order
Market Opportunities and Future Outlook
State packaging waste programs and fee structures are creating an economic lever for lightweighting and material substitution. California moved its SB 54 Extended Producer Responsibility (EPR) program forward with the Office of Administrative Law approving permanent regulations in May 2026, and industry groups have actively contested weight-based EPR approaches. For example, the Wine Institute and DISCUS filed an amicus brief in July 2026 challenging Oregons EPR program. Together, these actions elevate demand for packs that reduce weight and improve recyclability credentials, supporting opportunities for ultra-lightweight glass designs, higher-cullet content supply, and alternative formats such as cans, bag-in-box, and pouches that align more closely with weight-based compliance economics.
Circular-glass infrastructure is also becoming a concrete investment theme. In June 2026, Revino received a USD 4,867,070 CalRecycle grant to build a certified bottle-washing facility in Lompoc, California, designed for 10 million containers annually, reinforcing reuse as a commercialization pathway alongside traditional recycling. Material innovation remains active in plastics and bio-based barriers as well, including Packamamas January 2026 agreement with Avantium to trial PEF wine bottles, which expands the pipeline of lower-emission, recyclable packaging concepts that can be paired with direct-to-consumer shipping durability and retailer shelf-density goals.
Recent Industry Developments
- June 2026: Ardagh Glass Packaging-North America introduced a new American-made 700 ml liquor bottle to expand its stock portfolio, produced within the same manufacturing footprint used for 750 ml wine and spirits bottles. This widens stock-SKU breadth for customers balancing lead times, freight costs, and premium presentation, while keeping production localized for North American demand.
- May 2026: Closure Systems International acquired two North American beverage closure compression molding facilities from Amcor (Erie, Pennsylvania, and Hattiesburg, Mississippi). The transaction reshapes regional closure supply and points to portfolio realignment, with implications for wine and spirits customers sourcing screwcaps and related closure components across North America.
- March 2024: Amcor Capsules and Scott Laboratories extended a long-term contract for distribution of premium tin wine capsules across North America and STELVIN screwcaps on the US West Coast. The agreement reinforces availability of premium capsule and closure options for wineries seeking consistent quality, short lead times, and differentiated shelf presentation.
Research Methodology Framework and Report Scope
Market Definition and Coverage
The market is defined as the value of packaging used to pack wine sold in the United States, counted across primary packs and related components that directly contain or close the wine, and measured in revenue terms.
Scope exclusions: We exclude wine production, bulk wine transport services, and packaging used only for non-wine beverages or secondary logistics-only materials where they are not specific to wine packs.
Segmentation Overview
- By Material Type
- Glass
- Plastic
- Metal
- Paper
- By Product Type
- Glass Bottles
- Plastic Bottles
- Bag-in-Box
- Cans
- Pouches
- By Closure Type
- Natural Cork
- Technical/Synthetic Cork
- Screw Caps
- Crown Caps
- Other Closure Types (T-stoppers, Vino-Lok)
- By Wine Type
- Still Wine
- Sparkling Wine
- Fortified and Dessert Wine
- Low and No-Alcohol Wine
- By Capacity
- Less than 375 mL
- 375-750 mL
- 750-1,500 mL
- More than 1,500 mL
- By Distribution Channel
- Direct Sales
- Indirect Sales
Data Sources, Market Sizing, and Validation
Desk Research
Desk research was used to anchor the U.S. demand environment and to set practical constraints on volumes, formats, and price bands before we moved into modeling. Public sources such as the Alcohol and Tobacco Tax and Trade Bureau (TTB), USITC DataWeb for packaging-related trade flows, the US Census Bureau's manufacturing and trade series, and EPA recycling and waste statistics helped us sanity check direction and pace of change by material.
We also reviewed sources such as peer-reviewed packaging and materials journals, public sustainability scorecards from industry groups, and winery and packaging supplier filings and investor decks to understand lightweighting, recycled content targets, and format shifts (for example, cans and bag-in-box growth). Where needed, paid database subscriptions for company financials and news, patent databases, and an import-export shipment-level database were used to confirm supplier exposure, product mix signals, and timing of capacity or product announcements. These desk research inputs are not exhaustive, and many other public and paid sources were reviewed for data collection, validation, and clarification.
Primary Interviews and Surveys
Primary work focused on interviews and structured surveys with packaging converters, closure suppliers, distributors, and procurement and operations teams at wine producers and co-packers. The interviews were used to confirm what buyers actually purchase by format and capacity, how price changes are passed through, and where substitution is occurring between glass bottles and alternatives. Coverage was designed to reflect major U.S. wine producing and consuming states.
Distribution of primary research fieldwork respondents
| Company type | Respondent position |
|---|---|
| Top tier: 35% | CXOs: 19% |
| Mid tier: 43% | Functional/Unit leaders: 32% |
| Smaller Players: 22% | Managers: 49% |
Market-Sizing & Forecasting
Sizing starts with a top-down build where U.S. wine demand is reconstructed into a packaging requirement by format and typical pack sizes, then translated into value using observed price bands. This step keeps the model tied to the consumption pool, before it is adjusted for channel patterns and substitution across formats.
To corroborate totals, we run selective bottom-up checks using supplier revenue exposure, sampled average selling prices by pack format, and channel checks from distributors and packaging buyers. These checks are then used to correct any over-counting between primary packs and closures. Key inputs used in the model include the split of wine into still versus sparkling, capacity mix (such as 375-750 mL versus larger formats), glass lightweighting and recycled content adoption rates, closure mix shifts (for example, cork versus screw caps), and the pace of can and bag-in-box penetration in retail and direct-to-consumer shipments.
Forecasting is performed using scenario analysis supported by short time series smoothing on the main drivers, then cross-checked with primary feedback on planned packaging mix, contract reset timing, and expected resin, aluminum, and glass cost direction. Where bottom-up data is incomplete for smaller suppliers, we apply market-share proxies tied to winery counts and distributor coverage, and then revalidate with interview feedback to avoid unrealistic concentration assumptions.
Data Validation & Update Cycle
Validation is done in layers so the final outputs do not rely on one data stream. We compare model results against independent signals such as wine shipment indicators, packaging material recycling and production trends, and observed pricing ranges from procurement conversations, and then review outliers until the cause is clear.
Before sign-off, the model goes through multi-step analyst reviews where assumptions, unit conversions, and year-on-year movements are checked for consistency. Any large variance triggers follow-up calls with sources closest to purchasing decisions. The report is refreshed annually, and interim updates are made when material events occur (for example, major capacity additions, sharp raw material shifts, or regulatory changes). Right before delivery, a final pass is completed so the numbers reflect the latest available public releases and field feedback.
Mordor Intelligence's United States Wine Packaging Market Estimate Compared With Other Published Estimates
Published market sizes for U.S. wine packaging do not always align because research groups do not count the same items, and they also select different timing for prices and currency assumptions. Differences also show up when one estimate is built from wine volumes and format penetration, while another leans more on packaging supply-side revenue or a broader beverage packaging frame.
In this study, the key gap drivers are usually scope and counting rules, especially whether closures are included as part of the wine pack value and whether adjacent alcoholic beverage packaging is mixed in. The spread can also come from how fast can and bag-in-box adoption is assumed to grow, how lightweight glass is treated in value terms, and whether pricing uses contract-reset averages versus spot-influenced assumptions, with the scope kept to wine formats and closure types only, a modeling choice applied by Mordor Intelligence.
Benchmark comparison
| Source | Market Size | Gaps in Research Methodology |
|---|---|---|
| Mordor Intelligence | USD 1.12 B (2026) | |
| Industry Association A | USD 0.98 B (2026) | Often excludes closures and counts only primary containers, and it can apply conservative adoption for cans and bag-in-box based on historic shipment mix rather than buyer-led forward contracts. |
| Trade Journal B | USD 1.29 B (2026) | Commonly blends wine packaging into a wider alcoholic drinks packaging pool and uses higher assumed price progression for glass and aluminum, which can lift value even if unit growth stays modest. |
The table indicates that the largest differences are tied to what is counted within the wine pack (especially closures) and whether broader beverage packaging is included. By keeping the demand pool tied to wine formats and validating pricing through procurement feedback and channel checks, the estimate stays traceable to clear variables and repeatable steps.
Key Questions Answered in the Report
What is the current value of the United States wine packaging market?
The market stands at USD 1.12 billion in 2026 and is projected to reach USD 1.46 billion by 2031.
Which packaging material is growing fastest?
Aluminum and other metal formats are expanding at an 8.31% CAGR thanks to recyclability and light weight.
How are deposit-return laws affecting packaging choices?
New 10-cent fees on canned wine in Oregon and expanded CRV rules in California are pushing suppliers toward high-recycled-content designs that meet circular-economy targets.
Why are smaller wine formats gaining traction?
Sub-375 mL containers are rising 7.41% annually as consumers seek portion control and brands leverage premium single-serve pricing.
What role does direct-to-consumer shipping play in design decisions?
DtC liberalisation across 47 states is driving demand for lightweight, protective, and gift-ready packs that can survive parcel networks while elevating the unboxing experience.
Which closure type is winning share from cork?
Screw caps are capturing volume at an 7.98% CAGR due to consistent seal quality and consumer convenience, especially for wines intended for early consumption.