
Market Overview
| Study Period | 2020 - 2031 |
|---|---|
| Forecast Data Period | 2026 - 2031 |
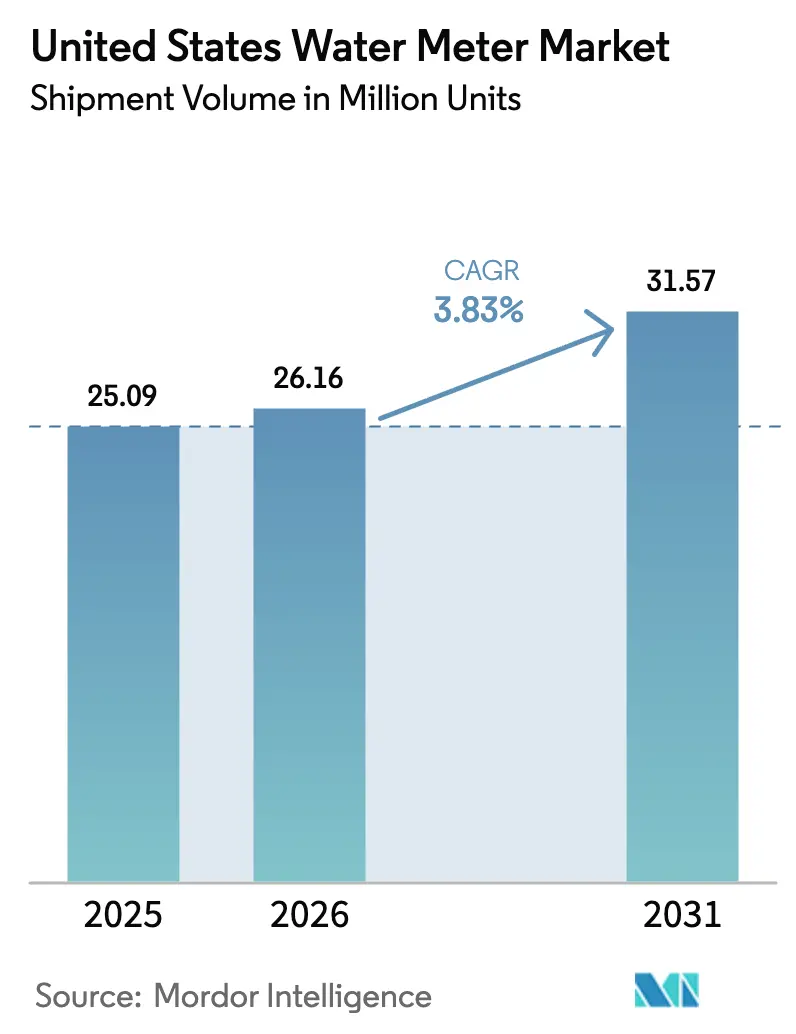
| Base Year Market Size (2025) | 25.09 Million units |
| Market Volume (2026) | 26.16 Million units |
| Market Volume (2031) | 31.57 Million units |
| Growth Rate (2026 - 2031) | 3.83% CAGR |
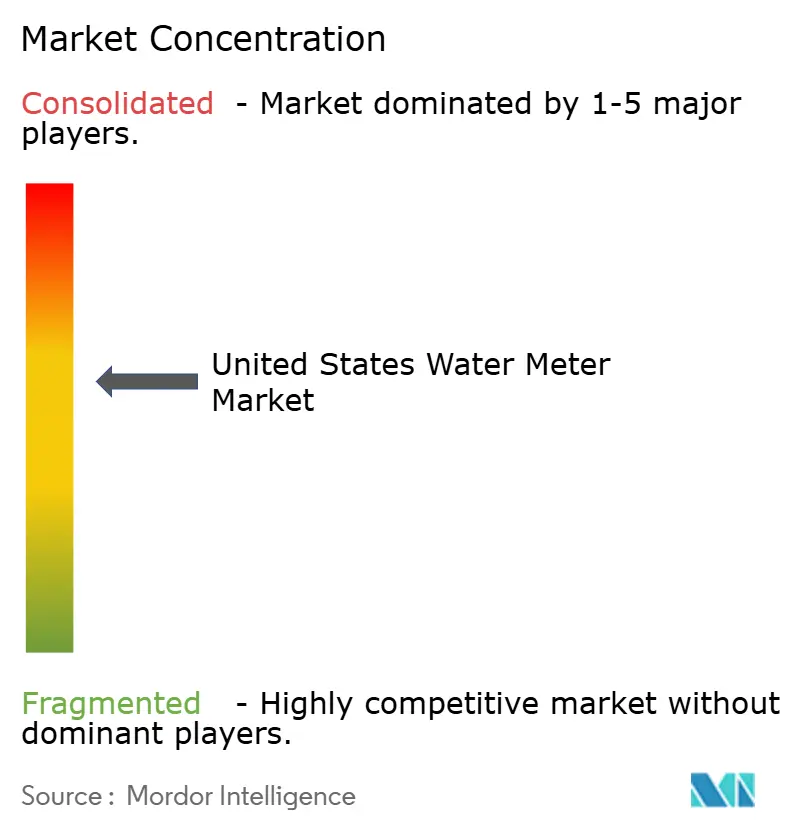
| Market Concentration | Medium |
Major Players *Disclaimer: Major Players sorted in no particular order Image © Mordor Intelligence. Reuse requires attribution under CC BY 4.0. | |
United States Water Meter Market Analysis by Mordor Intelligence
The United States water meter market size was 25.09 million units in 2025, is rising to 26.16 million units in 2026, and is projected to reach 31.57 million units by 2031, growing at a CAGR of 3.83% from 2026 to 2031. Growth is supported by federal Infrastructure Investment and Jobs Act (IIJA) grants that shift utility budgets from piecemeal replacements to system-wide Advanced Metering Infrastructure (AMI) programs, especially in disadvantaged communities. Utilities are pairing meter change-outs with lead service line removal to maximize IIJA reimbursements, while California’s irrigation-meter mandate signals a coming wave of compliance-driven procurements. At the same time, the Build America Buy America waiver creates a three-year window for accelerated imports, easing short-term supply pressure even as it highlights long-term domestic content risk. Meanwhile, cellular NB-IoT and 5G RedCap connectivity lowers rural deployment costs, and subscription “Metering-as-a-Service” contracts convert large capital outlays into operating expenses, widening access for Tier-3 systems.
Key Report Takeaways
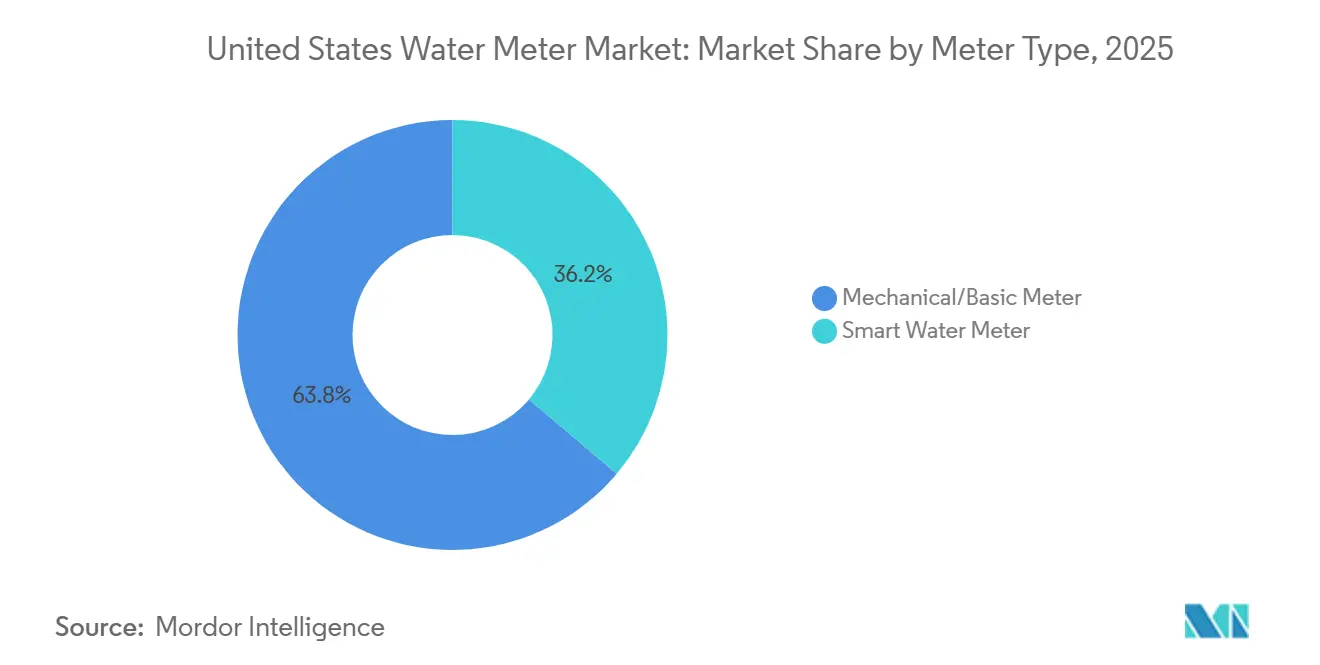
- By meter technology, mechanical and basic meters led with 63.84% United States water meter market share in 2025, while smart water meter deployments are forecast to expand at a 4.19% CAGR through 2031.
- By communication technology, automated meter reading systems commanded 56.91% of 2025 deployments in the US water meter market, whereas advanced metering infrastructure is projected to grow at a 4.07% CAGR between 2026 and 2031.
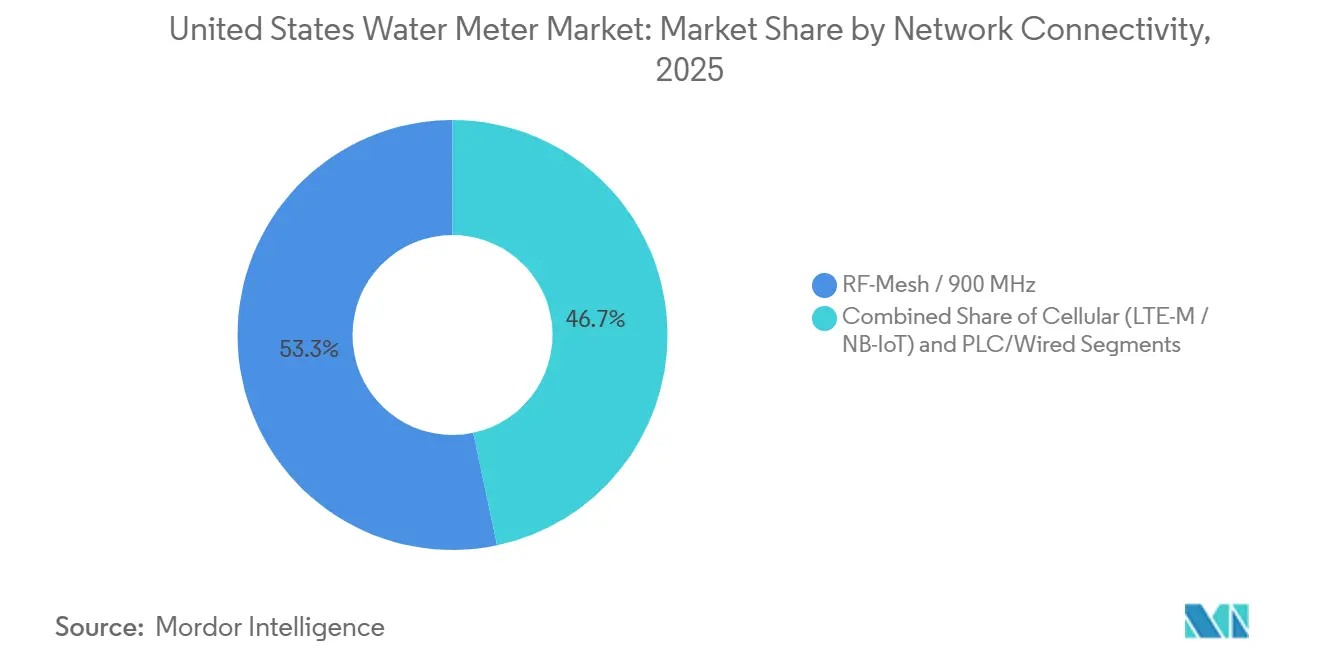
- By network connectivity, RF-mesh 900 MHz platforms accounted for 53.32% of 2025 installations, yet cellular LTE-M, NB-IoT, and 5G RedCap endpoints are projected to grow at a 4.31% CAGR over 2026-2031 in the US water meter market.
- By end-user, the residential segment captured 46.78% of the United States water meter market size in 2025, whereas municipal utilities show the fastest momentum with a 3.97% CAGR to 2031.
- By utility size, Tier-2 systems serving 45,000-400,000 connections held 52.87% share in 2025, while Tier-1 operators are expected to post the highest CAGR at 3.89% as they upgrade first-generation AMI fleets.
Note: Market size and forecast figures in this report are generated using Mordor Intelligence’s proprietary estimation framework, updated with the latest available data and insights as of 2026.
United States Water Meter Market Trends and Insights
Drivers Impact Analysis*
| Driver | (~) % Impact on CAGR Forecast | Geographic Relevance | Impact Timeline |
|---|---|---|---|
| Federal IIJA grants accelerating AMI roll-outs | +1.2% | National, concentrated in disadvantaged communities | Medium term (2–4 years) |
| Tightening state conservation mandates on non-revenue water | +0.9% | Western states, expanding to Texas and Florida | Long term (≥ 4 years) |
| 5G RedCap and NB-IoT penetration extending rural coverage | +0.7% | Rural Midwest and Southeast counties | Medium term (2–4 years) |
| Aging meter fleet triggering 15-year replacement cycle | +0.6% | National, oldest stock in Northeast and Rust Belt | Short term (≤ 2 years) |
| Utility shift toward subscription “Metering-as-a-Service” models | +0.4% | Tier-3 utilities and disadvantaged communities | Short term (≤ 2 years) |
| ESG-linked municipal bond financing boosting smart projects | +0.3% | Metro areas with active green-bond programs | Medium term (2–4 years) |
| Source: Mordor Intelligence | |||


Federal IIJA Grants Accelerating AMI Roll-Outs
IIJA allocates roughly USD 50 billion to water infrastructure, now explicitly covering cybersecurity and AMI expenditures. The funding removes the staggered, decade-long rollout model that utilities once adopted and instead enables full-system deployments in a single bond cycle. Disadvantaged communities qualify for principal forgiveness, yet complex application paperwork rewards the larger utilities that maintain grant-writing teams, perpetuating a scale advantage. Bureau of Reclamation WaterSMART grants add performance incentives that tie disbursements to measured reductions in non-revenue water. Consequently, project scopes increasingly bundle meters, pipe replacement, and cybersecurity in one capital plan, accelerating adoption and lifting the United States water meter market.[1]U.S. Environmental Protection Agency, “Infrastructure Investment and Jobs Act: Water Infrastructure Funding,” EPA.gov
Tightening State Conservation Mandates on Non-Revenue Water
California’s “Making Conservation a California Way of Life” regulation introduces firm timelines for dedicated irrigation meters, listing AMI as an approved compliance technology. Arizona groundwater management areas, Texas annual water-loss audits, and emerging Florida rules build similar enforcement frameworks that reference minimum read frequencies and data-accuracy classes only AMI can meet. Utilities that fail to comply risk enforcement actions and curtailed access to state funding, compressing their decision window to under two years in many jurisdictions. Because Western drought conditions amplify public scrutiny, political backing for stringent mandates remains strong, cementing a long-run uplift for the United States water meter market.[2]California Department of Water Resources, “Making Conservation a California Way of Life: Regulation and Implementation,” Water.ca.gov
5G RedCap and NB-IoT Penetration Extending Rural Coverage
Carriers began commercial RedCap pilots in 2025, offering bandwidth sufficient for firmware updates and remote shutoff without sacrificing battery life. Rural utilities, historically unable to justify proprietary RF-mesh gateways for sparse endpoints, now sign multi-year cellular contracts that convert capital expense to predictable operating cost. Itron’s solar-powered access point complements this model by removing the need for power drops and pole rentals in back-country deployments, trimming total cost of ownership. The connectivity shift enlarges the addressable base of small systems and directly feeds volume growth in the United States water meter market.[3]Ericsson, “5G RedCap: Expanding 5G to New IoT Use Cases,” Ericsson.com
Aging Meter Fleet Triggering 15-Year Replacement Cycle
Mechanical meters installed during the 2010-2015 federal stimulus wave approach end-of-life, with under-registration averaging 5-15%. Utilities that quantify lost revenue often find the payback period for early smart-meter replacement falls below seven years, especially for high-consumption commercial accounts. Cities such as Norfolk and Fredericksburg, Virginia have already issued RFPs or completed phase-one deployments well before meter failure curves peak, signaling a proactive stance that pulls forward demand. The replacement cycle also dovetails with IIJA-funded lead pipe removal, allowing utilities to rehabilitate service lines and meters in one mobilization.
Restraints Impact Analysis*
| Restraint | (~) % Impact on CAGR Forecast | Geographic Relevance | Impact Timeline |
|---|---|---|---|
| Up-Front CAPEX Pressure on Tier-3 Utilities | -0.5% | Rural Counties and Small Municipalities | Short Term (≤ 2 Years) |
| Semiconductor Supply Volatility for Ultrasonic Meter ICs | -0.3% | National | Medium Term (2–4 Years) |
| Rising Cyber-Insurance Premiums for Utilities | -0.2% | National | Short Term (≤ 2 Years) |
| Analytics Workforce Skill Gap Inside Small Utilities | -0.2% | Tier-3 Utilities | Long Term (≥ 4 Years) |
| Source: Mordor Intelligence | |||
Up-Front CAPEX Pressure on Tier-3 Utilities
Systems with fewer than 45,000 connections pay 30-50% more per endpoint because network infrastructure costs are spread over a smaller base. Revolving-fund loans charge low interest, but the paperwork demands asset-management plans, environmental studies, and board approvals that many eight-person utilities cannot deliver. Vendors respond with 15-20-year metering-as-a-service contracts that remove the initial check but result in higher lifetime payments and long-term lock-in. Where federal principal-forgiveness grants are available, small utilities often lack staff to capture them, making financing the primary hand-brake on United States water meter market adoption in rural pockets.[4]American Water Works Association, “Water Utility Workforce Challenges and Infrastructure Needs,” AWWA.org
Semiconductor Supply Volatility for Ultrasonic Meter ICs
Time-of-flight processing chips used in ultrasonic meters come from a narrow set of overseas fabs. Pandemic-era shortages pushed lead times to 40 weeks, and although easing, supply remains tight. The December 2024 Build America Buy America waiver acknowledges that no AMI meter currently meets the 55% domestic-content rule and buys manufacturers three years to localize supply chains. Until then, inventory buffers and dual sourcing raise working capital needs and component costs, trimming margins and slowing vendor quote cycles, which in turn delays purchase orders inside the United States water meter market.
*Our forecasts treat driver/restraint impacts as directional, not additive. The impact forecasts reflect baseline growth, mix effects, and variable interactions.
Segment Analysis
By Meter Type: Ultrasonic Accuracy Pulls Share From Mechanical Platforms
Mechanical models account for 63.84% of 2025 deployments, underpinned by a vast legacy base still read manually or via drive-by systems. Yet utilities increasingly install static smart meters when the old mechanical units reach end-of-life because every percentage point of under-registration directly erodes revenue. Ultrasonic meters deliver high-resolution leak detection at low flow, a capability publicized by early adopters such as Publiacqua, which chose Intelis wSource to exceed MID R1000 accuracy standards. Over 2026-2031, smart water meter shipments are forecast to outpace total market growth, lifting their United States water meter market share by several points. Mechanical options will cling to cost-sensitive residential retrofits through 2027, but static technology’s maintenance savings and data granularity eventually outweigh higher upfront prices.
The vendor landscape is moving in step. Badger Meter reported record utility revenue in Q3-2024 on the back of AMI demand, while Neptune’s software-defined R900 Gateway v4 lets cities upgrade from AMR to AMI without stranding prior investments. Such backward compatibility accelerates decision making for councils wary of sunk costs, reinforcing the gradual but decisive tilt from mechanical to ultrasonic and electromagnetic platforms in the United States water meter market.

By Communication Technology: Two-Way AMI Becomes Default Specification
One-way Automated Meter Reading (AMR) still represented 56.91% of 2025 endpoints, a legacy of early-2000s drive-by deployments. However, almost every new procurement now specifies two-way capability for remote disconnect, firmware updates, and hourly interval data. Utilities from Minnesota’s Anoka Municipal to Florida’s Orange County have budgeted full AMI conversions starting in 2025, replacing or overlaying AMR modules with networked endpoints that stream data to customer portals. As procurement shifts, AMI’s share of the United States water meter market size is set to rise steadily, aided by IIJA grants that favor projects delivering cybersecurity and conservation outcomes.
AMI also future-proofs utilities against forthcoming conservation rules that demand rapid leak alerts and customer engagement. Because AMR cannot meet these latency and data-volume thresholds, the installed base will continue to migrate to AMI through swap-outs and overlay networks. Consequently, AMI is expected to dominate new installations within two years, relegating AMR to a shrinking portion of the installed base that will be phased out with the next replacement cycle.
By Network Connectivity: Cellular Closes the Rural Coverage Gap
Proprietary RF-mesh networks carried 53.32% of traffic in 2025, reflecting earlier “own-the-network” strategies. The economics flip in rural geographies: gateways that cover only a few dozen endpoints cannot beat a carrier fee of USD 1-2 per month. Cellular LTE-M and NB-IoT therefore win small-town bids, and 5G RedCap promises firmware update bandwidth without sacrificing battery life. Fredericksburg’s 2025 deployment of Badger Meter cellular endpoints illustrates the operational shift; usage data now arrives thrice daily in 15-minute slices, with no poles, repeaters, or gateway leases. As carriers lock in multi-year pricing, utilities gain budget certainty, bolstering cellular’s appeal and fueling its 4.31% CAGR within the United States water meter market.
Mesh technology will hold sway in dense urban cores where cost per endpoint remains low, and hybrid architectures are emerging that steer city centers onto mesh while handing rural fringes to cellular. Such mix-and-match designs optimize life-cycle cost and extend RF equipment life, cushioning mesh vendors from wholesale disruption even as cellular penetration accelerates.

By End-User Sector: Municipal Utilities Integrate Meters Into Smart-City Stacks
Residential accounts generated 46.78% of 2025 installations and will stay the volume anchor because single-family meters age out on a predictable 15-year cycle. Yet growth momentum lies with municipal utilities that tie water data into broader smart-city dashboards. Cities like Killeen, Texas frame AMI not as meter replacement but as digital infrastructure that supports conservation tariffs, demand forecasting, and ESG reporting. This framing unlocks capitally constrained projects through green-bond financing and IIJA grants, pushing municipal installations to a 3.97% CAGR and lifting their slice of the United States water meter market size.
Commercial and industrial customers, though fewer in number, yield high revenue per install because large-diameter ultrasonic or electromagnetic meters cost multiples of a residential unit. Sub-metering for tenant billing in malls and airports, evidenced by San Francisco International Airport’s 2024 procurement, maintains demand in the commercial segment. Industrial plants weigh water data against energy and process metrics, often realizing sub-three-year paybacks, ensuring this niche, high-margin business endures.
By Utility Size Tier: Scale Dictates Pace and Business Model
Tier-2 utilities, responsible for 52.87% of 2025 deployments, sit in the “sweet spot”: sizeable enough to qualify for favorable bond rates yet agile enough to adopt new business models. They capture the majority of IIJA principal-forgiveness awards and have project teams to navigate federal paperwork. Tier-1 behemoths focus on second-generation upgrades, swapping early AMI endpoints for next-gen devices with edge analytics, supporting a steady 3.89% CAGR. Tier-3 systems rely on vendor subscription models such as Utility Management Solutions’ netAMP, spreading costs over 15-20 years and sidestepping bonding limits, though lifetime payments may exceed cap-purchase options.
Analytic talent divides along the same tiers. Tier-1 and Tier-2 utilities run in-house data science teams that integrate meter feeds into asset-management systems, while Tier-3 operators struggle with staffing and thus under-utilize the rich data stream, muting realized savings. Bridging this capacity gap represents a growth frontier for software vendors targeting the United States water meter market.
Geography Analysis
Regulatory pressure and climate stress create distinct adoption corridors. The Western seaboard dominates near-term unit demand as California, Arizona, Nevada, and Colorado enforce mandatory irrigation and water-loss standards. California alone sets staggered irrigation-meter deadlines ranging from 2027-2039, guaranteeing a multi-year order book for static smart meters. Adjacent Texas and Florida adopt similar reporting frameworks as saltwater intrusion threatens aquifers, expanding conservation-driven demand beyond the Pacific coast.
In the Northeast and Upper Midwest, aging lead service lines spur synchronized pipe and meter replacements. IIJA earmarked USD 15 billion for lead removal, and utilities in older cities bundle ultrasonic or electromagnetic meters into trench-open projects to optimize federal reimbursements. Because these municipalities frequently encounter under-registration from 1990s-era mechanical meters, ROI arguments resonate with finance committees, advancing AMI penetration in erstwhile slow-moving metros.
Rural Midwestern and Appalachian regions leverage cellular networks to leapfrog mesh infrastructure, aided by 5G RedCap pilots that widen coverage maps. Yet administrative hurdles remain: many Tier-3 utilities qualify for 40-60% principal forgiveness but cannot marshal the staff hours to file, slowing adoption despite eligibility. Meanwhile, metro areas like Chicago, Los Angeles, and New York issue ESG-linked bonds that price a few basis points below conventional debt, channeling investor appetite for sustainable infrastructure straight into large-scale AMI deployments. Together, these dynamics carve a geography where drought-prone West, infrastructure-aged Northeast, and green-bond-savvy metros drive volume, while rural funding capacity lags, modulating the aggregate growth trajectory of the United States water meter market.
Regulatory Landscape
Federal funding rules and drinking-water compliance priorities are influencing water-meter procurement and supply-chain planning. The U.S. Environmental Protection Agency (EPA) National Water Program Guidance for FY 2025-2026 emphasizes Bipartisan Infrastructure Law implementation alongside compliance with health-based drinking water standards, reinforcing the linkage between distribution system investments and digital monitoring. On domestic-content compliance, the U.S. Department of the Interior and EPA issued a three-year phased Build America, Buy America Act waiver in December 2024 for AMI water meters, acknowledging limited near-term availability of fully compliant products and creating a defined window for manufacturers and utilities to adjust sourcing plans.
Technical and material standards continue to shape specifications, acceptance testing, and lead-free requirements. ANSI/AWWA C712-24 and C713-24 became active in January 2025, providing updated benchmarks utilities use in bid documents for metering performance and system integration. Across potable applications, compliance with NSF/ANSI 61 and NSF/ANSI 372 (lead-free) remains a baseline requirement for products and wetted components. AWWA released the M6-2026 manual in July 2026 to cover selection, installation, testing, and maintenance practices that utilities and contractors use to standardize rollouts and reduce commissioning risk.
Value Chain Analysis
The value chain runs from metrology hardware (mechanical and static ultrasonic/electromagnetic) to communications endpoints (RF mesh, cellular LTE-M/NB-IoT, emerging 5G RedCap), then to network infrastructure, head-end software, meter data management, and utility integration services. Major OEMs serving the United States include Badger Meter, Sensus (Xylem), Itron, Neptune Technology Group (Roper Technologies), Aclara (Hubbell), Mueller Systems, and Kamstrup. Utilities typically procure through competitive bids that bundle endpoints, installation, and software subscriptions. As utilities move from AMR to two-way AMI, system integrators and software layers capture more of project value through customer portals, analytics, and cybersecurity-aligned monitoring.
Upstream component sourcing and compliance constraints are critical for AMI and ultrasonic products, particularly electronics, batteries, and time-of-flight processing ICs that often originate with overseas suppliers even when final assembly is domestic. The December 2024 EPA/DOI Build America, Buy America waiver for AMI water meters formalized the near-term mismatch between domestic-content thresholds and available product configurations, pushing vendors toward dual sourcing, inventory buffering, and selective localization of subassemblies. Downstream, field installation capacity and contractor coordination can become bottlenecks during citywide change-outs, making turnkey offerings and metering-as-a-service contracts more attractive for smaller utilities that need predictable OPEX and reduced implementation burden.
Competitive Landscape
Sensus (Xylem), Badger Meter, Itron, Aclara (Hubbell), and Neptune Technology Group (Roper Technologies) collectively supply a majority of North American AMI endpoints, giving the market a moderately consolidated profile. Vendors now compete on life-cycle value rather than hardware price, bundling analytics platforms, customer portals, and subscription financing into integrated offerings. Badger Meter’s 2024-2025 acquisitions of s::can and SmartCover extend its portfolio from metering into distribution-network monitoring, positioning the firm as a one-stop data provider. Itron counters with its solar-battery access point that slashes rural installation costs, and with edge-compute-ready endpoints designed for future firmware upgrades.
Neptune’s software-defined radio gateway exemplifies the new chessboard: utilities can add functions via firmware, limiting future truck rolls and protecting today’s investment from protocol obsolescence. At the same time, the December 2024 Build America Buy America waiver signals latent supply-chain risk; if domestic content rules tighten after 2027, vendors without U.S. assembly lines may face import constraints. Strategically, market leaders hedge by stocking critical semiconductors and cultivating dual source agreements, sharing risk but raising working capital needs.
White-space opportunity lies in SaaS analytics purpose-built for Tier-3 utilities that lack data science teams. A low-touch dashboard that translates hourly consumption into actionable leak alerts or billing insights could unlock stalled rural demand. Vendors that deliver such simplified analytics stand to widen the total addressable base and deepen penetration, reinforcing the growth arc of the United States water meter market.
United States Water Meter Industry Leaders
Badger Meter, Inc.
Sensus USA Inc.
Neptune Technology Group Inc.
Mueller Systems, LLC
Kamstrup Water Metering LLC
- *Disclaimer: Major Players sorted in no particular order

Market Opportunities and Future Outlook
AMI program execution and funding acceleration are opening specific opportunities in planning, installation, and customer engagement layers beyond the endpoint itself. In May 2026, the U.S. EPA published FY 2026 implementation guidance covering over USD 1.6 billion in community project funding for water infrastructure. In July 2026, the EPA convened a national roundtable with water systems and state representatives focused on accelerating deployment of infrastructure funding. Together, these actions support a pipeline of projects where meters are bundled with broader distribution upgrades. Utilities are also placing more emphasis on customer-facing portals and interval data to improve billing accuracy and conservation outcomes, including WSSC Water's engagement around its AMI pilot and EyeOnWater portal in April 2026.
Larger completed utility rollouts and high-profile municipal pilots also point to opportunities in replacements, interoperability upgrades, and operations support. San Antonio Water System completed a six-year, USD 200 million initiative replacing over 600,000 meters with electronic AMI-capable devices by December 2025, highlighting the scale of multi-year change-outs and the ongoing need for lifecycle services such as commissioning, network operations, and analytics. In August 2025, the City of Houston approved an USD 8.5 million plan to replace 25,000 old meters with new smart technology as part of a pilot to address billing issues, while the City of Norfolk began AMI retrofit and replacement work in April 2026. These programs indicate ongoing demand for project delivery capacity, data-quality assurance, and AMR-to-AMI migration paths that protect prior investments. On the supply side, the December 2024 Build America, Buy America waiver provides a defined timeline for domestic-content transition, supporting opportunities for localized assembly, compliant housings, and U.S.-based electronics subassembly partnerships aligned to post-waiver procurement requirements.
Recent Industry Developments
- May 2026: Badger Meter completed its acquisition of UDlive Limited, bringing hardware-enabled software for sewer line monitoring into its BlueEdge suite. The integration broadens Badger Meter's network monitoring footprint alongside utility metering and analytics, reinforcing bundled water and wastewater data offerings for municipal customers.
- May 2026: Xylem completed the sale of Sensus International, its metering operations outside North America, to AURELIUS while retaining the North America Sensus smart metering business. The divestiture concentrates Sensus resources on North American utility requirements and simplifies the operating structure around the US-focused smart metering portfolio.
- June 2025: Neptune Technology Group introduced the MACH 10 R900i ultrasonic meter and an R900 cellular endpoint with multi-carrier support at AWWA ACE25. The launch aligns with the shift toward cellular connectivity for utilities seeking AMI capabilities without owning RF-mesh infrastructure, and it strengthens Neptune's position in static metrology and carrier-based communications.


Research Methodology Framework and Report Scope
Market Definition and Coverage
This market covers water meters installed and used in the United States to measure water consumption for billing, monitoring, and loss control across residential, commercial, and industrial connections. It includes shipments and replacements of metering hardware across common meter technologies and utility deployment approaches.
Scope exclusions: We exclude broader water-network equipment that does not directly measure consumption at the meter point, such as pumps, valves, treatment assets, and non-meter software services.
Segmentation Overview
- By Meter Type
- Smart Water Meter
- Mechanical and Basic Meter
- Ultrasonic Meter
- Electromagnetic Meter
- By Communication Technology
- Advanced Metering Infrastructure (AMI)
- Automated Meter Reading (AMR)
- Manual and Walk-by
- By Network Connectivity
- Cellular (LTE-M / NB-IoT / 5G RedCap)
- RF-Mesh 900 MHz
- PLC and Wired
- LoRaWAN
- By End-User Sector
- Residential
- Commercial
- Industrial
- Municipal Utilities
- By Utility Size Tier
- Tier-1 (Above 400 k connections)
- Tier-2 (45 k - 400 k)
- Tier-3 (<Less than 45 k)
Data Sources, Market Sizing, and Validation
Desk Research
Desk research was used to set the market boundaries and build a realistic demand pool before we spoke with industry participants. We relied on public and official sources such as the US Environmental Protection Agency (drinking water and infrastructure programs), US Census Bureau housing and construction indicators, Bureau of Labor Statistics price series that can inform equipment inflation context, and state public utility commission and state water board documents that describe metering rules and modernization plans.
We also referenced non-paywalled technical and policy materials from groups such as the American Water Works Association, along with utility capital improvement plans, municipal budget documents, and procurement portals that show meter replacement timing and scale, including AMI conversions. Additional context came from SEC filings and investor presentations of public companies active in metering, plus credible trade press coverage of rollout schedules, lead times, and standards changes. Where needed, a paid subscription for company financials and intelligence was used to cross-check business exposure, and a patent database was used to track activity around ultrasonic measurement and communication modules. The sources listed here are illustrative and not exhaustive, and many other public references were used to collect, validate, and clarify data points during the study.
Primary Interviews and Surveys
Primary work focused on interviews and structured surveys with water utilities, meter OEMs, distributors, and installation and service partners, so shipment assumptions could be linked back to replacement cycles and rollout pacing. We also tested desk assumptions on AMI versus AMR choices, lead time constraints, and pricing direction, then reconciled differences across utility-size cohorts before finalizing the model.
Distribution of primary research fieldwork respondents
| Company type | Respondent position | Region |
|---|---|---|
| Top tier: 31% | CXOs: 13% | |
| Mid tier: 55% | Functional/Unit leaders: 29% | |
| Smaller Players: 14% | Managers: 58% |
Market-Sizing & Forecasting
Sizing was built using top-down and bottom-up logic. The starting point was a demand pool reconstructed from the US service-connection base and replacement cycles, which was then checked against what suppliers and channels described as realistic shipment volumes. Because this is often a replacement-led market, the model uses practical inputs like meter life assumptions by technology, the pace of AMI and AMR program conversions, new housing and service-connection adds, and observed lead-time conditions that can shift a year's shipments.
Forecasting leaned on scenario analysis, since utility funding timing and procurement approvals can pull demand forward or push it out. Assumptions were stress-tested through primary feedback on rollout cadence, the share of smart meters within total replacements, and typical order batching patterns by utility size. When bottom-up signals were incomplete for smaller utilities or fragmented installers, gap handling used validated penetration and replacement rates applied to the addressable connection base, then totals were rechecked against distributor activity and sampled price-per-unit ranges.
Data Validation & Update Cycle
Validation was done through multiple checks so the final totals do not depend on a single assumption. We compared modeled volumes with independent signals such as public utility program announcements, procurement calendars, and observable shifts in metering technology adoption, then reviewed any large variances at the state and utility-size level.
Before sign-off, the dataset and calculations are reviewed in more than one analyst pass. Unusual movements trigger follow-up outreach to confirm whether timing, pricing, or scope was misunderstood. The report is refreshed annually, and interim updates are done when material policy, funding, or supply changes occur. Right before delivery, a final review pass is completed so clients receive the most current view available.
Mordor Intelligence's United States Water Meter Market Size Measured Against Other Published Estimates
Published market sizes for US water meters often differ because the unit of measurement is not consistent, and because the counted scope can shift between total meters, only smart meters, or even broader metering program spend. Timing also matters, since some estimates are anchored to award announcements, while others wait for shipments and installations to be recognized.
The biggest gaps usually come from whether mechanical meters are included alongside smart meters, how replacements versus new connections are treated, and how utility rollouts are timed when multi-year contracts are awarded. Here, the count is kept on shipped and installed meter units across smart and mechanical types, with replacement-cycle math and utility program pacing used as the main drivers, which is handled this way in Mordor Intelligence.
Benchmark comparison
| Source | Market Size | Gaps in Research Methodology |
|---|---|---|
| Mordor Intelligence | USD 25.09 M (2025) | |
| Industry Publisher A | USD 1.10 B (2026) | This figure is value-based and centered on smart water metering spend, which typically excludes a large share of mechanical meter replacements and mixes hardware with rollout and program services. |
| Regional Consultancy B | USD 14.47 M (2031) | This estimate appears to be limited to a narrower demand slice and does not align with a total US shipment view across utility tiers, which can understate replacement-led volume in a mature installed base. |
The spread across the table is mainly explained by unit choice (value versus units), scope choices (smart-only versus total meters), and how installation timing is recognized when programs run for several years. By keeping the drivers tied to replacements, connection adds, and rollout pacing, the final number remains traceable to practical variables that can be checked and repeated.


Key Questions Answered in the Report
How large is the United States water meter market in unit terms today?
The market stood at 26.16 million units in 2026 and is on track to reach 31.57 million units by 2031.
What is driving the shift from AMR to AMI among U.S. utilities?
IIJA funding, tighter state conservation mandates, and the need for two-way data to manage leaks and remote disconnects are accelerating the transition.
Why are small, rural utilities slower to adopt smart meters?
Up-front capital constraints, limited grant-writing staff, and higher per-endpoint network costs hinder rapid deployment in Tier-3 systems.
Which connectivity technology is gaining the most traction in rural areas?
Cellular LTE-M, NB-IoT, and emerging 5G RedCap links are expanding fastest because they remove the need for proprietary mesh gateways.
How are vendors responding to supply-chain risks for ultrasonic meter components?
Manufacturers are dual-sourcing critical ICs, increasing safety stock, and lobbying for domestic content waivers while planning longer-term U.S. assembly capacity.
Page last updated on:


