
Market Overview
| Study Period | 2021 - 2031 |
|---|---|
| Forecast Data Period | 2026 - 2031 |
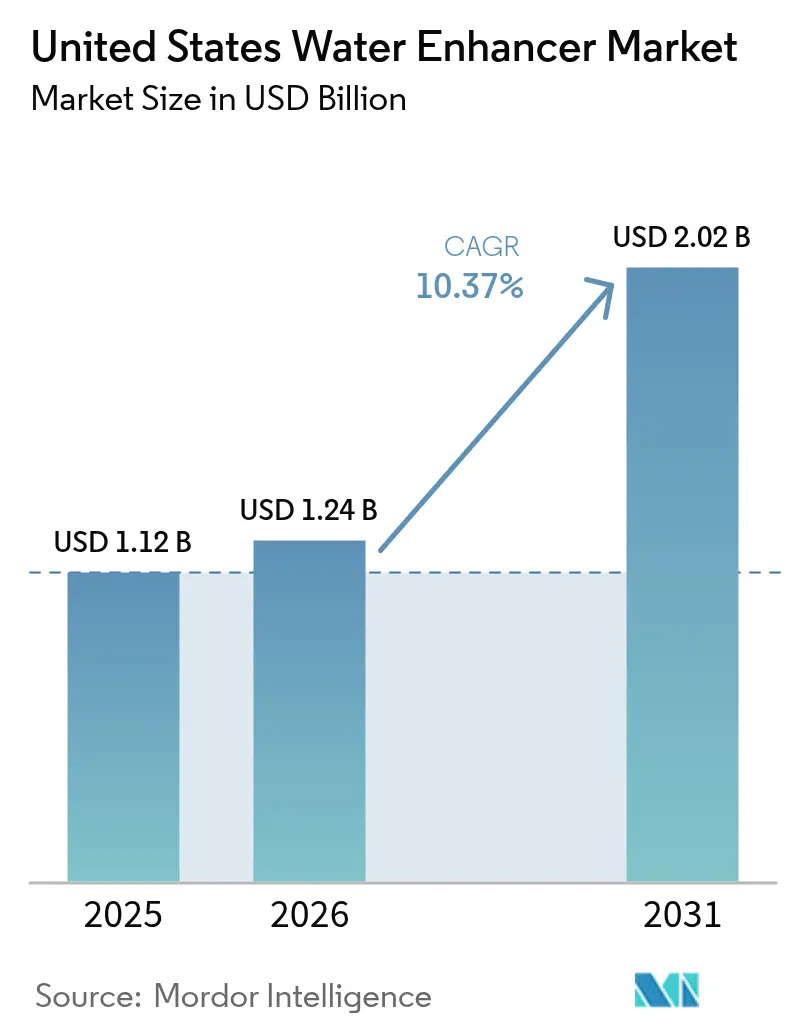
| Base Year Market Size (2025) | USD 1.12 Billion |
| Market Size (2026) | USD 1.24 Billion |
| Market Size (2031) | USD 2.02 Billion |
| Growth Rate (2026 - 2031) | 10.37 % |
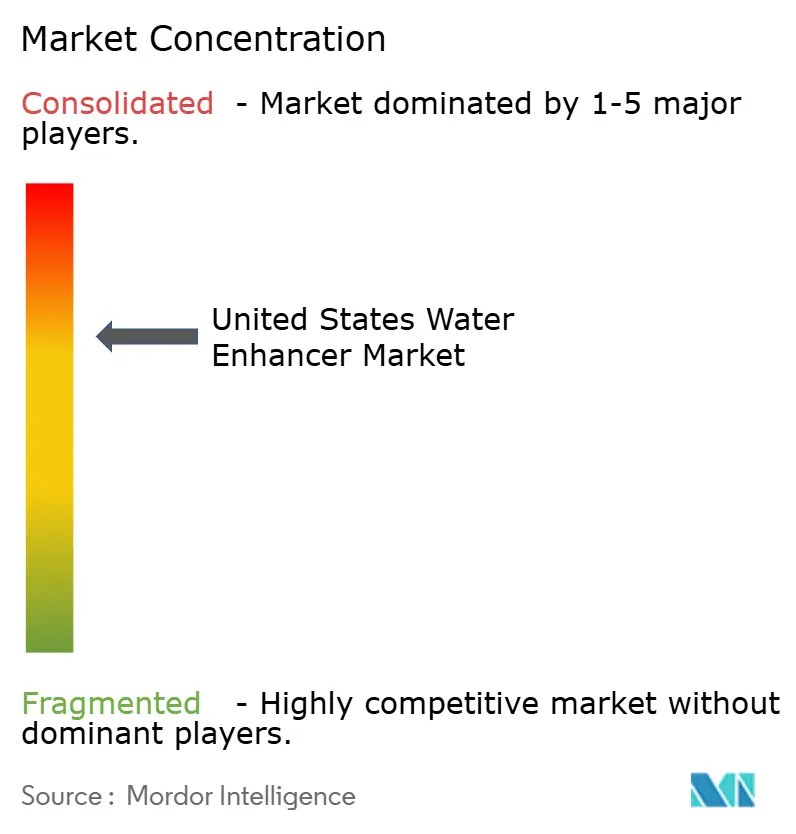
| Market Concentration | Medium |
Major Players *Disclaimer: Major Players sorted in no particular order Image © Mordor Intelligence. Reuse requires attribution under CC BY 4.0. | |
United States Water Enhancer Market Analysis by Mordor Intelligence
The United States water enhancer market size was valued at USD 1.12 billion in 2025 and estimated to grow from USD 1.24 billion in 2026 to reach USD 2.02 billion by 2031, at a CAGR of 10.37% during the forecast period (2026-2031). Water enhancer drops represent a fast-growing segment within the functional beverage market. This robust market trajectory is primarily fueled by shifting consumer preferences toward products that offer both convenience and health benefits. Water enhancer drops are favored for their portability, ease of use, and ability to instantly transform plain water into flavorful, nutrient-enriched drinks. This aligns with the growing trend of personalized nutrition, as consumers increasingly seek customizable hydration solutions that fit their individual taste preferences, dietary needs, and wellness goals. The market’s expansion is further supported by the proliferation of health-conscious lifestyles, with consumers actively reducing their intake of sugary sodas and traditional soft drinks in favor of low-calorie, sugar-free, and functional alternatives. Leading brands have responded with innovative formulations that incorporate vitamins, electrolytes, antioxidants, and adaptogens, catering to demands for products that support energy, immunity, and overall well-being. The clean-label movement, emphasizing natural flavors, plant-based ingredients, and transparent sourcing, also plays a key role in driving adoption among discerning shoppers.
Key Report Takeaways
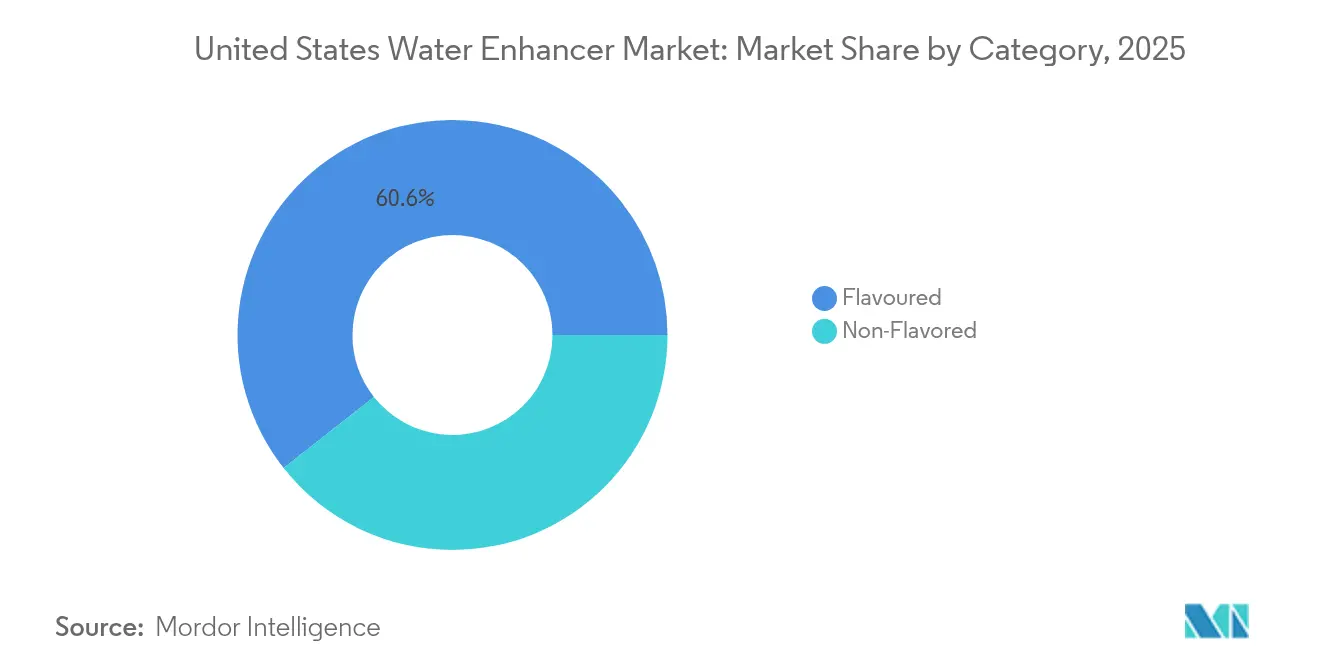
- By product type, the flavoured segment held 60.62% of the United States water enhancer market share in 2025, whereas the non-flavoured segment is projected to grow at 10.78% CAGR through 2031.
- By form, the powder segment held 34.71% of the United States water enhancer market share in 2025, whereas the tablets segment is projected to grow at a 11.88% CAGR through 2031.
- By ingredient source, artificial/synthetic formulations commanded 61.68% share of the United States water enhancer market size in 2025; natural/organic variants are expanding at 12.47% CAGR to 2031.
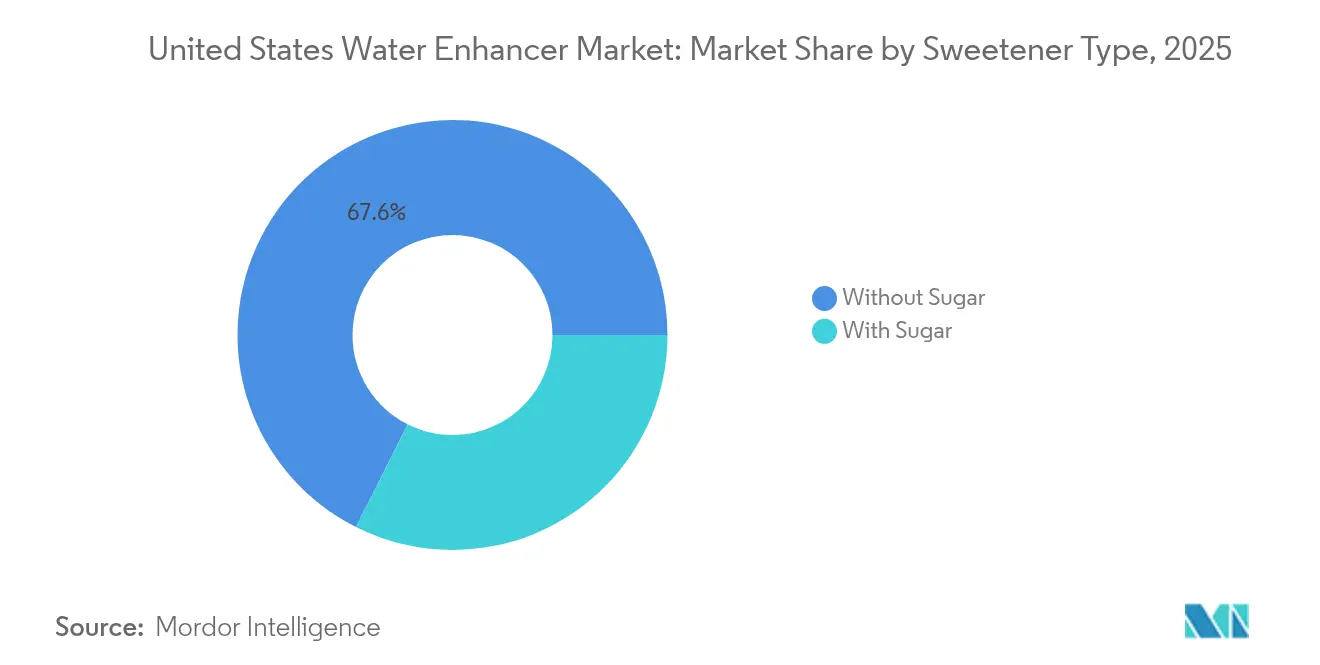
- By sweetener type, without sugar captured 67.59% share of the United States water enhancer market size in 2025, while with-sugar products show a faster 11.93% CAGR outlook.
- By distribution channel, supermarkets/hypermarkets held a share of 53.44% of 2025 revenue; online retail stores are expected to grow at a 15.72% CAGR from 2026 to 2031.
Note: Market size and forecast figures in this report are generated using Mordor Intelligence’s proprietary estimation framework, updated with the latest available data and insights as of 2026.
United States Water Enhancer Market Trends and Insights
Drivers Impact Analysis*
| Driver | (~) % Impact on CAGR Forecast | Geographic Relevance | Impact Timeline |
|---|---|---|---|
| Health-conscious consumers turning to low-calorie, sugar-free beverages drives demand | +3.0% | Nationwide, strongest in coastal states | Medium term (2-4 years) |
| Fitness and wellness trends drive surge in electrolyte enhancer usage | +2.5% | Urban fitness hubs and college towns | Long term (≥ 4 years) |
| Major beverage firms’ marketing and innovation fuel consumer engagement | +2.0% | Nationwide, especially mass retail chains | Medium term (2-4 years) |
| Beverage brands collaborate with fitness influencers, boosting market presence | +1.6% | Social-media-savvy demographics | Short term (≤ 2 years) |
| Wider retail channels expand beverage accessibility across the United States | +1.4% | Multi-format retail networks | Medium term (2-4 years) |
| On-the-go hydration solutions gain favor amid rising convenience demand | +2.2% | Major metropolitan areas | Short term (≤ 2 years) |
| Source: Mordor Intelligence | |||
Health-conscious consumers turning to low-calorie, sugar-free beverages drives demand
The increasing number of health-conscious consumers drives the demand for low-calorie and sugar-free beverages, as people aim to avoid health issues associated with excessive sugar consumption, such as obesity and diabetes. This trend is particularly evident in the United States, where beverage companies like Coca-Cola, PepsiCo, and Nestlé are expanding their portfolios with functional waters. These products typically contain zero sugar, low calories, and are fortified with vitamins and proteins. The market is experiencing growth in clean-label and functional beverages, including probiotic kombuchas and vitamin-enhanced waters, driven by the rising prevalence of diabetes, obesity, and fitness-focused lifestyles. According to the Centers for Disease Control and Prevention (CDC), between August 2021 and August 2023, the adult obesity rate was 40.3%, with no significant differences between men and women. The prevalence of obesity was higher among adults aged 40-59 compared to those aged 20-39 and 60 and older [1].
Fitness and wellness trends drive surge in electrolyte enhancer usage
The expansion of the water enhancer market in the United States is primarily attributed to the increasing adoption of fitness and wellness practices, particularly within professional fitness establishments. The integration of structured exercise regimens, organized group sessions, and personalized training programs into daily routines has generated substantial demand for advanced hydration solutions. Health-conscious individuals and athletes recognize that rigorous physical activity can lead to significant electrolyte depletion through perspiration, necessitating proper replenishment to maintain optimal energy levels, prevent muscle cramps, and ensure efficient physiological function. As a result, fitness establishments have implemented strategic initiatives to distribute and retail water enhancement products through dedicated hydration facilities and automated dispensing systems. According to the Health & Fitness Association (HFA), the membership in professional fitness establishments, including gyms, studios, and specialized facilities, encompasses 77 million Americans, constituting 25% of the population aged six years and above in 2024 [2].
Major beverage firms' marketing and innovation fuel consumer engagement
Major beverage companies drive growth in the United States water enhancer market through strategic marketing and product innovation. Companies like Kraft Heinz, Coca-Cola, PepsiCo, and Nestlé utilize their brand strength, distribution networks, and research capabilities to develop new flavors and functional formulations that align with consumer preferences for health, convenience, and customization. These companies implement comprehensive marketing strategies across traditional and digital channels, including advertising campaigns, influencer collaborations, and direct-to-consumer programs. PepsiCo's marketing commitment is evident in its selling, general, and administrative expenses, which reached USD 5.9 billion in 2024 and USD 5.7 billion in 2023. This investment supports both new product launches and ongoing promotion of existing brands. The marketing initiatives increase product awareness and educate consumers about water enhancers as convenient hydration solutions. Through continuous product development and sustained marketing investment, these beverage companies expand the water enhancer category and strengthen consumer engagement in the United States market.
Beverage brands collaborate with fitness influencers, boosting market presence
Water enhancer manufacturers establish strategic collaborations with fitness industry professionals to develop product endorsements that effectively target health-conscious consumer segments. These partnerships encompass comprehensive product development initiatives and educational materials demonstrating optimal water enhancement applications across diverse consumer demographics. The implementation of influencer-based marketing strategies facilitates enhanced consumer education regarding water enhancer application, appropriate dosage levels, and flavor compatibility matrices, surpassing the capabilities of conventional advertising methods. Digital platforms enable water enhancer manufacturers to gather real-time consumer feedback and implement product modifications based on user preferences and performance metrics. This strategic approach addresses consumer hesitation regarding water enhancement experimentation, which traditionally impedes initial product adoption rates.
Restraints Impact Analysis*
| Restraint | (~) % Impact on CAGR Forecast | Geographic Relevance | Impact Timeline |
|---|---|---|---|
| Stringent food and beverage regulations hinder product development and approvals | -1.70% | Federal and state regulatory environments | Long term (≥ 4 years) |
| Intense competition from flavored bottled water and soft drinks curtails market share | -2.40% | Nationwide mass-market channels | Medium term (2-4 years) |
| Consumer concerns over artificial sweeteners and additives reduce trust in some products | -1.50% | Health-conscious consumer segments | Medium term (2-4 years) |
| Environmental worries about plastic packaging impact eco-conscious consumers | -1.20% | Sustainability-focused regions | Long term (≥ 4 years) |
| Source: Mordor Intelligence | |||
Stringent food and beverage regulations hinder product development and approvals.
The water enhancer industry faces significant barriers due to complex regulations. The FDA's Generally Recognized as Safe (GRAS) framework permits companies to self-determine ingredient safety without mandatory government review, which raises potential safety concerns and leads to stricter regulations. The European Food Safety Authority's assessment of steviol glycosides illustrates the impact of regulatory changes on product formulations, noting that proposed modifications could exceed acceptable daily intake levels for toddlers at 6.9 mg/kg body weight per day [3]. Manufacturers must allocate substantial resources to compliance documentation and product reformulation, reducing investments in innovation and market expansion. Regional regulatory differences require product modifications for different markets, limiting the ability to scale successful formulations globally. The high costs of regulatory compliance particularly affect smaller companies, potentially increasing market concentration among larger companies with established regulatory departments.
Intense competition from flavored bottled water and soft drinks curtails market share
The water enhancer market faces strong competition from established beverage categories that offer similar benefits of convenience and flavor, along with wider distribution networks. Flavored bottled water companies use their existing retail presence and brand recognition to introduce functional products that compete with beverage enhancers while maintaining the simplicity of ready-to-drink formats. Soft drink companies address health trends by introducing reduced-sugar options and functional formulations that align with wellness preferences without changing consumer drinking habits. The competition increases as large beverage companies have larger marketing budgets and distribution networks to quickly launch new products across multiple channels. This competitive environment requires beverage enhancer manufacturers to lower prices while investing in premium ingredients and unique benefits, which reduces profit margins and limits funds available for growth.
*Our forecasts treat driver/restraint impacts as directional, not additive. The impact forecasts reflect baseline growth, mix effects, and variable interactions.
Segment Analysis
By Product Type: Flavored Water Enhancers Dominate Consumer Preferences
Flavored water enhancers hold 60.62% of the market share in 2025, as consumers prefer taste-enhanced hydration options over plain water alternatives. This market leadership position results from the segment's effectiveness in making water more palatable, addressing the common consumer challenge of drinking unflavored water. Non-flavored water enhancers, despite their smaller market presence, are experiencing significant growth with an 10.78% CAGR through 2031. This growth is primarily due to increasing demand from health-focused consumers who seek functional benefits without artificial flavoring additives.
The market shows increased adoption of botanical and herbal extracts that combine taste with wellness attributes. Calming ingredients such as lavender, chamomile, and lemongrass are becoming popular in both alcoholic and non-alcoholic beverages. Consumer demand is shifting toward less sweet formulations with natural taste profiles, prompting manufacturers to develop products with exotic fruit flavors like yuzu and lychee. The market also sees growth in umami-based formulations using vegetable ingredients. These developments align with broader beverage industry trends toward complex flavor profiles that support premium pricing strategies while meeting diverse consumer preferences.

By Form: Powder Water Enhancers Dominates the Market
Powder water enhancers command a share of 34.71% in the United States Water Enhancers market. Their cost-effectiveness compared to liquid variants makes them an economical choice for both consumers and manufacturers. The extended shelf life of powder formulations, coupled with easier storage and transportation capabilities, significantly reduces logistics costs. Additionally, powder enhancers offer superior portion control and customization options, allowing consumers to adjust the flavor intensity according to their preferences. The convenience of single-serve packaging and portability has particularly resonated with the on-the-go lifestyle of American consumers.
Tablet water enhancers have emerged as the fastest-growing segment with a CAGR of 11.88% from 2026 to 2031 in the United States Water Enhancers market. The convenience and portability of tablet formats have significantly contributed to their rising popularity among consumers, particularly those leading active lifestyles. These tablets are compact, lightweight, and easy to store, making them ideal for on-the-go consumption. Additionally, tablet water enhancers offer precise dosing, eliminating the risk of over-flavoring that sometimes occurs with liquid enhancers. The segment's growth is further driven by eco-conscious consumers who appreciate the reduced plastic packaging compared to liquid alternatives. The tablets' longer shelf life and cost-effectiveness, as one tablet typically flavors multiple servings, have also contributed to their market dominance.
By Ingredient Source: Natural Transition Accelerates Despite Synthetic Dominance
In the water enhancer market, artificial/synthetic ingredients maintain 61.68% market share in 2025, supported by cost advantages and established supply chains that facilitate competitive pricing strategies. Natural/organic water enhancer alternatives demonstrate significant momentum, growing at 12.47% CAGR through 2031, driven by heightened consumer awareness of ingredient sourcing and increased regulatory oversight of synthetic additives. This market transformation reflects broader clean label preferences, as consumers increasingly view artificial sweeteners in water enhancers as less favorable and seek recognizable ingredients.
The natural ingredient segment in water enhancers has progressed through technological advancements in sweetener combinations that address taste and functionality requirements. Market participants like Sweetleaf and Stur Drinks manufacture zero-calorie natural sweeteners specifically designed for water enhancement applications, while ingredient suppliers develop specialized natural sweetener systems for water enhancer formulations. The price premium of natural ingredients creates market stratification, with premium water enhancer brands offering natural formulations and mass market products retaining synthetic ingredients to maintain accessibility. This strategic approach enables water enhancer manufacturers to serve both value-conscious and health-focused consumers while systematically transitioning toward natural alternatives as supply chains mature and production costs decrease.
By Sweetener Type: Sugar-Free Formulations Lead Market Evolution
Without sugar formulations hold a 67.59% share of the United States water enhancer market in 2025, reflecting their success as healthier alternatives to traditional sweetened beverages. These products attract calorie-conscious and health-focused consumers. The segment's market leadership aligns with increasing consumer preference for reduced sugar consumption and diabetes management. Food and Drug Administration (FDA) regulations on acceptable daily intake levels for non-nutritive sweeteners provide consumers with safety assurance and transparency. Manufacturers continue to improve sugar-free water enhancers by combining natural and artificial sweeteners like stevia, monk fruit, sucralose, and allulose to enhance taste and texture. These products often include functional ingredients such as vitamins, electrolytes, and antioxidants to increase consumer value.
Water enhancers with sugar, despite their smaller market share, are growing at a CAGR of 11.93% through 2031. This growth stems from consumers who prefer traditional sugar taste profiles and express concerns about artificial sweetener consumption. These consumers seek products with authentic sugar flavor and clear ingredient lists. Manufacturers in this segment use natural sweeteners like cane sugar or honey and market their products as premium options for occasional consumption. They differentiate their offerings through unique and nostalgic flavors.
By Distribution Channel: E-commerce Disrupts Traditional Retail Patterns
Supermarkets and hypermarkets dominate the water enhancer distribution in the United States, holding a 53.44% market share in 2025. These retailers position beverage enhancers in dedicated beverage aisles to increase visibility and encourage purchases. They implement in-store promotions, end-cap displays, and sampling events to drive product trials and brand switching. Their extensive product selection and efficient supply chains ensure consistent availability for consumers.
Online retail is expected to grow at a 15.72% CAGR through 2031. This growth aligns with increased e-commerce adoption in the United States, driven by consumer preferences for convenience and home delivery. Online platforms such as Amazon, Walmart.com, and brand websites allow consumers to compare products, access reviews, and purchase from a broader product range, including exclusive flavors. Digital channels enable brands to gather consumer data on preferences and buying patterns to inform marketing strategies and product development.
Regulatory Landscape
In the United States, water enhancers are regulated as conventional foods and food additives under the Federal Food, Drug, and Cosmetic Act (21 U.S.C. 348) and implementing rules such as 21 CFR Part 170, with additional requirements when products use color additives (for example, listings under 21 CFR Parts 73 and 74). Manufacturers typically rely on ingredient clearances through food additive regulations or the FDA GRAS framework administered through the Office of Food Additive Safety, and they must align label and formulation decisions with authorized conditions of use for sweeteners, flavors, acids, and functional ingredients in concentrates, powders, and tablets.
Regulatory updates in 2026 reinforced ongoing compliance needs for water enhancer formulations that use coloring systems and imported inputs. In February 2026, FDA issued a final amendment expanding the safe use of spirulina extract as a color additive (21 CFR 73.530), and the FDA Human Foods Program listed 2026 priority deliverables that include draft guidance on when fruit- and vegetable-derived juices qualify as color additives. On the trade and import side, USITC HTSUS Revision 11 took effect July 2, 2026, increasing the importance of accurate customs classification for imported ingredients and packaging components used in these products, particularly where Section 301 tariff scoping can affect total landed costs.
Value Chain Analysis
The value chain begins with inputs such as flavors, acids, sweeteners (including non-nutritive systems), botanicals, and permitted color systems, which then support formulation and scale-up by branded manufacturers and a broad contract manufacturing and co-packing base. Contract manufacturers and packers commonly handle dry blending and stick-pack packaging for powders, liquid concentrate filling for drops, and effervescent tableting and pouching for tablets, alongside QA/QC and documentation to support FDA-aligned ingredient status (food additive authorization or GRAS basis) prior to commercialization.
Downstream, brands distribute finished goods through national and regional distributors into mass retail and e-commerce, where supermarkets and hypermarkets serve as a key volume channel in the United States. Logistics and packaging choices vary by format: liquid concentrates face higher freight sensitivity, while powders and tablets have lower shipping weight and improved shelf stability, which supports broader online penetration and subscription replenishment models. Large beverage and water platform operators with coast-to-coast manufacturing and distribution footprints (for example, Primo Brands) illustrate how multi-site networks and away-from-home channels can help expand availability, even as ingredient and packaging supply constraints can affect lead times for specialized flavors and high-barrier stick-pack materials.
Competitive Landscape
The water enhancer market shows moderate concentration, with competition between established food and beverage companies, wellness brands, and direct-to-consumer companies. Major players like PepsiCo, Coca-Cola, and Kraft Heinz maintain competitive advantages through their extensive distribution networks and marketing capabilities. This market structure enables mid-sized companies to develop successful niche positions through specialized formulations or focused demographic targeting.
Companies prioritize innovation in delivery formats and functional benefits over price competition, focusing on developing proprietary sweetener combinations and sustainable packaging. The market presents opportunities in personalized nutrition and subscription-based delivery models that use consumer data to refine flavor preferences and consumption patterns.
Manufacturers are implementing automation and quality control systems to maintain product consistency while reducing operational costs. The competitive environment continues to transform as regulatory requirements and shifting consumer preferences present both challenges and opportunities for market participants.
United States Water Enhancer Industry Leaders
-
The Kraft Heinz Company
-
PepsiCo, Inc.
-
The Coca-Cola Company
-
Nestlé S.A
-
Unilever PLC
- *Disclaimer: Major Players sorted in no particular order
Market Opportunities and Future Outlook
Product whitespace is forming around multifunctional hydration that goes beyond flavor, with major brand activity focused on electrolyte-forward and nutrition-adjacent mixes. In May 2026, PepsiCo introduced Propel Clear Protein (ready-to-mix powder combining 20g protein, fiber, and electrolytes), signaling a premium tier that links water enhancers to satiety, fitness routines, and GLP-1-era consumption behaviors. This creates room for competitors and smaller brands to differentiate with condition-specific benefits (electrolytes plus targeted vitamins, caffeine-free energy, or stress and sleep positioning) while using powders and tablets for portability and lower shipping costs.
Clean-label renovation also presents an active opportunity, particularly for water enhancers that depend on color and sweetener systems. Kraft Heinz announced Kool-Aid Hydration electrolyte packets in May 2026 formulated without artificial dyes, and FDA actions in 2026 around color additive uses (including the February 2026 final rule expanding spirulina extract use and HFP work on guidance for fruit- and vegetable-derived juice colors) increase the practical relevance of reformulation pathways for brands seeking to move away from synthetic colors. Alongside the market shift toward reduced-plastic formats (tablets and stick packs) and the rapid growth of online retail, these moves support new launches that pair recognizable ingredient lists with simplified claims and compliance documentation, in bottle-compatible formats for at-home and on-the-go consumption.
Recent Industry Developments
- May 2026: PepsiCo launched Propel Clear Protein, a ready-to-mix functional hydration powder combining protein, fiber, and electrolytes. The launch expands water enhancer use cases from flavoring into nutrition-linked hydration routines and raises competitive pressure for multifunctional powder formulations in mass retail and online channels.
- May 2026: The Kraft Heinz Company rolled out Kool-Aid Hydration, an electrolyte packet line positioned without artificial dyes. The move modernizes a legacy brand for clean-label shopper expectations and intensifies reformulation activity among powdered water enhancer competitors.
- April 2025: MiO expanded its liquid water enhancer lineup with MiO Unwind, targeting stress-relief positioning within functional hydration. The extension underscores continued innovation in benefit-led variants as brands seek incremental occasions beyond basic flavor enhancement.
Research Methodology Framework and Report Scope
Market Definition and Coverage
For this study, the market covers retail and online sales of water enhancer products in the United States, where a concentrate or mix is added to plain water to change taste and, in some cases, add functional benefits.
Scope exclusions: We exclude ready-to-drink beverages, such as bottled flavored water and enhanced water that are sold as finished drinks.
Segmentation Overview
- By Category
- Flavoured
- Non-Flavored
- By Form
- Powder
- Tablets
- Liquids
- By Ingredient Source
- Natural/Organic
- Artificial/Synthetic
- By Sweetener Type
- With Sugar
- Without Sugar
- By Distribution Channel
- Supermarkets/Hypermarkets
- Convenience Stores
- Online Retail Stores
- Pharmacy and Health Stores
- Other Distribution Channels
Data Sources, Market Sizing, and Validation
Desk Research
Desk research was used to map the category and set realistic assumptions for consumption behavior, channels, and price points before the model was built. We reviewed public materials such as the US Census Bureau retail trade data, US Bureau of Labor Statistics price and inflation series, USDA food and nutrition references, and FDA labeling and ingredient guidance that shapes what brands can claim and how formulations are presented.
To ground the commercial picture, we also used sources such as company annual reports and investor presentations, major retailer and marketplace listings to observe pack sizes and price ladders, and reputed press coverage around new product launches and reformulations. Where needed, paid subscriptions for company financials and news, patent databases, and shipment-level import and export views were used to sanity check activity signals and category momentum. These examples are not exhaustive, and many other public and paid sources were also referred to for data collection, validation, and clarification.
Primary Interviews and Surveys
Primary work focused on interviews and surveys with brand-side managers, distributors, and channel specialists across grocery, convenience, and online retail, so the model could be aligned to real shelf behavior. We used these conversations to confirm what counts as a water enhancer purchase, the typical price progression by format, and how natural, sugar-free, and functional claims affect velocity across different parts of the country.
Distribution of primary research fieldwork respondents
| Company type | Respondent position |
|---|---|
| Top tier: 39% | CXOs: 15% |
| Mid tier: 46% | Functional/Unit leaders: 31% |
| Smaller Players: 15% | Managers: 54% |
Market-Sizing & Forecasting
Sizing starts with a top-down build that reconstructs the demand pool from US beverage mix behavior, category penetration for add-in enhancers, and channel splits across supermarkets, convenience, and online, which are then converted into dollars using observed pack sizes and pricing. The totals are then corroborated through selective bottom-up approximations, including sampled SKU price checks, format-level volume proxies, and supplier and channel feedback, so outliers can be corrected before finalization.
Key inputs used in the model include average selling price by form (liquids, powders, tablets), the share of sugar-free versus with-sugar products, the mix of natural or organic versus artificial positioning, the online share shift, and expected new product activity in functional variants (such as electrolyte or vitamin-forward options). When a bottom-up signal is incomplete for a smaller channel or niche format, gaps are handled by applying conservative proxy shares from adjacent channels, followed by a second pass with interview-led corrections. For forecasting, scenario analysis is used around price inflation, channel mix change, and claim-led trade-up, and the final curve is selected only after expert feedback confirms the assumptions feel realistic for the next few years.
Data Validation & Update Cycle
Validation is done through step-by-step checks that compare model outputs with independent signals, such as observed retail price bands, channel growth patterns, and shifts in mix toward sugar-free and natural claims. When a variance looks high, we re-check definitions, revisit the assumptions, and re-contact a subset of primary sources to confirm whether the change is real or model-driven.
Before sign-off, the analysis goes through multiple internal reviews, and anomalies are traced back to the input that caused them so the correction is transparent. Reports are refreshed annually, and interim updates are made when material events occur, such as major regulatory changes, sharp pricing moves, or meaningful channel disruptions. Right before delivery, a final review pass is completed so the view reflects the latest available information.
Mordor Intelligence's United States Water Enhancer Market Sizing Compared With Other Published Estimates
Published market numbers for US water enhancers can look far apart because each publisher makes different choices on what products count, which channels are included, and which year is treated as the starting point. Differences in how prices are averaged, how online growth is treated, and how often assumptions are refreshed also create visible gaps.
Some estimates fold ready-to-drink enhanced or flavored water into the same bucket, or they generalize from a broader functional beverage view with limited checks on add-in formats. In Mordor Intelligence's sizing, only add-in water enhancer products are counted, and ready-to-drink flavored and enhanced water is excluded, which keeps the total aligned to pack-size and channel-specific pricing that can be verified.
Benchmark comparison
| Source | Market Size | Gaps in Research Methodology |
|---|---|---|
| Mordor Intelligence | USD 1.12 B (2025) | |
| Industry Publisher A | USD 0.70 B (2025) | Uses a narrower demand view that leans on conservative adoption assumptions for enhancer usage, and it can undercount online and convenience channel contribution when channel mix is simplified. |
| Industry Publisher B | USD 0.60 B (2024) | Uses an earlier base year and a tighter category definition, and it typically applies broader average prices by type without fully reflecting form-level pack sizes and the faster trade-up in sugar-free and functional variants. |
Across the three figures, the spread is mainly explained by product inclusion choices, base-year timing, and how pricing and channel mix are handled. Our approach stays repeatable because each step ties back to observable variables, and then the final number is adjusted only when interview feedback confirms the assumption is practical in market.
Key Questions Answered in the Report
What is the current value of the United States water enhancer drops market?
The United States water enhancer market stands at USD 1.24 billion in 2026.
How fast is the United states water enhancer market expected to grow?
It is projected to expand at an 10.37% CAGR, reaching USD 2.02 billion by 2031.
Which product type leads the United States water enhancer market?
Flavored water enhancers held 60.62% market share in 2025.
Why are without sugar variants so dominant?
Without sugar water enhancers captured 67.59% share in 2025, supported by consumer efforts to cut calories and regulatory guidance on sugar reduction.