
Market Overview
| Study Period | 2021 - 2031 |
|---|---|
| Forecast Data Period | 2026 - 2031 |
| Base Year Market Size (2025) | USD 1.56 Billion |
| Market Size (2026) | USD 1.64 Billion |
| Market Size (2031) | USD 2.12 Billion |
| Growth Rate (2026 - 2031) | 5.24 % |
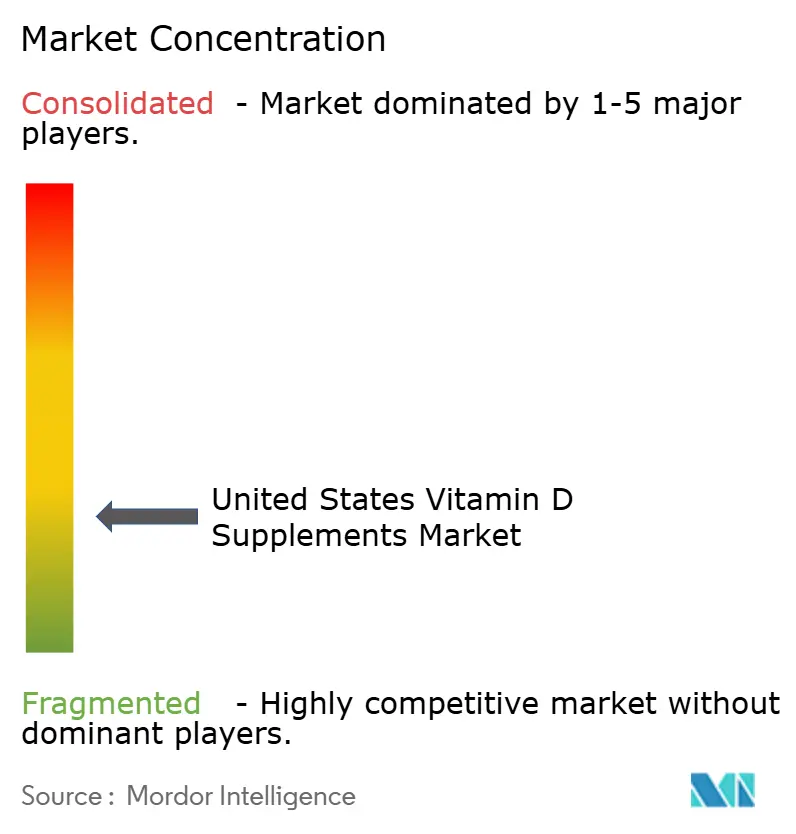
| Market Concentration | Low |
Major Players *Disclaimer: Major Players sorted in no particular order Image © Mordor Intelligence. Reuse requires attribution under CC BY 4.0. | |
United States Vitamin D Supplements Market Analysis by Mordor Intelligence
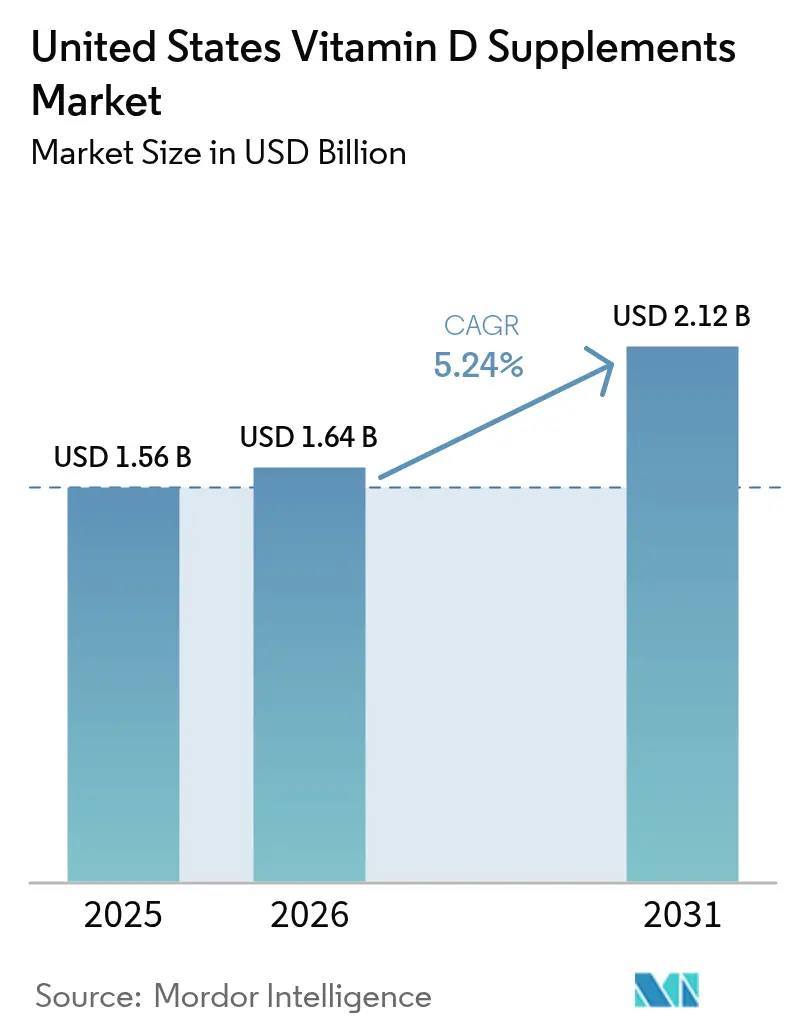
The United States vitamin D supplements market size was valued at USD 1.56 billion in 2025 and estimated to grow from USD 1.64 billion in 2026 to reach USD 2.12 billion by 2031, at a CAGR of 5.24% during the forecast period (2026-2031). The market growth is driven by three key factors: increasing vitamin D deficiency across ethnic groups, an aging population seeking supplements for osteoporosis management, and updated clinical guidelines targeting specific risk groups. The market is experiencing product innovation through diverse delivery formats, including gummies and high-bioavailability calcifediol, while e-commerce platforms enhance accessibility and price transparency. Moreover, the Western region shows strong growth due to health-conscious consumers and digital adoption, while the South maintains the largest market share due to its population size and prevalence of bone-related conditions.
Key Report Takeaways
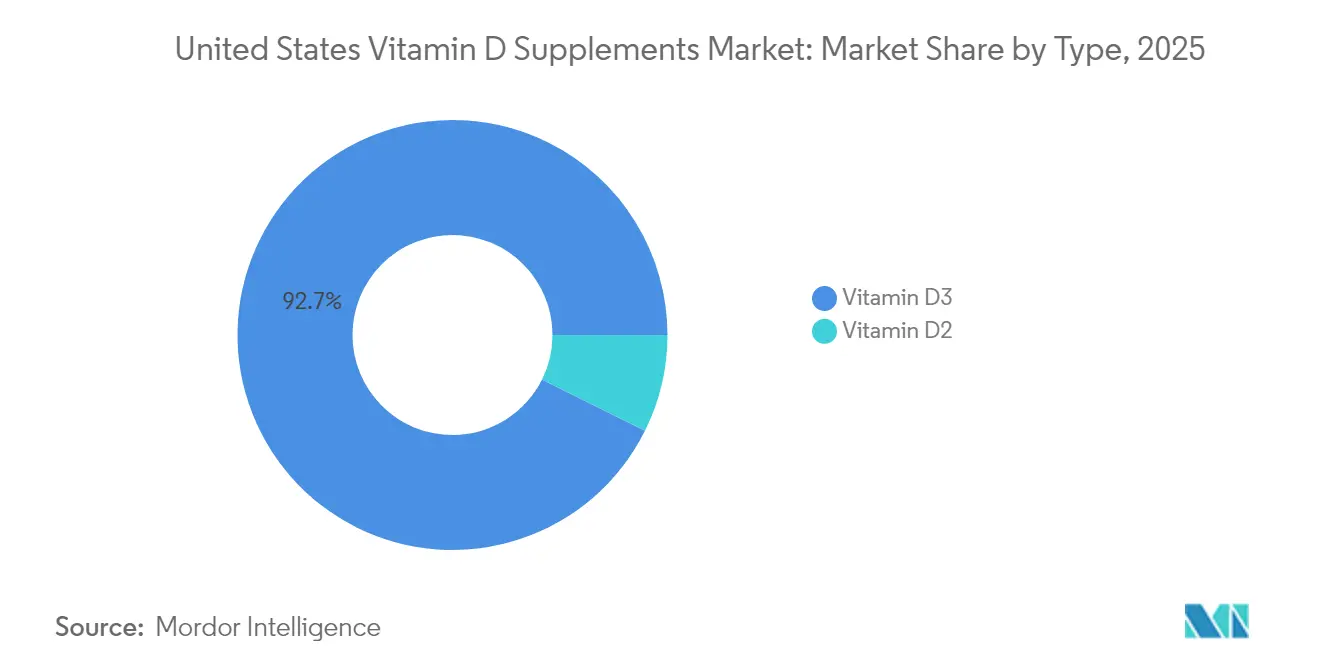
- By type, vitamin D3 dominated with 92.65% of the United States vitamin D supplements market share in 2025 and is growing at a 6.02% CAGR through 2031.
- By form, capsules and soft gels maintained the largest revenue share at 34.12% in 2025, while gummies demonstrate strong growth potential with a projected 6.62% CAGR to 2031.
- By source, animal-based ingredients maintained a substantial 70.58% share in 2025, with plant-based/vegan alternatives showing the highest growth rate at 7.01% CAGR during 2026-2031.
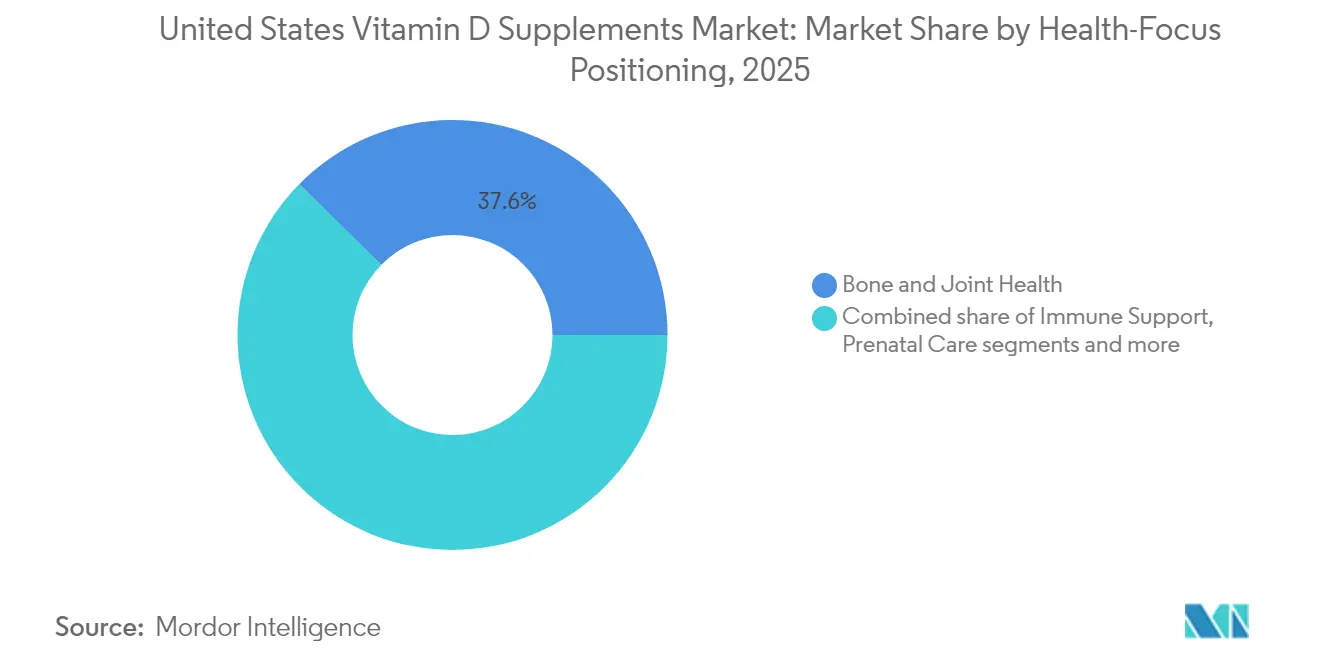
- By health-focused positioning, bone and joint health represented 37.64% of the market share in 2025, while immune support segments are growing at a 5.69% CAGR.
- By distribution channels, specialty, and health stores dominated with 40.79% market share in 2025, though online retailers are experiencing rapid growth with a 6.55% CAGR.
- By geography, the Southern region held 34.21% of market shares in 2025, while the Western region is experiencing the fastest growth at 7.52% CAGR through 2031.
Note: Market size and forecast figures in this report are generated using Mordor Intelligence’s proprietary estimation framework, updated with the latest available data and insights as of 2026.
United States Vitamin D Supplements Market Trends and Insights
Drivers Impact Analysis*
| Driver | (~) % Impact on CAGR Forecasts | Geographic Relevance | Impact Timeline |
|---|---|---|---|
| High prevalence of vitamin D Deficiency among U.S. adults | +1.2% | National, with higher impact in Northeast and Midwest | Long term (≥ 4 years) |
| Aging population seeks vitamin D supplements for osteoporosis | +0.9% | National, with concentration in South and West | Medium term (2-4 years) |
| Expansion of e-commerce and DTC channels | +0.8% | National, with early gains in West and Northeast | Short term (≤ 2 years) |
| Rising endorsments from doctors and healthcare professionals | +0.7% | National, with stronger influence in urban areas | Medium term (2-4 years) |
| Supportive government guidelines and recommendations | +0.6% | National | Long term (≥ 4 years) |
| Growwing demand for preventive healthcare | +0.5% | National, with premium segments in West and Northeast | Long term (≥ 4 years) |
| Source: Mordor Intelligence | |||
High prevalence of vitamin D Deficiency among U.S. adults
Vitamin D deficiency in the United States affects a broad demographic spectrum, creating significant market potential beyond conventional supplement consumption. According to the 2024 National Health and Nutrition Examination Survey NHANES data, over 99% of participants do not meet recommended vitamin D intake levels from food and beverage sources alone [1]. This trend indicates a persistent nutritional gap despite increased awareness and supplementation efforts. Centers for Disease Control and Prevention data from 2024 indicates a notable disparity, with non-Hispanic Black Americans experiencing a 31% deficiency rate compared to 3% among non-Hispanic whites [2]. This demographic variation presents opportunities for targeted product development and distribution strategies. The substantial deficiency rates across population groups suggest potential market expansion through specialized formulations, innovative delivery systems, and demographic-specific marketing approaches.
Aging population seeks vitamin D supplements for osteoporosis
The demand for vitamin D supplements is driven by various health factors, including age-related bone health, hormonal changes, medication effects, and lifestyle considerations. According to the Food and Drug Administration data from 2024, over 10 million Americans have osteoporosis [3]. The National Cancer Institute data from 2025 indicates that prostate cancer patients receiving androgen deprivation therapy require higher vitamin D supplementation (50,000 IU weekly), as standard doses are insufficient to prevent treatment-induced bone loss [4]. These factors contribute to the increased consumption of vitamin D supplements among the elderly population. The growing awareness of vitamin D deficiency, combined with increasing healthcare costs and preventive health measures, further drives market growth. Medical professionals are increasingly prescribing vitamin D supplements as part of comprehensive treatment plans, particularly for patients with limited sun exposure, those following specific diets, or individuals with absorption issues.
Expansion of e-commerce and DTC channels
The digital transformation of vitamin D supplement distribution has altered consumer purchasing patterns, expanded market reach, and reduced dependence on traditional retail channels. Online distribution has improved accessibility across demographic groups and geographic regions. Direct-to-consumer sales allow manufacturers to establish customer relationships while increasing profit margins by eliminating retail intermediaries. This distribution model has effectively reached underserved markets and consumer segments. E-commerce platforms provide consumers with access to personalized supplement formulations and offer convenience and product selection beyond traditional retail capabilities.
Rising endorsments from doctors and healthcare professionals
Healthcare professional recommendations remain the primary driver for vitamin D supplementation decisions. The 2024 Endocrine Society guidelines influence market dynamics by refining clinical protocols. These guidelines discourage routine vitamin D testing for healthy adults under 75 while promoting targeted supplementation for specific groups, including children (1-18 years), pregnant individuals, adults over 75, and people with prediabetes. Clinical practice guidelines now acknowledge vitamin D's broader health implications beyond bone health, including cardiovascular benefits and immune function support, which strengthens healthcare professional recommendations.
Restraints Impact Analysis*
| Restraint | (~) % Impact on CAGR Forecasts | Geographic Relevance | Impact Timeline |
|---|---|---|---|
| Presence of counterfeit products hinders growth | -0.4% | National, with higher impact in online channels | Short term (≤ 2 years) |
| Potential side effects | -0.3% | National | Medium term (2-4 years) |
| Availability of alternative products | -0.2% | National, with stronger impact in health-conscious regions | Long term (≥ 4 years) |
| Raw material scarcity | -0.2% | National, with supply chain dependencies on China | Medium term (2-4 years) |
| Source: Mordor Intelligence | |||
Presence of counterfeit products hinders growth
The dietary supplement market faces significant challenges due to adulteration issues, as evidenced by FDA enforcement actions in 2024-2025. These actions revealed systematic contamination problems affecting market integrity and consumer trust. Notable recalls during this period included: Force Forever - containing undeclared diclofenac and dexamethasone, Vitafer-L Gold Liquid - containing undeclared tadalafil, and VitalityXtra capsules - contaminated with sildenafil and diclofenac. While these contamination incidents primarily affect male enhancement and pain relief supplements, they have triggered increased regulatory oversight and consumer skepticism across the entire dietary supplement market. The FDA has intensified its enforcement efforts, including issuing warnings about tejocote root supplements substituted with toxic yellow oleander. The quality control challenges extend beyond domestic manufacturing to international supply chains, necessitating enhanced testing protocols and supplier verification procedures. In response, the FDA has revised its guidance on New Dietary Ingredient Notifications, implementing stricter safety documentation requirements for manufacturers and establishing stronger barriers to entry for potential fraudulent operators.
Potential side effects
The 2024 Endocrine Society review found limited evidence connecting specific serum thresholds to broader clinical outcomes, resulting in conservative dosing recommendations for low-risk adult patients. The comprehensive clinical trials, including the VITAL study, demonstrated minimal preventive benefits in otherwise healthy participants, which influenced treatment decisions among healthcare providers. Standard laboratory tests may not accurately assess vitamin sufficiency levels across different ethnic groups, making the development of universal dosage guidelines particularly challenging. These emerging scientific findings, combined with ongoing research in the field, support the implementation of moderate dosing approaches rather than high-dose supplementation protocols, particularly in populations without documented deficiencies or specific medical conditions that require elevated supplementation.
*Our forecasts treat driver/restraint impacts as directional, not additive. The impact forecasts reflect baseline growth, mix effects, and variable interactions.
Segment Analysis
By Type: D3 Dominance Drives Innovation
Vitamin D3 accounts for 92.65% market share in 2025 and is growing at a 6.02% CAGR, as it remains the primary form for increasing 25(OH)D levels in the body. The United States vitamin D supplements market revenue for D3 products is projected to maintain this growth pattern through 2031, driven by increasing consumer awareness about vitamin D deficiency and its health implications. Vitamin D2 maintains its position in vegan supplements and food fortification applications, particularly after the Federal Register approved UV-treated mushroom powder as a source, offering plant-based alternatives to traditional vitamin D supplements.
Manufacturers are developing enhanced formulations using calcifediol complexes that offer improved absorption rates, targeting consumers who need higher bioavailability due to medical conditions or absorption issues. While research continues on provitamin D3-enriched tomatoes as a potential alternative source, production capabilities, scalability challenges, and regulatory approval processes will determine implementation timelines. The development of these innovative delivery methods reflects the industry's response to growing consumer demand for more effective vitamin D supplementation options.

By Form: Capsules Lead Market Share While Gummies Show Fastest Growth
Capsules and softgels held a 34.12% market share in 2025, primarily due to their precise dosing capabilities and healthcare professional endorsements. These formats gained widespread adoption because of their easy-to-swallow nature, oxidation protection, and uniform absorption characteristics. Gummy supplements recorded the highest growth at 6.62% CAGR, driven by consumer demand for convenient and palatable options. The appealing taste and child-friendly characteristics of gummies have shaped consumer buying patterns. Pharmavite's Ohio manufacturing facility has increased domestic production capacity, while research continues to advance nutrient stability at room temperature.
Traditional tablets remain popular among price-sensitive consumers due to their lower manufacturing costs and longer shelf life. Powders provide flexible dosing options and mix easily with drinks or food, attracting health-focused consumers. Liquid supplements serve infants and people with swallowing difficulties, offering quick absorption and easy administration. In addition, sales typically increase during winter months when sun exposure decreases and immune health concerns rise, with e-commerce promotions boosting purchases of flavored chewable products.
By Source: Plant-Based Surge Reflects Values Shift
Animal-based vitamin D supplements constitute 70.58% of vitamin D production in 2025, while plant-based/vegan alternatives experience growth at a 7.01% CAGR. Consumer demand for sustainable products drives the adoption of mushroom-derived vitamin D2 and yeast-based vitamin D3 alternatives. The shift toward plant-based options aligns with environmental awareness and ethical considerations. Protein alternatives fortified with vitamin D3 maintain over 90% nutrient stability during processing, enabling manufacturers to expand into diverse product categories. This stability ensures consistent nutritional content across food and beverage applications.
The production of synthetic vitamin D ensures consistent quality across batches while minimizing variations in potency and purity. The synthetic manufacturing process enables better control over production parameters, including temperature, pressure, and reaction conditions, which maintains stable supply throughout the year. This method reduces reliance on seasonal raw materials and weather-dependent harvesting cycles. Manufacturers maintain low contamination levels through rigorous quality control measures, automated production systems, and sterile manufacturing environments in response to consumer safety concerns. Source transparency, including detailed product labels showing manufacturing dates, batch numbers, and quality parameters, along with third-party certifications from recognized testing laboratories, has become a distinguishing factor that strengthens consumer confidence. These certifications often include comprehensive analyses of product purity, potency, and absence of contaminants.
By Health-Focus Positioning: Bone Health Dominates While Immune Support Shows Fastest Growth
Bone and joint health maintains the largest market share at 37.64% in 2025, driven by vitamin D's essential role in calcium absorption and bone mineralization. The immune support segment demonstrates the highest growth potential with a 5.69% CAGR through 2031. Research validating vitamin D's cardiovascular benefits has expanded market opportunities, with cardiovascular institutes recommending individualized vitamin D supplementation based on patient risk factors. The prenatal care segment continues to grow as medical guidelines advocate vitamin D supplementation during pregnancy to improve maternal outcomes and fetal development.
The health-focused segments reflect broader recognition of vitamin D's diverse health benefits beyond bone health, including immune function, cardiovascular health, and metabolic regulation. Ongoing research into vitamin D's potential role in cancer prevention and cognitive function may create new market opportunities, pending conclusive clinical evidence. Market positioning increasingly focuses on preventive healthcare, aligned with consumer preferences for proactive health management.
By Distribution Channel: Specialty Health Stores Lead Distribution as E-commerce Gains Ground
Specialty and health stores command a 40.79% market share in 2025, driven by pharmacist consultations, personalized recommendations, and specialized product selections. Online retail channels demonstrate a 6.55% CAGR, aligning with broader e-commerce market patterns. Subscription services ensure regular purchases through customized delivery schedules, while digital recommendation systems suggest premium products based on consumer preferences and purchase history. The United States vitamin D supplements market's digital distribution channels expand through enhanced delivery capabilities and improved user experience.
Supermarkets and hypermarkets provide high visibility for mainstream consumers through strategic shelf placement and promotional displays, while pharmacies utilize insurance-based loyalty programs and professional consultation services to promote condition-specific supplements. Successful market players maintain consistent brand positioning across physical and digital channels, combining professional expertise with online accessibility and seamless shopping experiences.
Geography Analysis
The South accounted for 34.21% of revenue in 2025, driven by its large population, high obesity rates, and increased osteoporosis prevalence. Despite abundant sunlight exposure, vitamin D deficiency remains common among non-Hispanic Black residents. Regional outreach programs incorporate culturally relevant messaging and offer capsule or chewable formats preferred by older consumers. Pharmacist-led education programs continue to influence purchasing decisions through established patient relationships.
The Western region shows a 7.52% CAGR, driven by increased focus on preventive healthcare and consumer adoption of direct-to-consumer testing kits that combine supplements with personal health tracking. Subscription-based delivery services increase vitamin D purchase frequency, while plant-based options appeal to environmentally conscious consumers. Retailers combine vitamin D products with functional beverages and plant-protein snacks to increase sales.
The Northeast and Midwest regions experience seasonal vitamin D deficiency due to reduced UVB exposure during winter months, leading to increased sales from October through March. Healthcare providers combine vitamin D awareness initiatives with flu vaccination programs as part of comprehensive public health campaigns. Manufacturers align their promotional strategies with these seasonal patterns, maintaining peak demand despite reduced deficiency risk during summer months.
Regulatory Landscape
In the United States, vitamin D supplements are regulated under the Dietary Supplement Health and Education Act (DSHEA). The FDA enforces current Good Manufacturing Practice (cGMP) controls for dietary supplements, including finished products under 21 CFR Part 111. The established Daily Value for vitamin D is 20 mcg (800 IU) for adults and children aged 4 years and older, which anchors on-pack labeling and percent DV declarations across product formats.
Vitamin D2 and D3 are permitted as ingredients under 21 CFR 184.1950. Structure/function claims must be truthful, substantiated, and accompanied by the FDA disclaimer, without implying disease treatment or cure. Federal guidance also frames dosing messages for special populations, for example 400 IU/day is cited for breastfed infants, shaping labeling and consumer communication in pediatric formats.
Value Chain Analysis
The United States vitamin D supplement value chain starts with bulk input sourcing, including cholecalciferol for D3, with a high degree of import dependence. It then moves through domestic steps such as receipt and quarantine, identity and quality testing, formulation with excipients, and finished-dose manufacturing across tablets, softgels, capsules, gummies, powders, and liquids. Regulatory compliance is embedded via FDA dietary supplement cGMP controls (21 CFR Part 111), strengthening traceability and batch documentation from incoming materials to packaging.
Downstream, products move through a multi-channel distribution system that includes specialty and health stores, pharmacies, mass retail, and expanding e-commerce and direct-to-consumer models. These models add subscription fulfillment and digital merchandising to the chain. Supply chain signaling relies on third-party testing and recognized verification marks to support consumer trust in a fragmented market, while seasonal demand patterns and online price transparency pressure manufacturers and contract packers to maintain flexible production scheduling and inventory buffers.
Competitive Landscape
The United States vitamin D supplements market exhibits significant fragmentation, creating opportunities for both established pharmaceutical companies and specialized supplement manufacturers to capture market share through differentiated positioning and innovative product development. This fragmented structure reflects diverse consumer preferences across age groups, health conditions, and delivery mechanisms, from traditional tablets to innovative gummy formulations that appeal to different demographic segments.
Major players in the market include Amway Corporation, Nestlé S.A., andHarbin Pharmaceutical Group, among others. These players are adopting various strategies such as product innovations, partnerships, expansions, mergers, and acquisitions. The competitive dynamics increasingly favor companies that can navigate complex regulatory requirements while delivering clinically validated formulations that align with evolving healthcare provider recommendations and consumer health priorities.
Strategic differentiation occurs through multiple vectors, including bioavailability enhancement, delivery system innovation, and targeted health positioning that addresses specific consumer segments and clinical applications. White-space opportunities exist in personalized supplementation approaches, plant-based formulations for vegan consumers, and specialized applications for high-risk populations such as prostate cancer patients requiring high-dose vitamin D protocols that exceed standard supplementation recommendations.
United States Vitamin D Supplements Industry Leaders
-
Haleon PLC
-
Nestlé S.A.
-
Harbin Pharmaceutical Group
-
The Procter & Gamble Company
-
Amway Corporation
- *Disclaimer: Major Players sorted in no particular order
Market Opportunities and Future Outlook
The 2024 Endocrine Society guideline supports empiric vitamin D supplementation for defined risk groups, creating whitespace for age-specific dosing formats (chewables, liquids, and gummies) and condition-linked positioning that stays within DSHEA structure and function claim rules.
Quality and compliance-led brand building is a differentiator as FDA oversight and broader supplement adulteration concerns increase the value of transparent labeling, lot traceability, and third-party verification in online channels. Portfolio and channel expansion also intersects with capacity investments and brand portfolio reshaping among large players, which can open shelf space and online search visibility for focused vitamin D specialists, private-label manufacturers, and science-positioned brands that substantiate claims while maintaining strong cGMP execution.
Recent Industry Developments
- April 2026: Nestle completes a strategic portfolio realignment, expanding the premium vitamin D focused brands in the US by accelerating integration of Garden of Life, Solgar and Pure Encapsulations into its distribution network. The move shifts competitive dynamics in the premium segment and tightens channel access for mass-market offerings.
- November 2025: Nestle announces a strategic review of several mainstream vitamin, mineral, and supplement brands, including Nature's Bounty, Osteo Bi-Flex, Puritan's Pride, and its US private label operations, with divestment options under consideration. The action could alter volume allocation and manufacturing relationships for contract packers and mid-sized brands.
- December 2024: Haleon announces plans to localize production of Centrum multivitamins in Pakistan for domestic and export markets, including products that incorporate vitamin D. This localization can influence global supply allocation and manufacturing flexibility for Centrum SKUs competing in the US multivitamin segment.
Research Methodology Framework and Report Scope
Market Definition and Coverage
This market covers the value of vitamin D dietary supplement products sold in the United States through retail and online channels, across common consumer dose forms and vitamin D types, measured in current USD.
Scope exclusions: It excludes vitamin D obtained from fortified foods, prescription-only vitamin D medicines, and clinical nutrition delivered in inpatient care.
Segmentation Overview
- By Type
- Vitamin D2
- Vitamin D3
- By Form
- Tablets
- Capsules and Softgels
- Gummies
- Powders
- Liquid
- Others
- By Source
- Synthetic
- Animal-Based
- Plant-Based/Vegan
- By Health-Focus Positioning
- Bone and Joint Health
- Immune Support
- Prenatal Care
- General Wellness
- Others
- By Distribution Channel
- Supermarkets/Hypermarkets
- Specialty and Health Stores
- Online Retailers
- Other Distribution Channels
- By Geography
- Northeast
- Midwest
- South
- West
Data Sources, Market Sizing, and Validation
Desk Research
Desk work starts by lining up the market boundaries with public guidance and measurable consumption signals. We review sources such as the NIH Office of Dietary Supplements fact sheets, CDC and NHANES nutrition and biomarker datasets, and FDA dietary supplement labeling and enforcement pages to understand usage, claims, and compliance basics.
To anchor the market context, we also use materials such as U.S. Census retail indicators, USITC trade statistics for relevant ingredient and finished product flows (where classification allows), and peer reviewed nutrition journals that discuss deficiency prevalence and intake patterns. Company annual reports, investor presentations, and reputable press coverage help with brand strategy cues, channel mix direction, and pricing narrative. When needed, paid databases are used for company financials and for patent landscaping to check innovation intensity. These examples are not exhaustive, and many other public sources were reviewed for collection, validation, and clarification.
Primary Interviews and Surveys
Primary work is used to pressure test the desk assumptions with practitioners who see volumes and pricing in real life, such as brand managers, contract manufacturers, ingredient suppliers, distributors, and channel specialists across pharmacy, mass retail, and e-commerce. We also speak with nutrition focused clinicians and consultants to sanity check adoption drivers (for example, screening behavior and typical dose recommendations) and to confirm what is actually treated as a supplement purchase in the US context.
Distribution of primary research fieldwork respondents
| Company type | Respondent position |
|---|---|
| Top tier: 37% | CXOs: 12% |
| Mid tier: 48% | Functional/Unit leaders: 34% |
| Smaller Players: 15% | Managers: 54% |
Market-Sizing & Forecasting
Sizing is built by starting from a top-down demand pool, where adult and pediatric supplement user bases are reconstructed from public health survey signals and then translated into annual spending using typical frequency, pack sizes, and observed price bands. That spend pool is then adjusted for channel split and for the share that is reasonably attributable to vitamin D products rather than broader multivitamins.
To keep the numbers realistic, we corroborate totals with selective bottom-up approximations, such as sampling shelf prices across major retail formats, checking online list price ranges, and rolling up a limited set of supplier and brand revenue indicators where disclosures are available. Key inputs used in the model include vitamin D deficiency prevalence proxies, seasonality linked to winter demand and immune health messaging, shifts in D2 versus D3 mix, average dose strength trends that change unit counts per pack, and the balance between pharmacy led sales and online repeat purchases. If a bottom-up view is incomplete due to private company opacity, we fill gaps using conservative channel shares and price bands validated through interviews.
Forecasts are developed using scenario analysis supported by short time series smoothing on the base demand drivers, and then checked against expert views on consumer health trends, regulatory attention on claims, and expected pricing movement in the next few years.
Data Validation & Update Cycle
Validation is done through multiple checks so that each big assumption is tested in more than one way. We compare outputs against independent indicators, such as implied per user annual spend, channel growth signals, and whether the D2 and D3 split stays within realistic ranges for US shelves.
When outliers show up, the logic is traced back to the input driver and the assumption is reworked, followed by a second analyst review before sign-off. If new rules, recalls, or major channel shifts occur, experts are re-contacted to confirm whether demand or pricing behavior changed materially. Reports are refreshed annually, and before delivery a final pass is completed so the latest market moving events are reflected in the numbers.
Mordor Intelligence's United States Vitamin D Supplement Market Growth Trends and Forecast Market Size Versus Other Published Estimates
Published numbers for this market do not always line up because authors often start from different demand anchors and they also treat adjacent categories differently. Differences in base year, the way prices are averaged across channels, and how fast assumptions are refreshed can also move the final value by a noticeable margin.
Some external figures blend vitamin D supplements with broader vitamin D consumption, including fortified foods or mixed vitamin bundles, and this pushes totals upward even if the same consumer need is being discussed. In Mordor Intelligence's view, only stand-alone vitamin D supplement products sold in the United States are counted, and prescription vitamin D and fortified food intake are kept out so the demand pool matches retail supplement spending.
Benchmark comparison
| Source | Market Size | Gaps in Research Methodology |
|---|---|---|
| Mordor Intelligence | USD 1.56 B (2025) | |
| Global Consultancy A | USD 1.80 B (2024) | Uses an earlier base year and may apply a broader product set with mixed forms and channels, then projects a higher growth path with less clarity on how average price changes are handled across retail versus online. |
| Industry Publisher B | USD 0.78 B (2023) | Starts from a smaller measured pool that can undercount modern e-commerce sales and specialty retail, and it may keep price assumptions conservative without fully adjusting for higher-dose formats that lift per-pack value. |
The spread is mainly explained by what gets included around supplements, how channel pricing is averaged, and which base year anchors the math. By keeping the scope tied to supplement purchases and by cross-checking unit economics against channel signals, our estimate stays traceable to clear inputs that can be revisited when conditions change.
Key Questions Answered in the Report
What is the current value of the US vitamin D supplements market?
The United States vitamin D supplements market stood at USD 1.64 billion in 2026 and is anticipated to reach USD 2.12 billion by 2031.
Which product type dominates sales?
Vitamin D3 accounts for 92.65% of 2025 revenue and maintains leadership due to superior bioavailability.
Why are gummies growing so quickly?
Gummies combine palatable flavors with ease of use, helping compliance and posting a 6.62% CAGR, the fastest among all formats.
Which region is expanding the fastest?
The West leads with a projected 7.52% CAGR, driven by digital health adoption and proactive wellness attitudes.